
Interpretation of the encryption market trend from nine indicators: 8.35 million BTC is at a loss, and many indicators have fallen to historical lows
Since the beginning of this year, due to the multiple impacts of tightening monetary policies in many countries and repeated global epidemics, the encryption market has entered a downward trend of severe shocks. According to CoinGecko statistics, the total market capitalization of the crypto market fell below the $1 trillion mark on June 14, the first time since February 2021. So far, the total market value of the encryption market has "evaporated" by about 1.32 trillion U.S. dollars this year, a drop of more than 57%. In the face of the decline, the market sentiment is very "panic". Alternative's Fear & Greed index has been below 10 in the near future, which is at an extremely low level since 2018.
Needless to say, the market has entered a downturn. The new question is, how far has the market fallen now? Will it continue to fall? Bear market data in previous years may provide some reference for thinking. PAData has compared and analyzed the performance of nine market indicators of the representative asset BTC during three market downturns since January 1, 2017. Among them, the three market downturn periods are selected as August 1, 2018 to March 31, 2019, March 1, 2020 to June 30, 2020, and April 1, 2022 to June 13, 2022. Day, because the highest value of the BTC price in this time domain does not exceed the previous high on the left and contains at least one lowest value. The analysis found:
1) The "bubble" of the current BTC price has been squeezed out to a large extent, but compared with the previous two market downturns in history, the current price is not as good as the fair value provided by the transaction and the actual value provided by the mining industry. There is room for continued pressure. But the current price has deviated more than the circulation value brought about by the scarcity of supply. The degree of deviation between future price and value actually depends to a large extent on the extent to which scarcity is recognized by the market, or under what circumstances the value brought by scarcity will surpass other values.
2) The current market is the same as the previous two downturns in history. Loss chips increase rapidly, the ratio of profit and loss chips further shrinks, short-term investment returns are higher, and market reserve risks are low. This indicates that the market game may intensify, but the return on investment is attractive at this time. It is worth noting that at the end of the previous two downturns, the three indicators of profit and loss chip ratio, SOPR ratio and reserve risk all showed a trend of picking up, or at least remained relatively stable, but this has not been seen in the current period.
first level title
01
The current market price is further de-bubbled, but still higher than the fair value
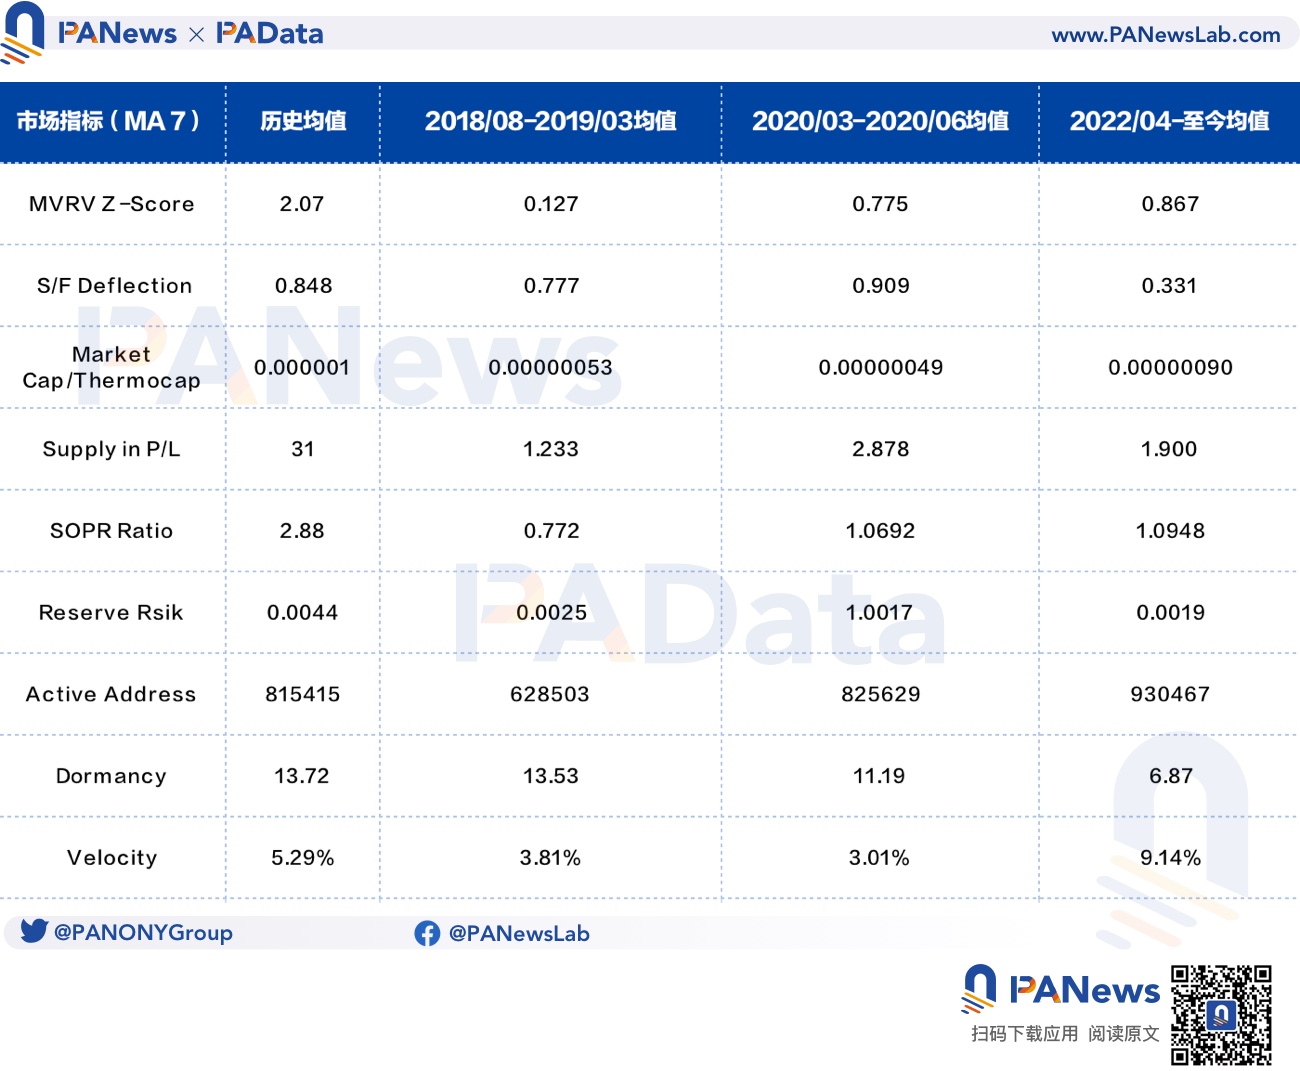
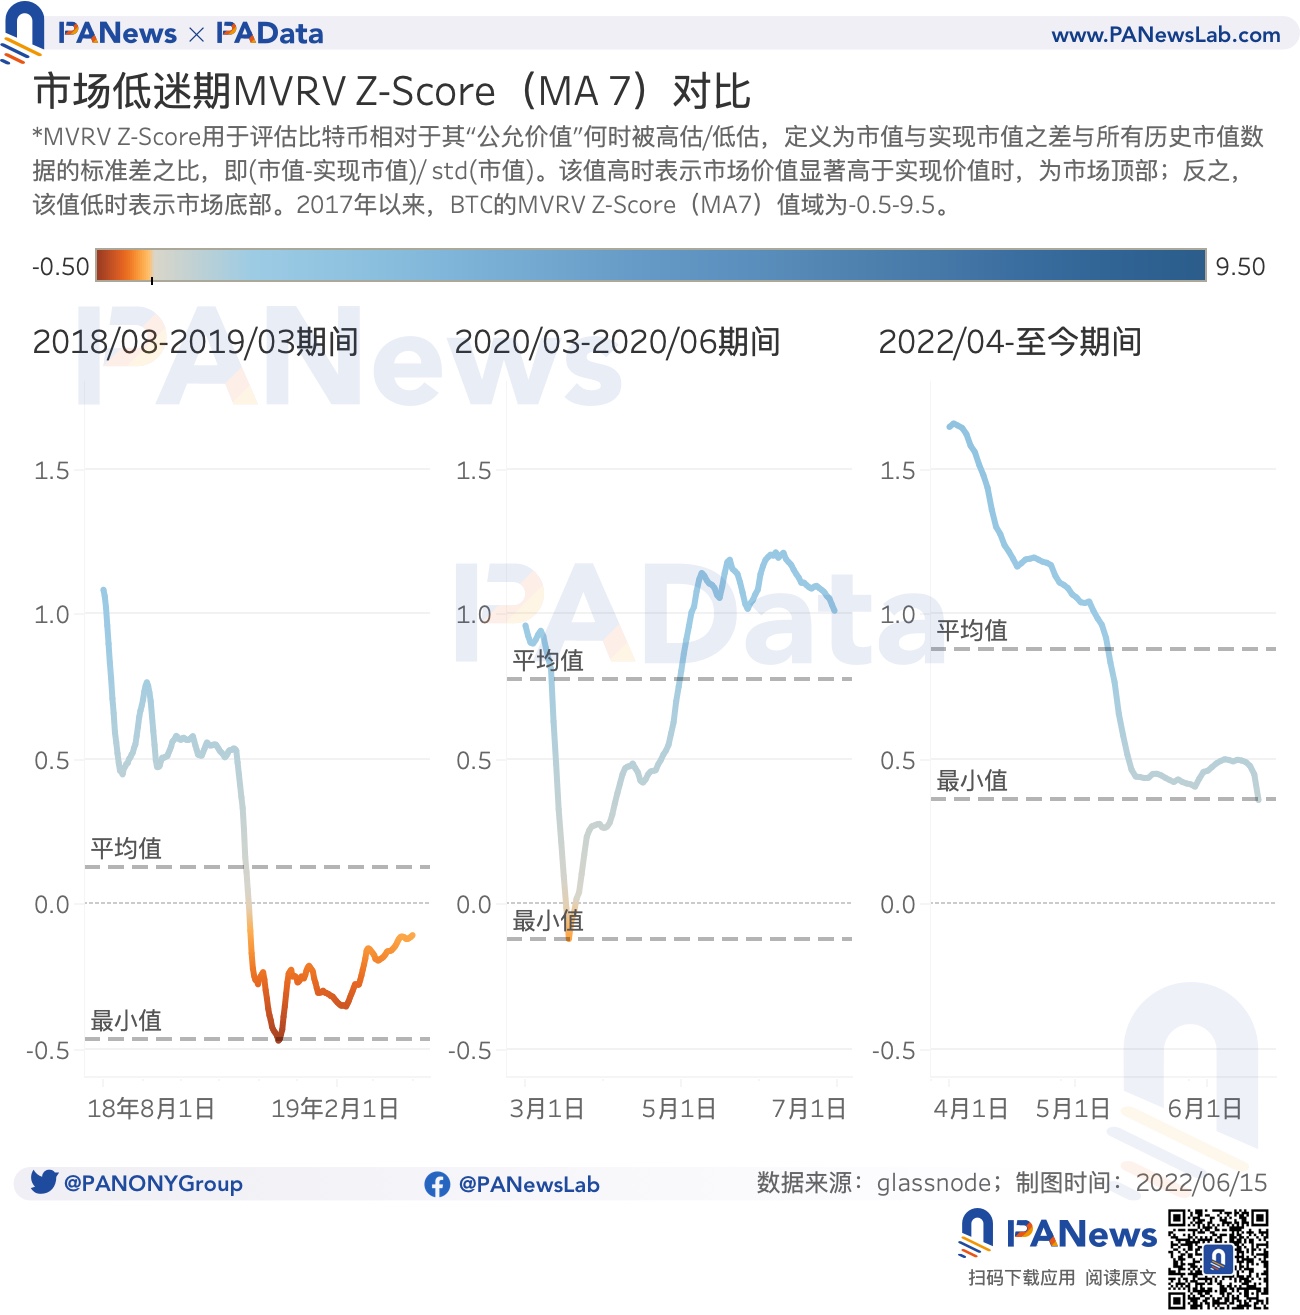
Price is based on value and fluctuates around value. The evaluation of the value of BTC usually comes from 3 aspects, the first aspect is the fair value of the actual transaction. The MVRV Z-Score indicator is usually used to assess the degree of deviation of the price of BTC from the fair value, that is, the degree of deviation between the current price and the transaction price when the asset was last moved. The lower the value, the lower the price is below the fair value. This usually occurs at market bottoms and vice versa. According to statistics, the average historical MVRV Z-Score (MA7, omitted below) of BTC since 2017 is 2.07, the average value from April 2022 to the present is 0.876, and the minimum value is as low as 0.358, that is, the current MVRV Z-Score has already It is at an extremely low value in history, which indicates that the current price deviates very little from the fair value of the transaction, and the price has been "de-bubbled", but it is still higher than the fair value.
Moreover, the mean values of MVRV Z-Score for the two periods from August 2018 to March 2019 and March 2020 to June 2020 were 0.127 and 0.775, respectively, and the minimum values were -0.471 and -0.121, both lower than Average and minimum values for the current period. This means that compared with the previous two market downturns in history, the current price defoaming is smaller, and there has not been a negative MVRV Z-Score, that is, the price has not fallen below the fair value of the transaction.
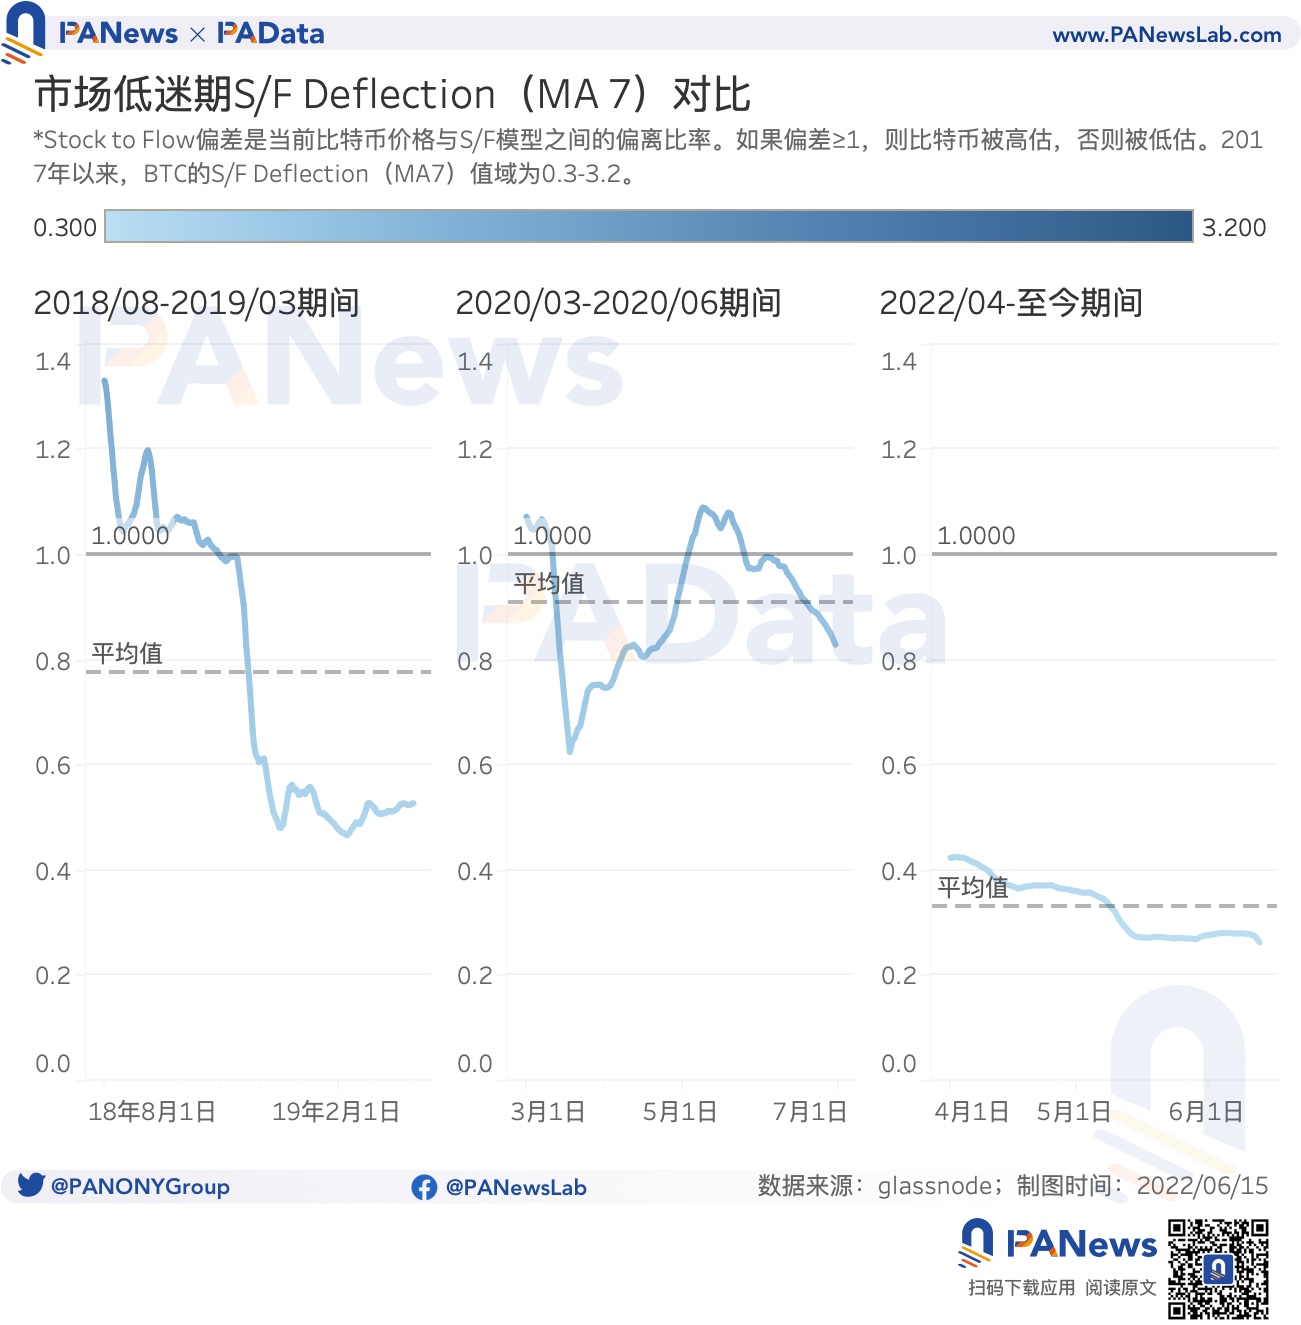
The second aspect to measure the value of BTC is the circulation value brought about by the scarcity of supply. The S/F model is currently the mainstream model for evaluating the circulation value in the market. The S/F Deflection indicator based on this can understand the deviation degree of the price of BTC relative to the circulation value. The indicator uses 1 as the dividing line. If the value is <1 and the smaller it is, it means that the current BTC price is lower than the circulation value, and the current price is more undervalued. This situation usually occurs at the bottom of the market, and vice versa. According to statistics, the average value of BTC's historical S/F Deflection (MA7) since 2017 is 0.848, which means that overall, even if BTC is currently "diving", its price is still higher than the circulation value. Next, let’s look at the performance of this indicator during the three market downturns. The average value from April 2022 to the present is 0.3307, which is significantly less than 1, and has a historically low value, which means that the current BTC price and circulation value have a significant negative deviation and are underestimated. more likely.
In comparison, the average values of S/F Deflection for the two periods from August 2018 to March 2019 and March 2020 to June 2020 were 0.7769 and 0.9092, both <1. It can be seen that during the market downturn, the price of BTC is usually underestimated relative to the value of circulation. Moreover, the average S/F Deflection in the current period is lower than in the previous two downturns, which means that the current price is more likely to be undervalued.
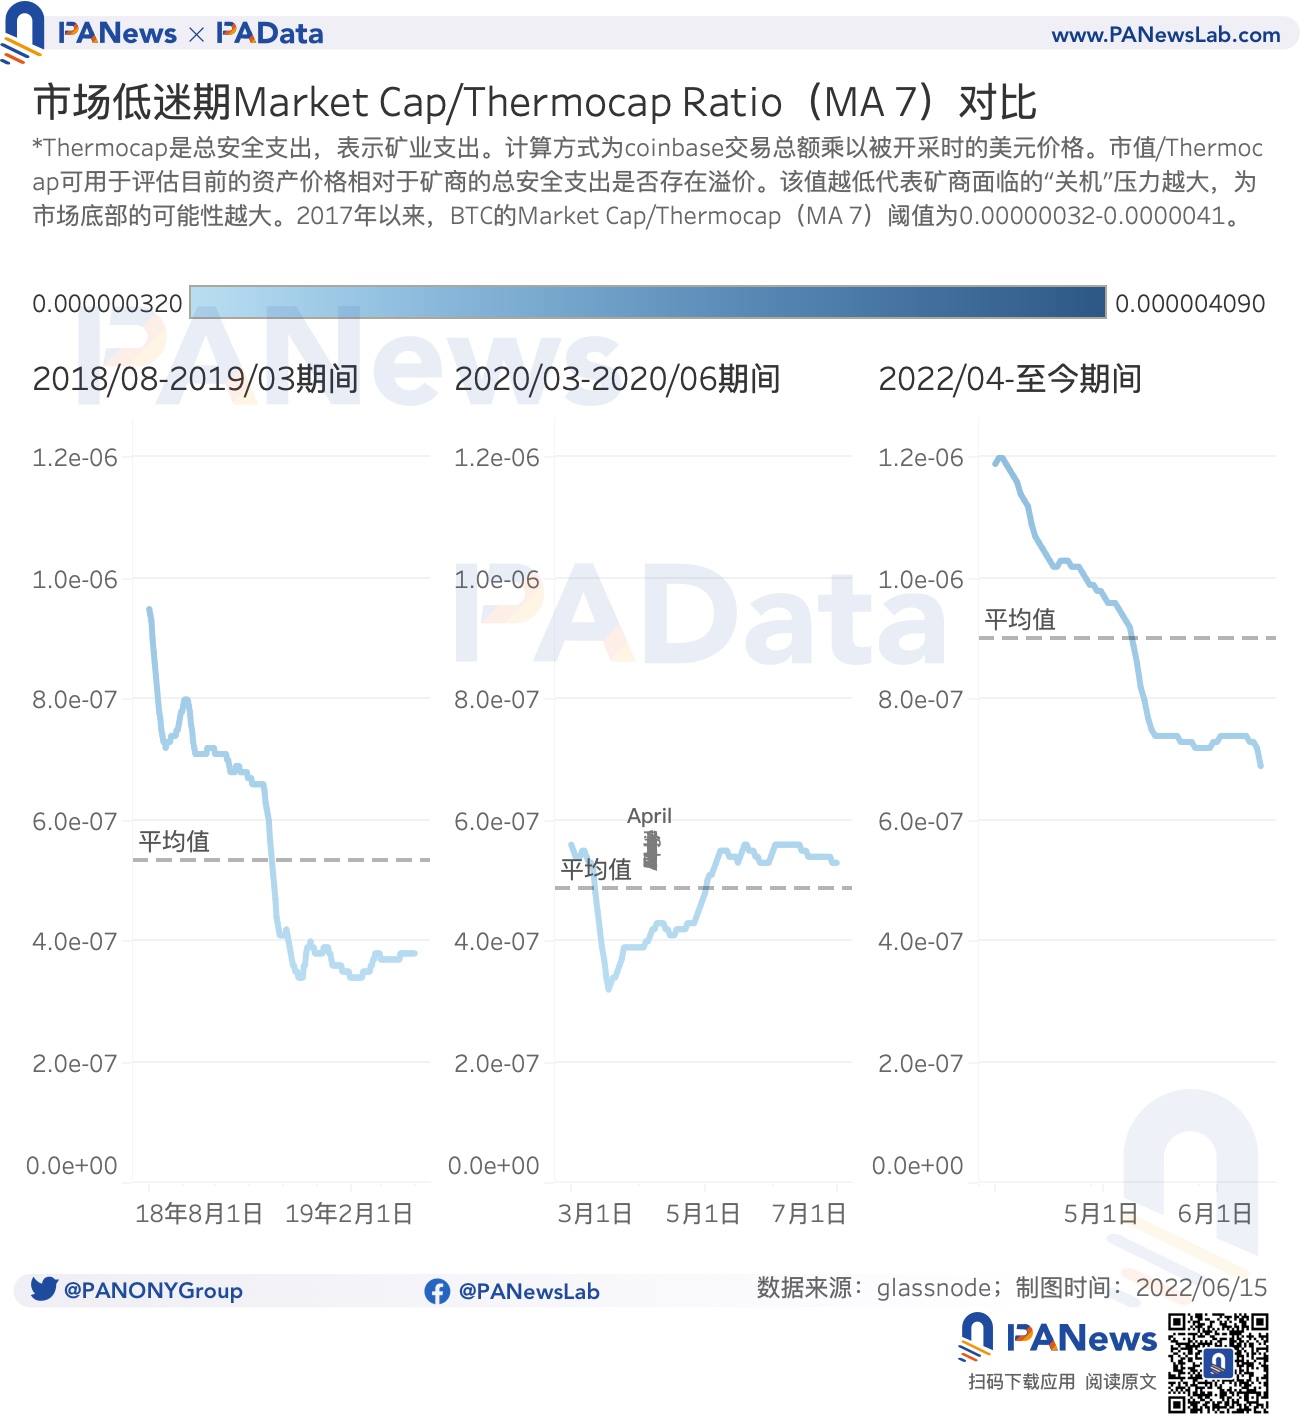
Mining is the underlying supporting industry of the encryption industry and the source of actual value of encrypted assets. Among them, the total cost paid by miners for maintaining network security provides a third source of BTC value evaluation. Market Cap/Thermocap Ratio is an indicator currently used in the market to measure whether there is a premium for the current price relative to miners’ security expenditures. The lower the value, the closer the current value is to the miners’ security expenditures, and the more pressure miners face to “shut down” Big, which usually also occurs at market bottoms, and vice versa. According to statistics, the average value of BTC's historical Market Cap/Thermocap Ratio (MA7) since 2017 is 0.000001049, and the average value from April 2022 to the present is 0.0000008999, which is significantly lower than the historical average and is at an extremely low level in history, which means that the current The price has fallen to a range close to the actual value, and the deviation from the actual value has been greatly reduced.
However, compared to the average values of Market Cap/Thermocap Ratio in the two periods from August 2018 to March 2019 and March to June 2020, which were as low as 0.0000005342 and 0.0000004857, respectively, the value in the current period is even lower. High, that is, the degree of deviation between the current price and the actual value is higher than that of the previous two downturns.
first level title
02
The current loss chips are significantly higher than the historical average, but the return on investment is more attractive
The distribution of profit and loss chips, long-term and short-term investment returns, and investment confidence are also three important dimensions for observing the market. From the perspective of the distribution of profit and loss chips, that is, from the perspective of the number of assets whose price at the time of the last move was higher than the current price, as of June 13, a total of about 8.35 million BTC was in a state of loss. You must know that since 2017, the average number of BTC loss chips is only about 3.95 million BTC, which means that the current number of loss chips is significantly higher than the historical average and is at a historically high level.
In addition, the average number of losing chips in the current period is about 6.83 million BTC, which is higher than the average of about 5.61 million BTC from March 2020 to June 2020, but still lower than the average value from August 2018 to March 2019 The average value of about 8.03 million BTC. Generally speaking, during the market downturn, the number of loss-making chips is relatively large. It is worth noting that the number of losing chips in the current period is on the rise. If this trend continues, the average value of losing chips in the current period will likely continue to grow, even surpassing the period from August 2018 to March 2019.
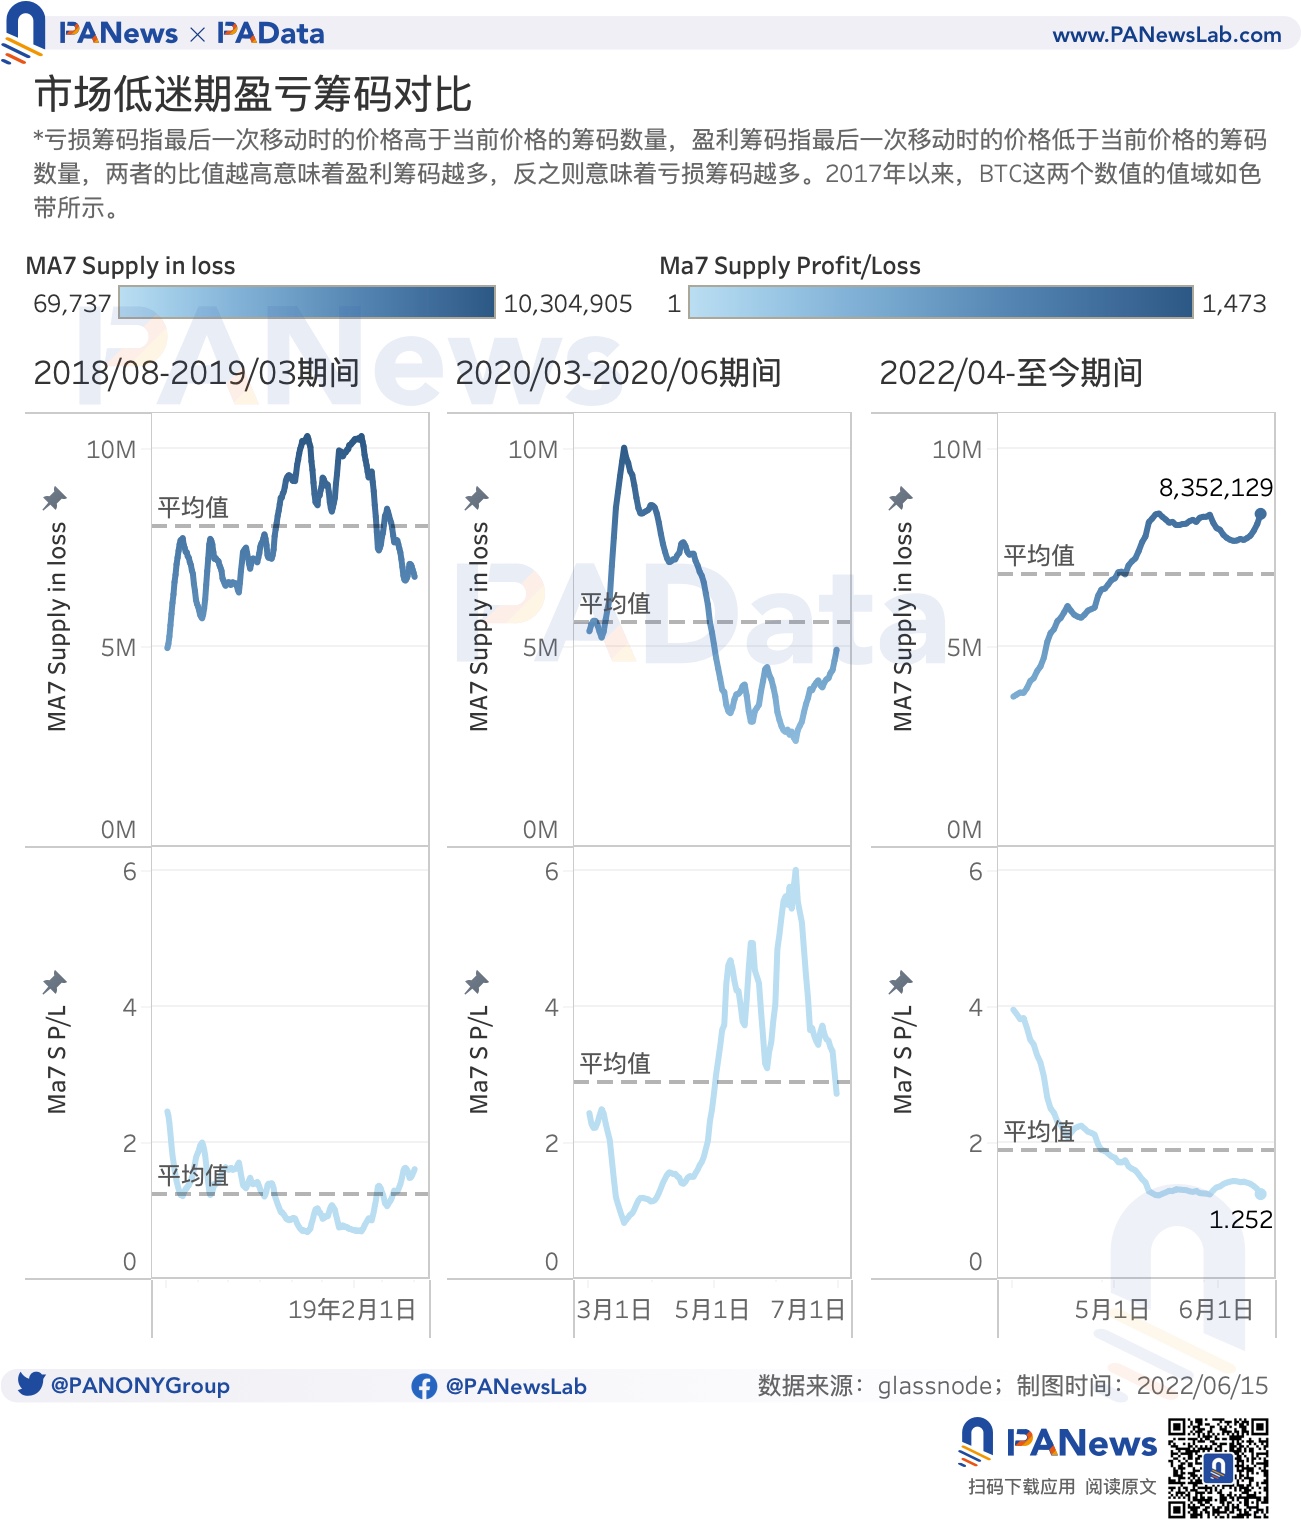
The data performance of the ratio of profit and loss chips is consistent with the data performance of loss chips. Since 2017, the average ratio of BTC's profit-to-loss chip ratio is 31, which means that overall, there are still more profitable chips than losing chips, and in extreme cases, most of the chips are profitable. However, as of June 13, the ratio of profit and loss chips has fallen to 1.252, which is at an extremely low level in history. That is to say, the gap between the current profit chips and loss chips has further narrowed, and the market game may intensify.
The mean chip ratios for the period August 2018 to March 2019 and March 2020 to June 2020 were approximately 1.233 and 2.878, respectively, compared to the average for the current period during the market downturn. It is also at a lower level in horizontal comparison.
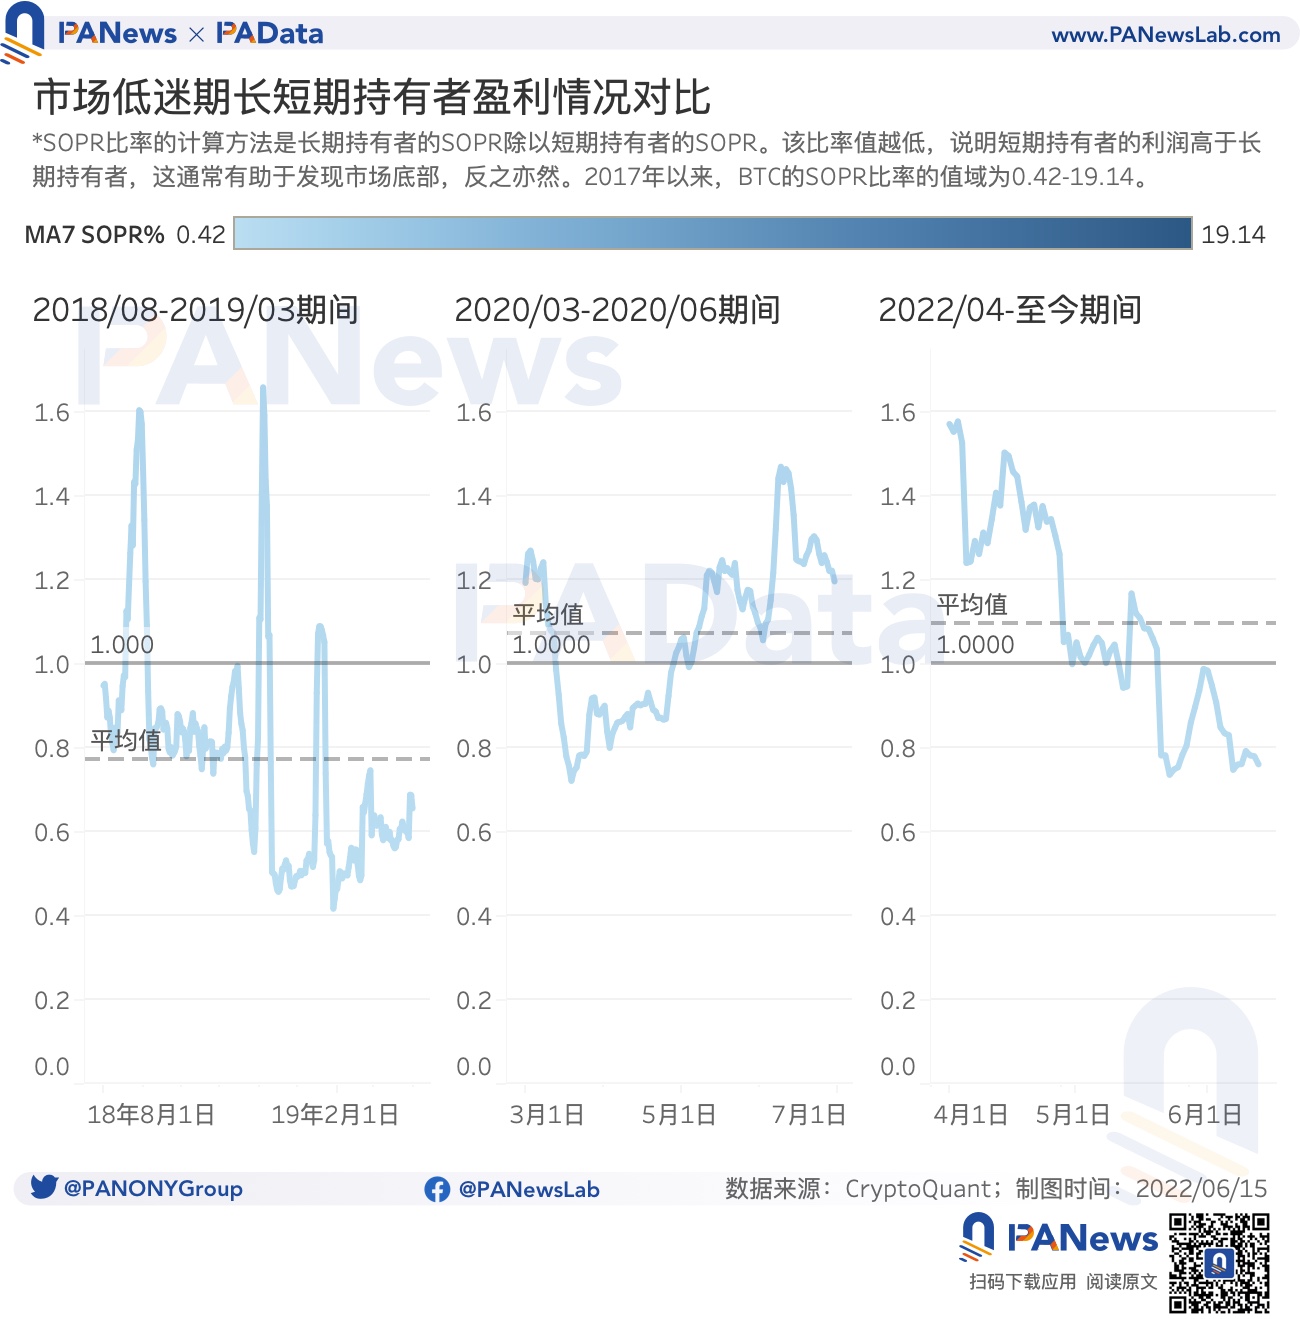
Under different market trends, the holding time of investors is also very different. Generally speaking, if the market is rising to the top, the volatility is small, and investors' long-term (≥155 days) returns may be higher. On the contrary, if the market is falling to the bottom, the volatility is large, and investors' short-term (> 1 hour and less than 155 days), the income may be higher. The ratio between the two is SOPR Ratio, which is bounded by 1. The value greater than 1 indicates that the long-term return is higher, and the market is more likely to be at the top, and the value less than 1 indicates that the short-term return is higher, and the market is more likely to be at the bottom. According to statistics, BTC's historical average SOPR Ratio since 2017 is 2.88, which means that so far, long-term investors still have higher returns. But as of June 13, the value has dropped to 0.76, that is, for now, short-term investors have higher returns, and the returns of short-term investors are at a historically high level, which means that the market is closer to the low point.
From the average point of view, the average value of SOPR Ratio in the current period is 1.0948, which is relatively close to the average value of 1.0692 from March 2020 to June 2020, both slightly higher than 1, that is, during these two downturn periods, long-term investment Returns are still slightly higher. However, the average value from August 2018 to March 2019 was only 0.772, which was significantly lower than 1, which meant that short-term investors had higher returns at that time. But what deserves continuous attention here is that from the trend point of view, the downward trend of this value during the current period is still very obvious.
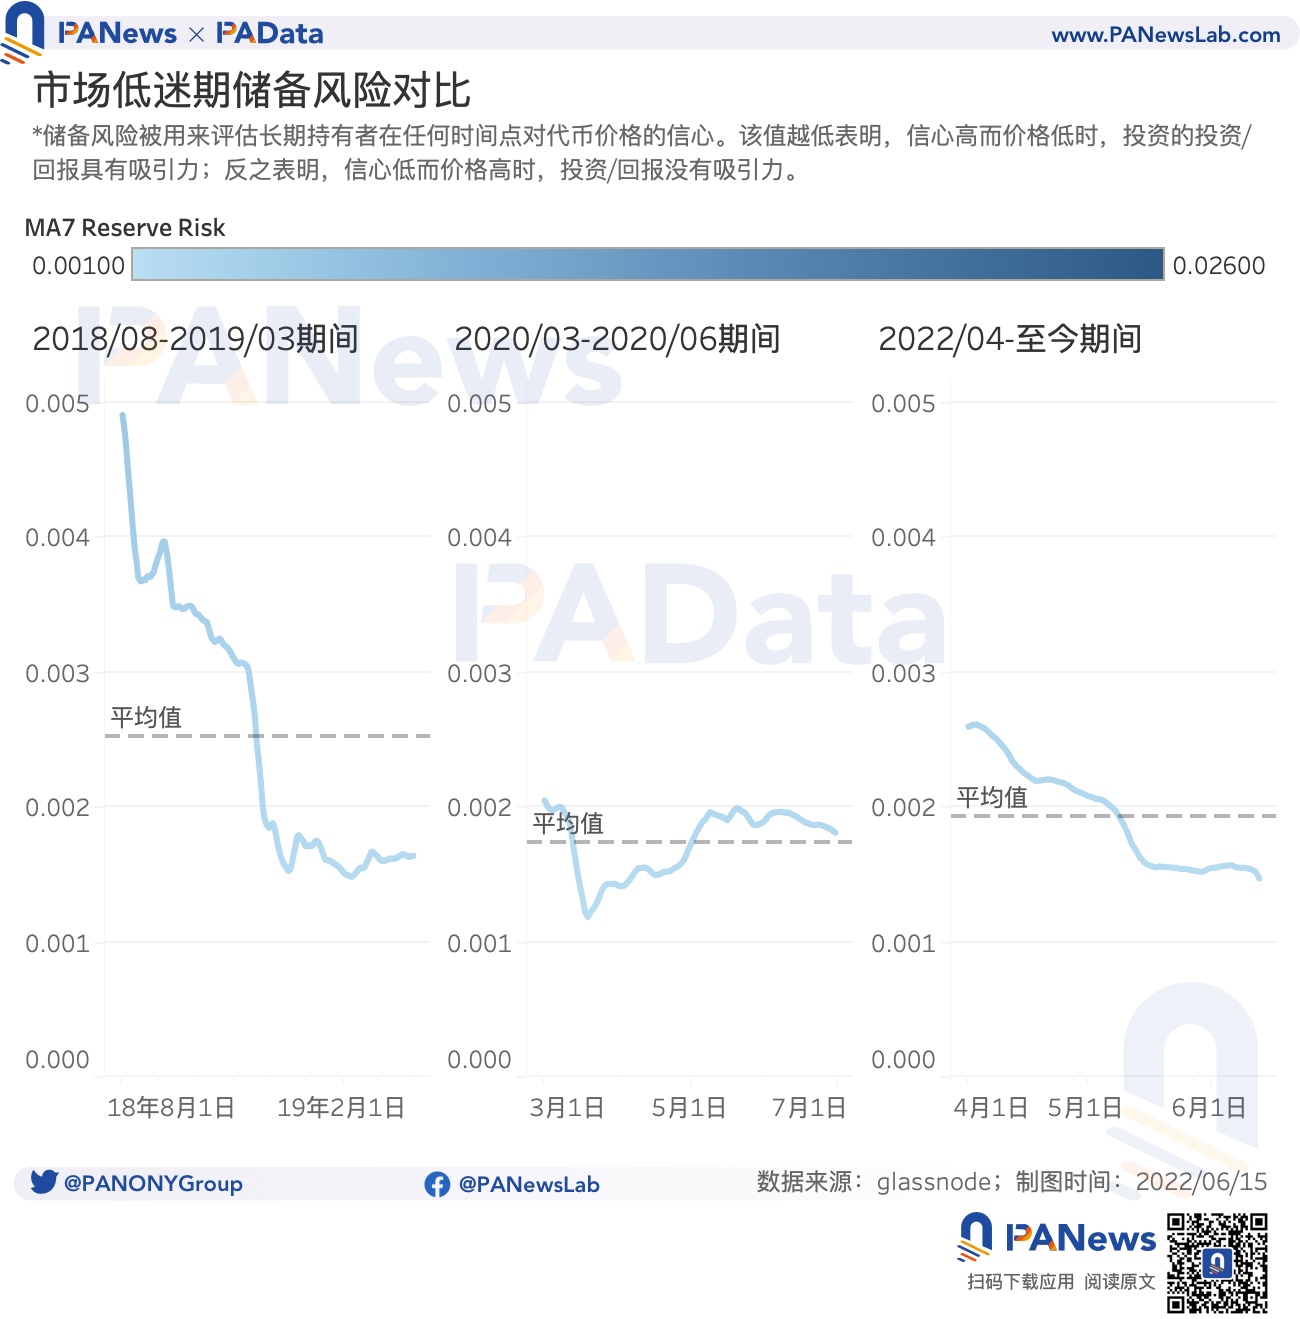
Still, the return on investment on current assets is attractive. Reserve risk is a commonly used indicator to measure market confidence. The lower the value, the higher the confidence and the lower the price, and the investment return is attractive. Conversely, the lower the confidence and the higher the price, the investment return is not attractive. According to statistics, the average historical reserve risk of BTC since 2017 is 0.0044, and the average value of the current range is 0.0019, which is lower than the historical average and close to the historical low, which shows that current investors still have confidence in BTC, and the return on investment is promising. attractive. The average value of this value in the previous two historical downturns was 0.0025 and 0.0017, which were also at extremely low levels in history. It can be seen that the commonality of the market downturn is that the reserve risk is low.
first level title
03
There are more current active addresses, and the capital turnover rate increases
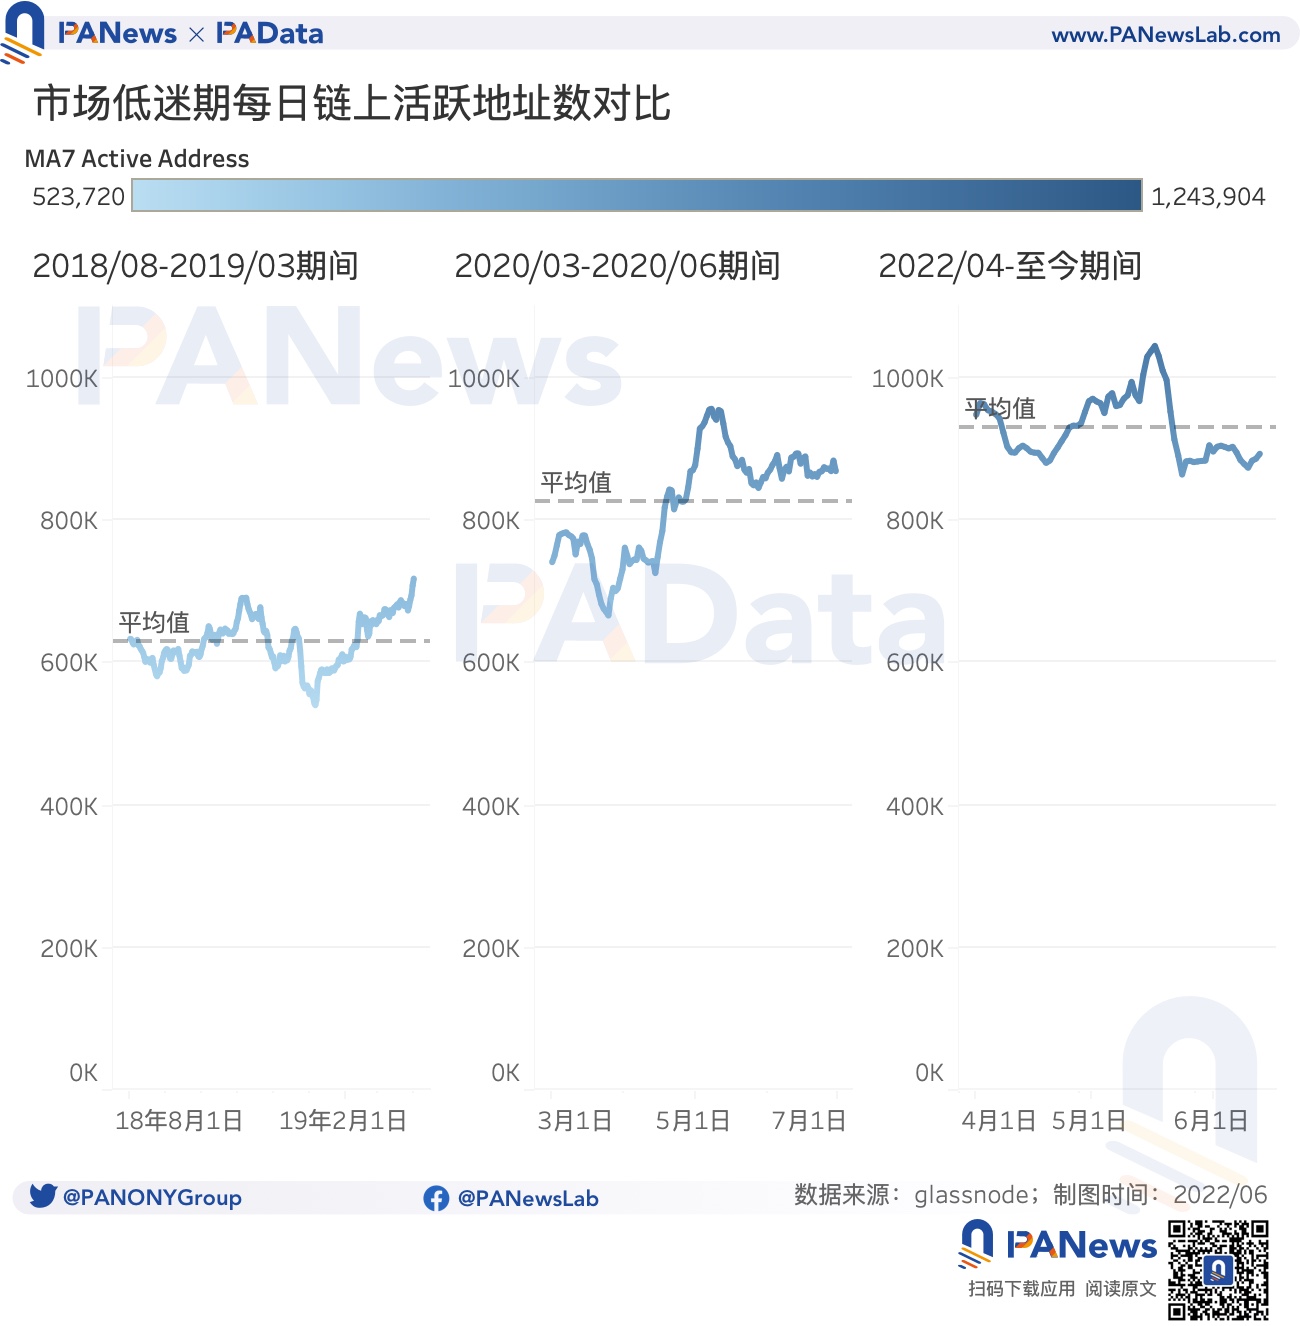
During the market downturn, users and funds also have different active characteristics. First of all, from the perspective of user activity, as of June 13, the number of active addresses on the Bitcoin chain was 893,900, slightly higher than the historical average of 815,400 since 2017. It can be seen that the current users on the chain are relatively active. . And, compared with the previous two downturns in history, user activity during the current period is also higher. The number of active addresses for the periods from August 2018 to March 2019 and March to June 2020 were 628,500 and 825,600, respectively, both lower than the average of 930,400 for the current period.
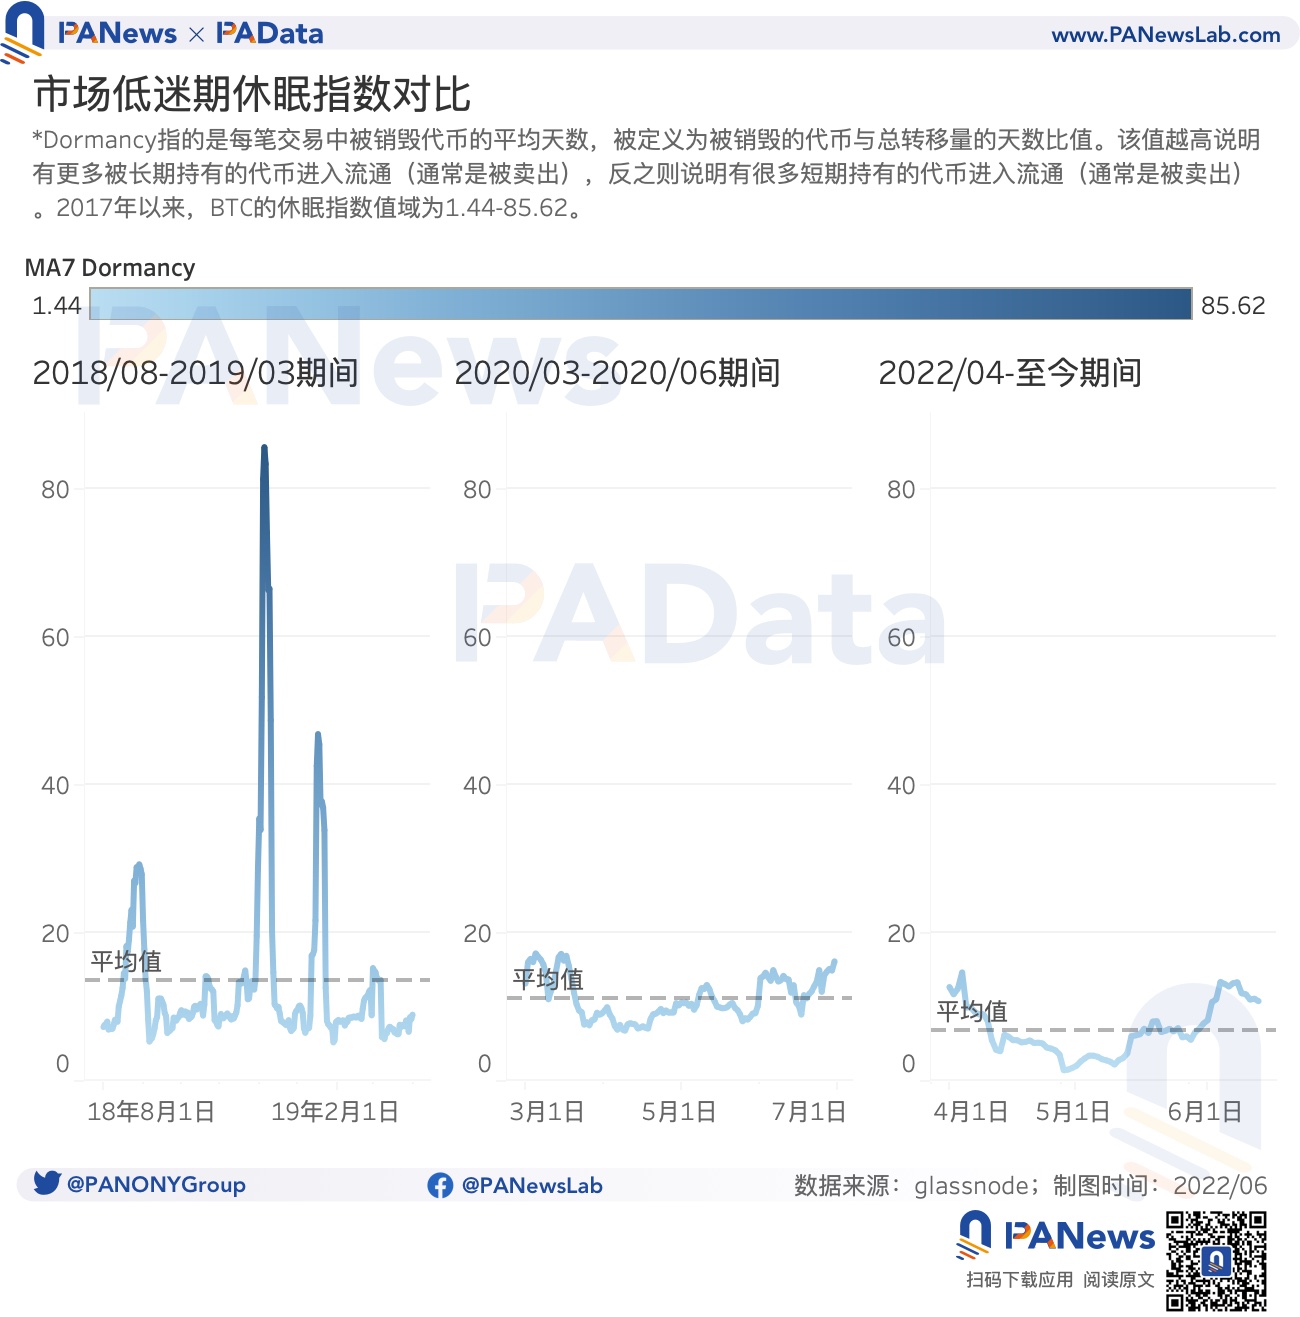
Secondly, from the perspective of capital activity, the dormancy index refers to the average holding days of tokens destroyed in each transaction. ), otherwise it means that more short-term holding tokens enter circulation (usually being sold). According to statistics, the average historical dormancy index of BTC since 2017 is 13.72 days, while the average value in the current period is 6.87 days, which is significantly lower than the historical average. This means that tokens currently being traded change hands more frequently. The average dormancy index for the periods August 2018-March 2019 and March 2020-June 2020 were 13.53 days and 11.19 days, respectively, both closer to the historical average and higher than the average for the current period . This also shows that during the current period, even in the same period of market downturn, the frequency of exchange of its trading tokens is relatively high, in other words, the activity of funds is relatively high.
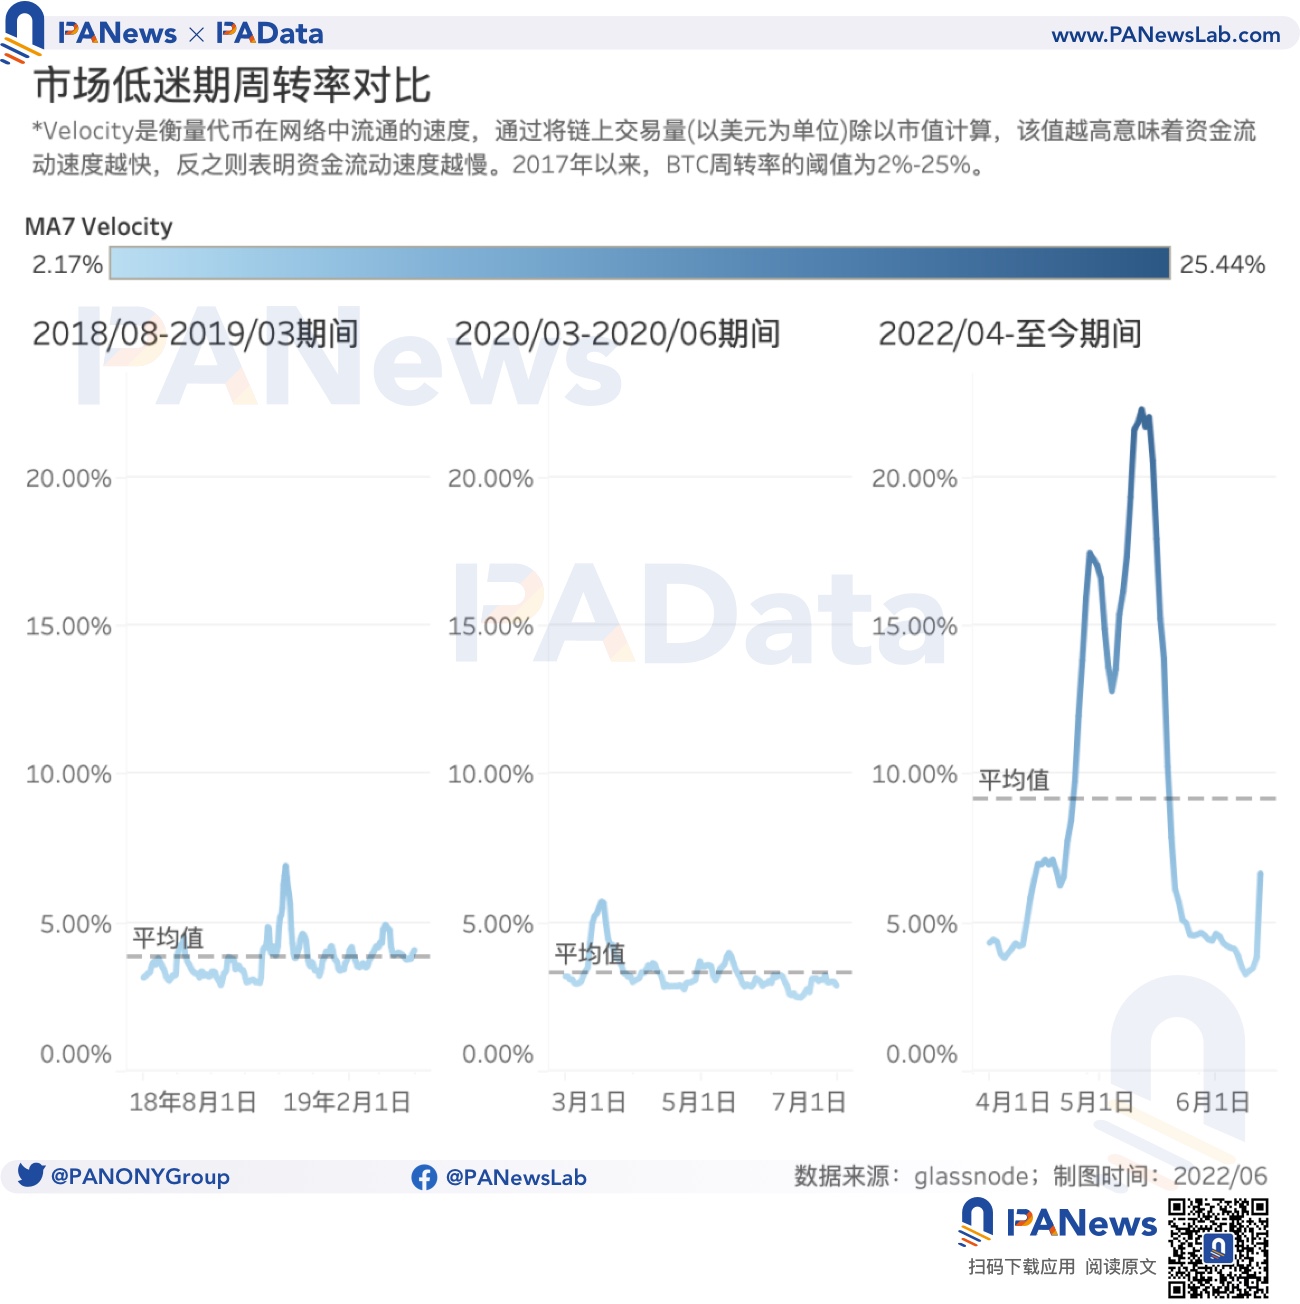
The turnover rate is another indicator to measure the activity of funds. The higher the value, the faster the flow of funds, and vice versa, the slower the flow of funds. According to statistics, the average historical turnover rate of BTC since 2017 is about 5.29%, and the average value in the current period is 9.14%, which is significantly higher than the historical average. The flow rate is also faster. Moreover, like the turnover frequency, the average turnover rate of the current cycle is also significantly higher than the average values of 3.81% and 3.01% for the two periods from August 2018 to March 2019 and March 2020 to June 2020, and also That is, even if it is also a market downturn period, the capital flow in the current period is faster and the capital is more active.
Overall, although individual indices still have a gap compared to the bottom of the previous cycle, for medium and long-term currency holders who intend to hold for about 3 years, now may be a better window period for gradual buying and regular investment.


