
Six Strategies for Making Money with Nansen Data
This article comes from Nansen, compiled by Odaily translator Katie Koo.

, compiled by Odaily translator Katie Koo.
With more and more use cases emerging in verticals such as DeFi, NFT, and GameFi, crypto projects have become more complex. How do individual investors choose potential projects and finally form investment decisions? Nansen has many key indicators suitable for "understanding" projects. This article summarizes the query methods of these high-value information and the recommended order of investigation items.
secondary title
How to make good use of "smart money" (Smart Money) indicators?Being held by "smart money" is one of the possible positive indicators for a project/protocol.
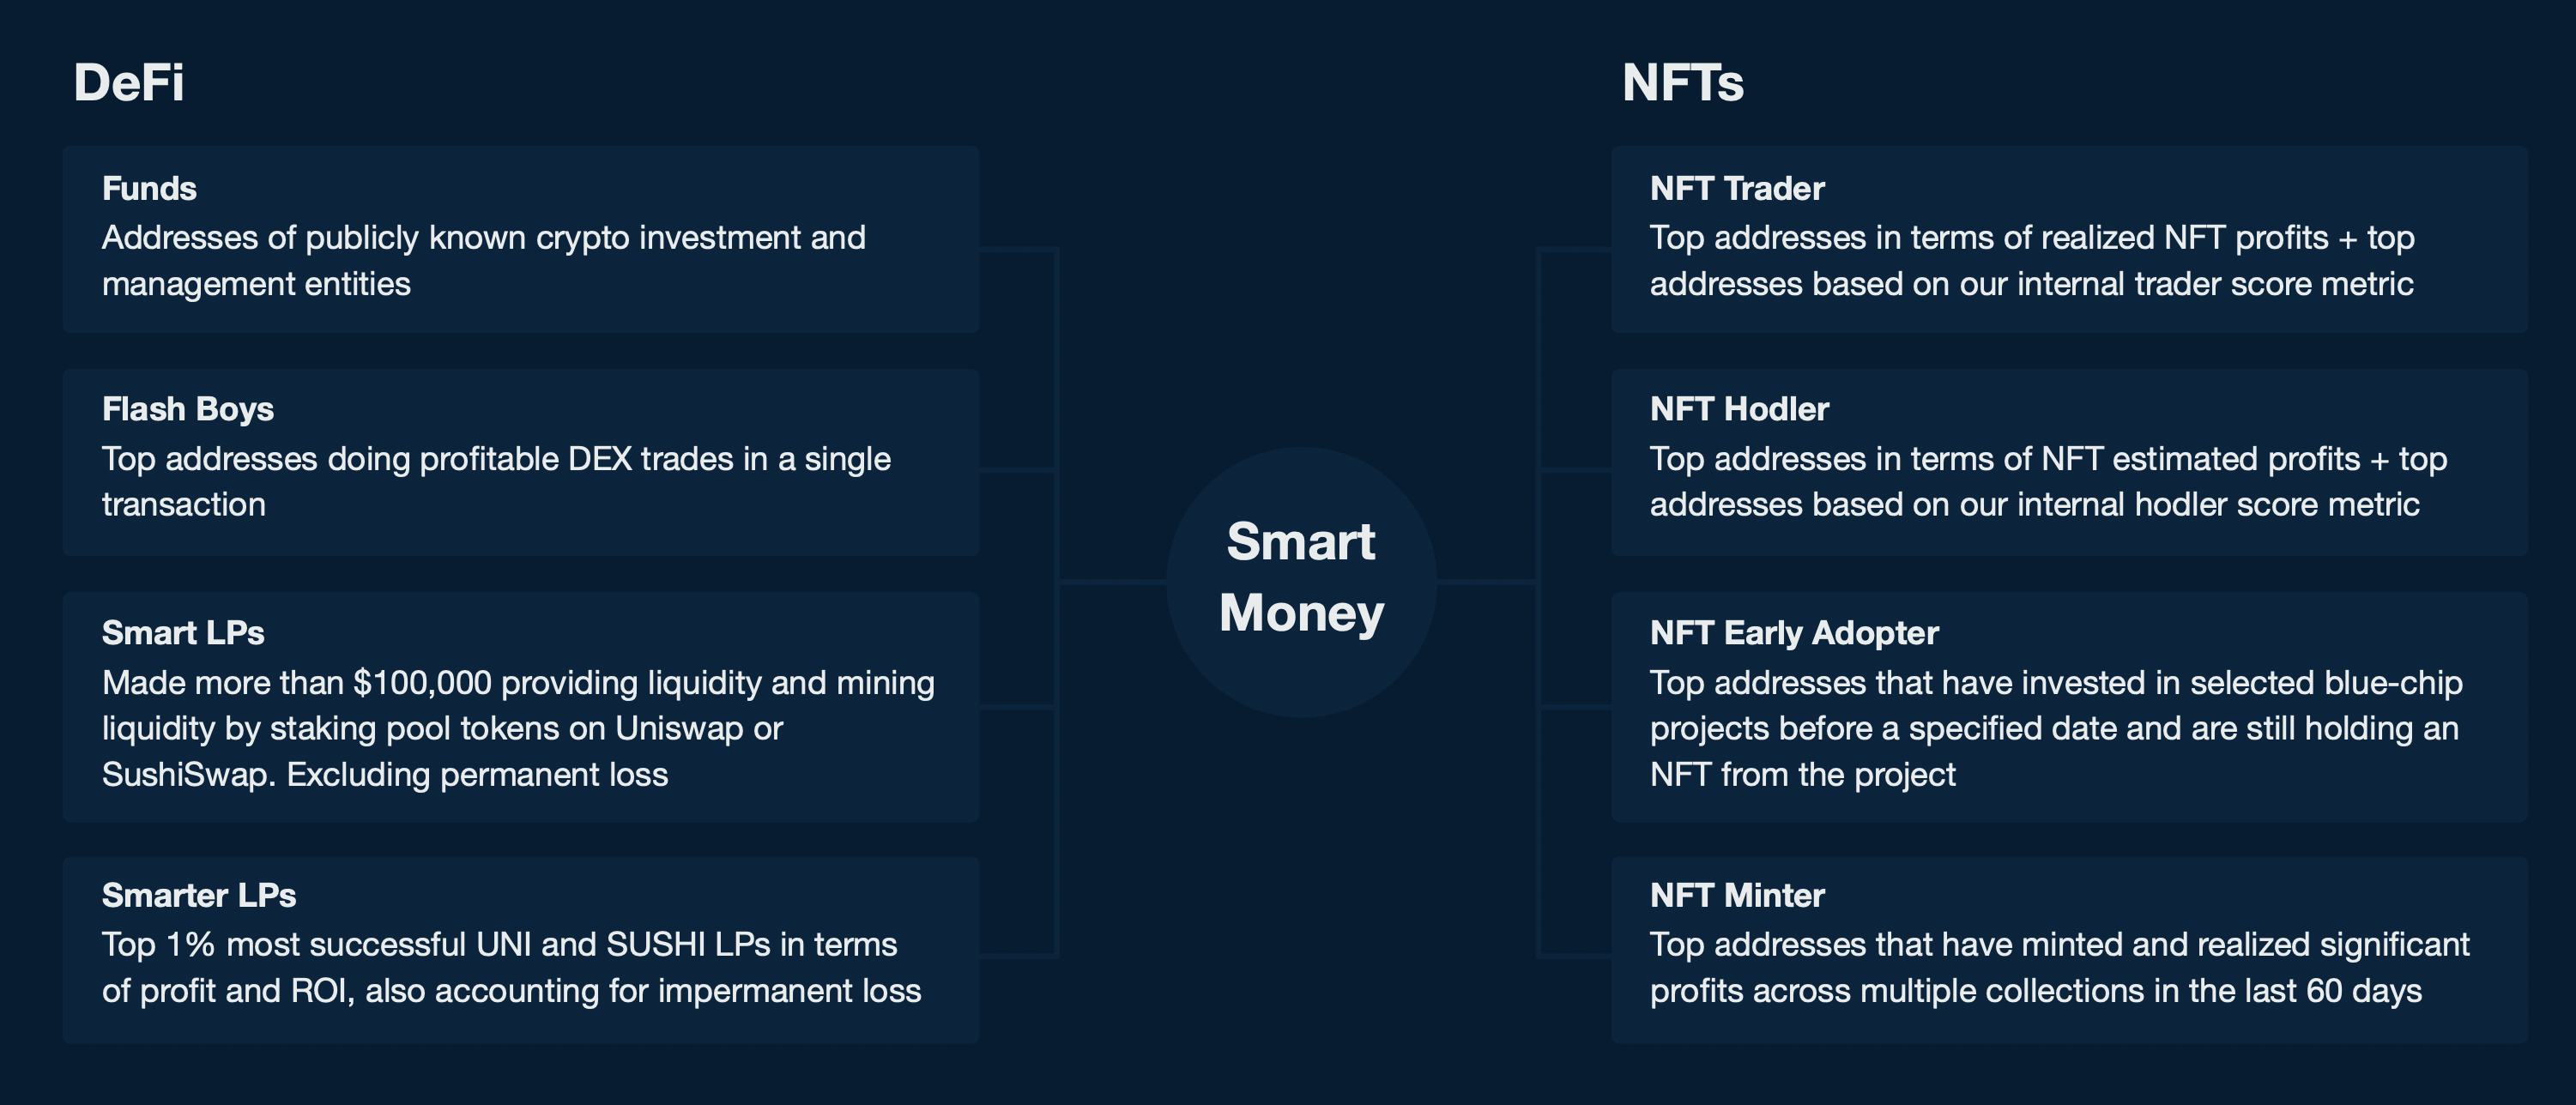
Nansen allows users to set highly customized smart alerts so they are notified in real time when new transactions and investments are made by these wallets.
image description
Here are a few examples of “smart money” campaigns that might translate into good alpha.
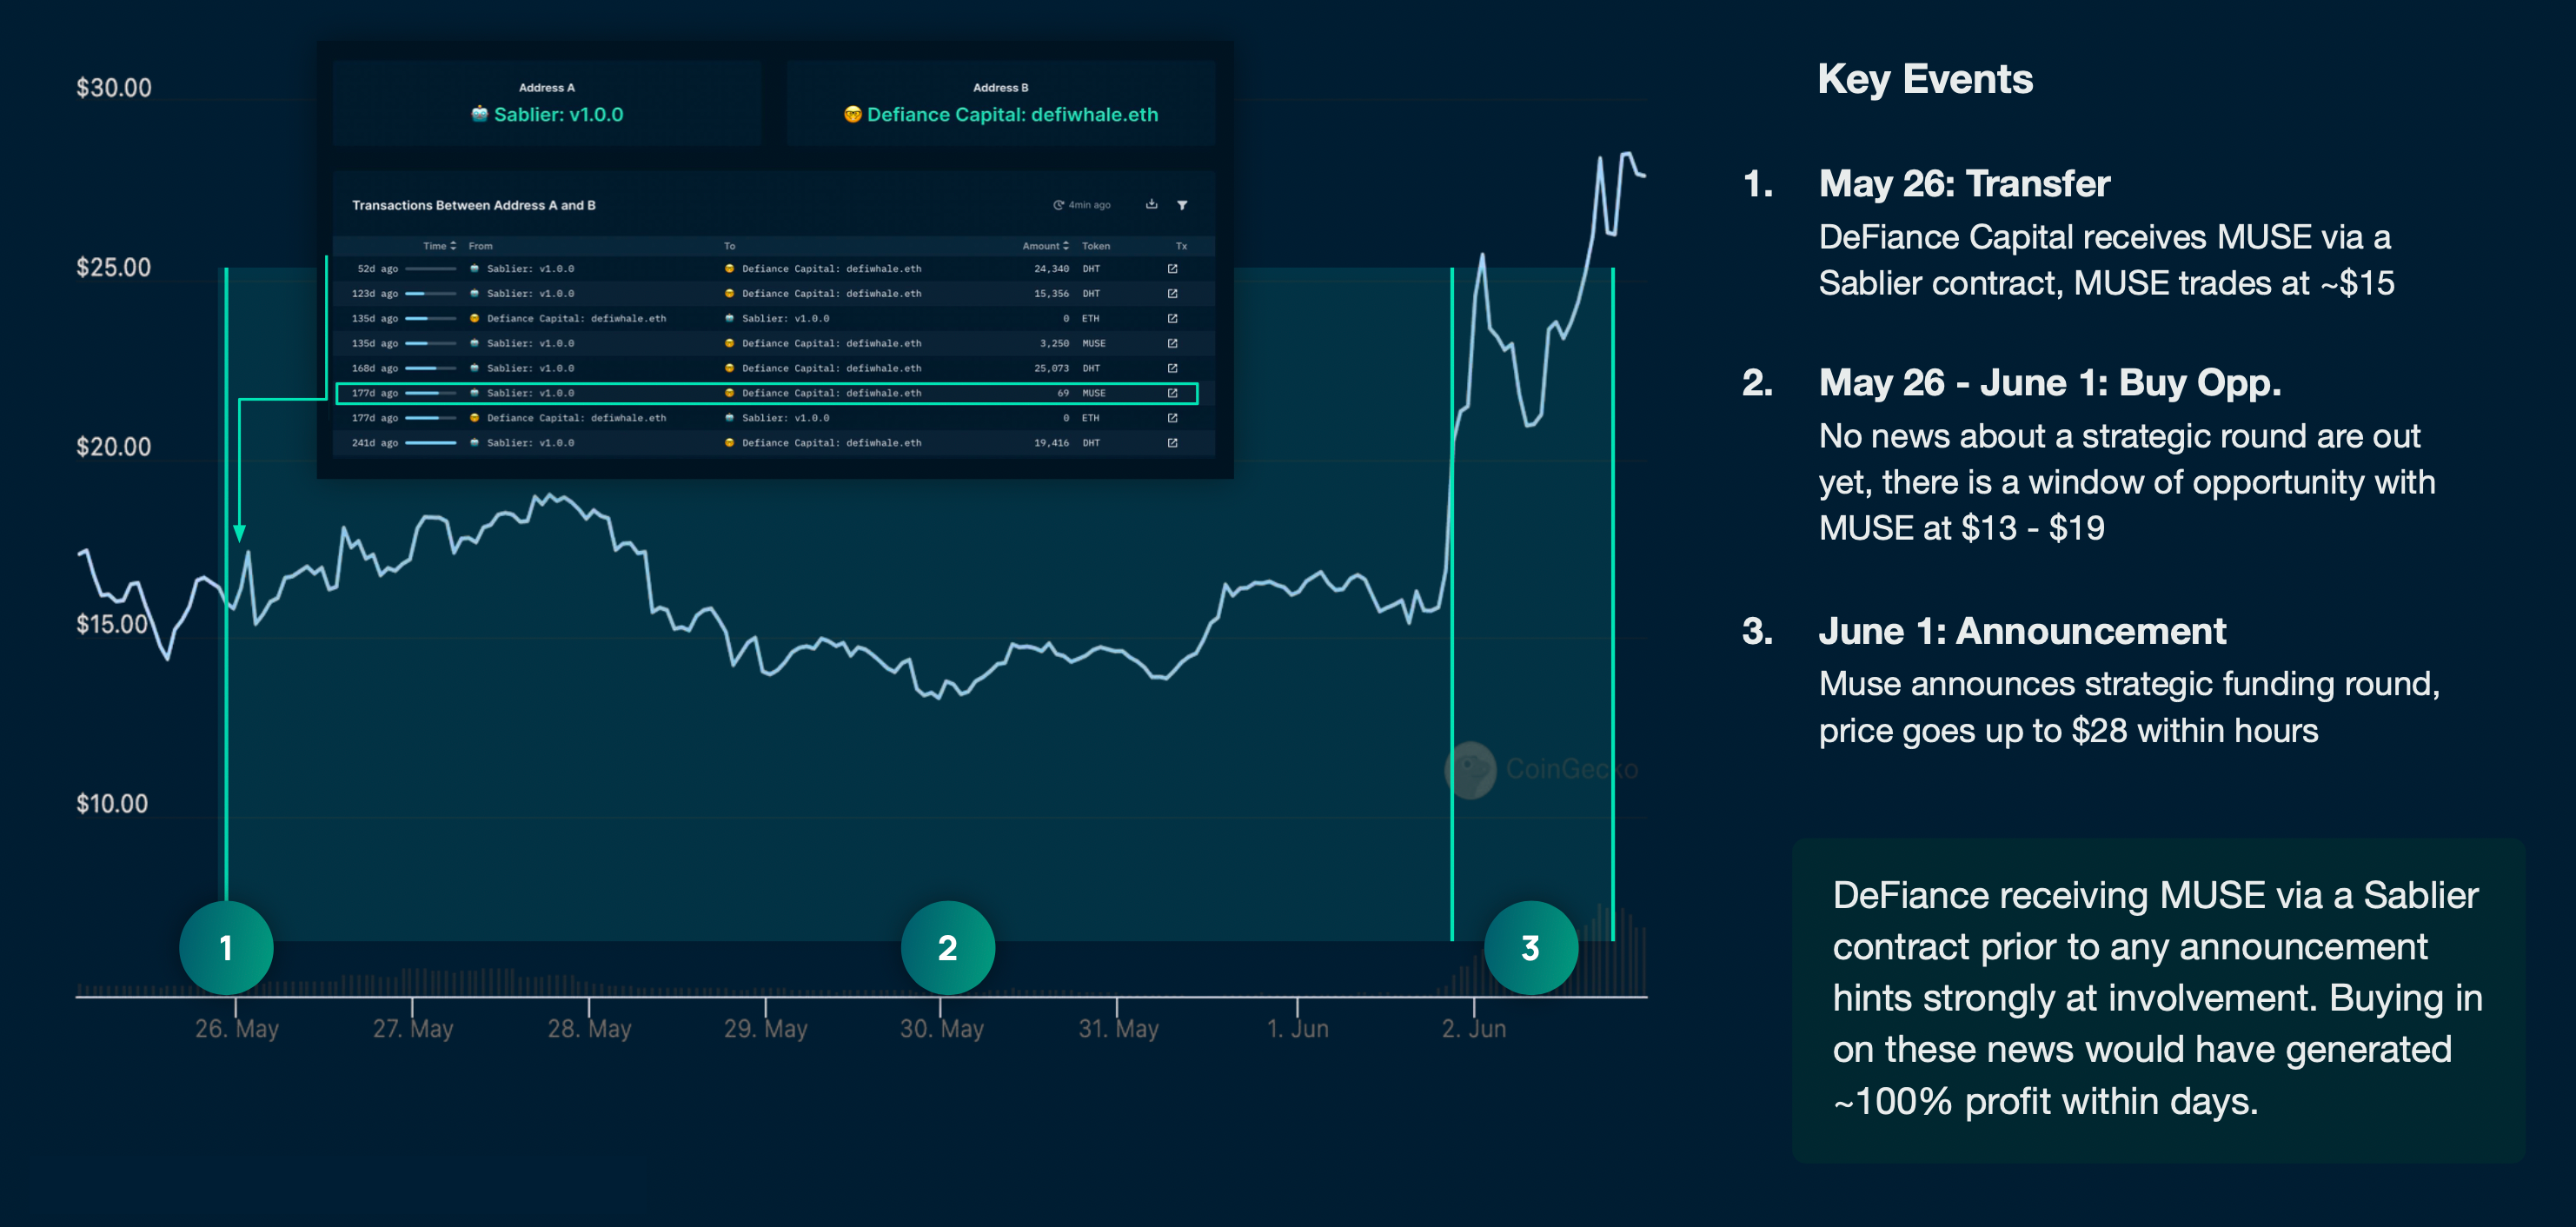
Example 1: The encryption investment company Defiance received the token MUSE before the official financing announcement. When the financing official announced, the price of MUSE doubled.
Source: Nansen 2021 Industry Report
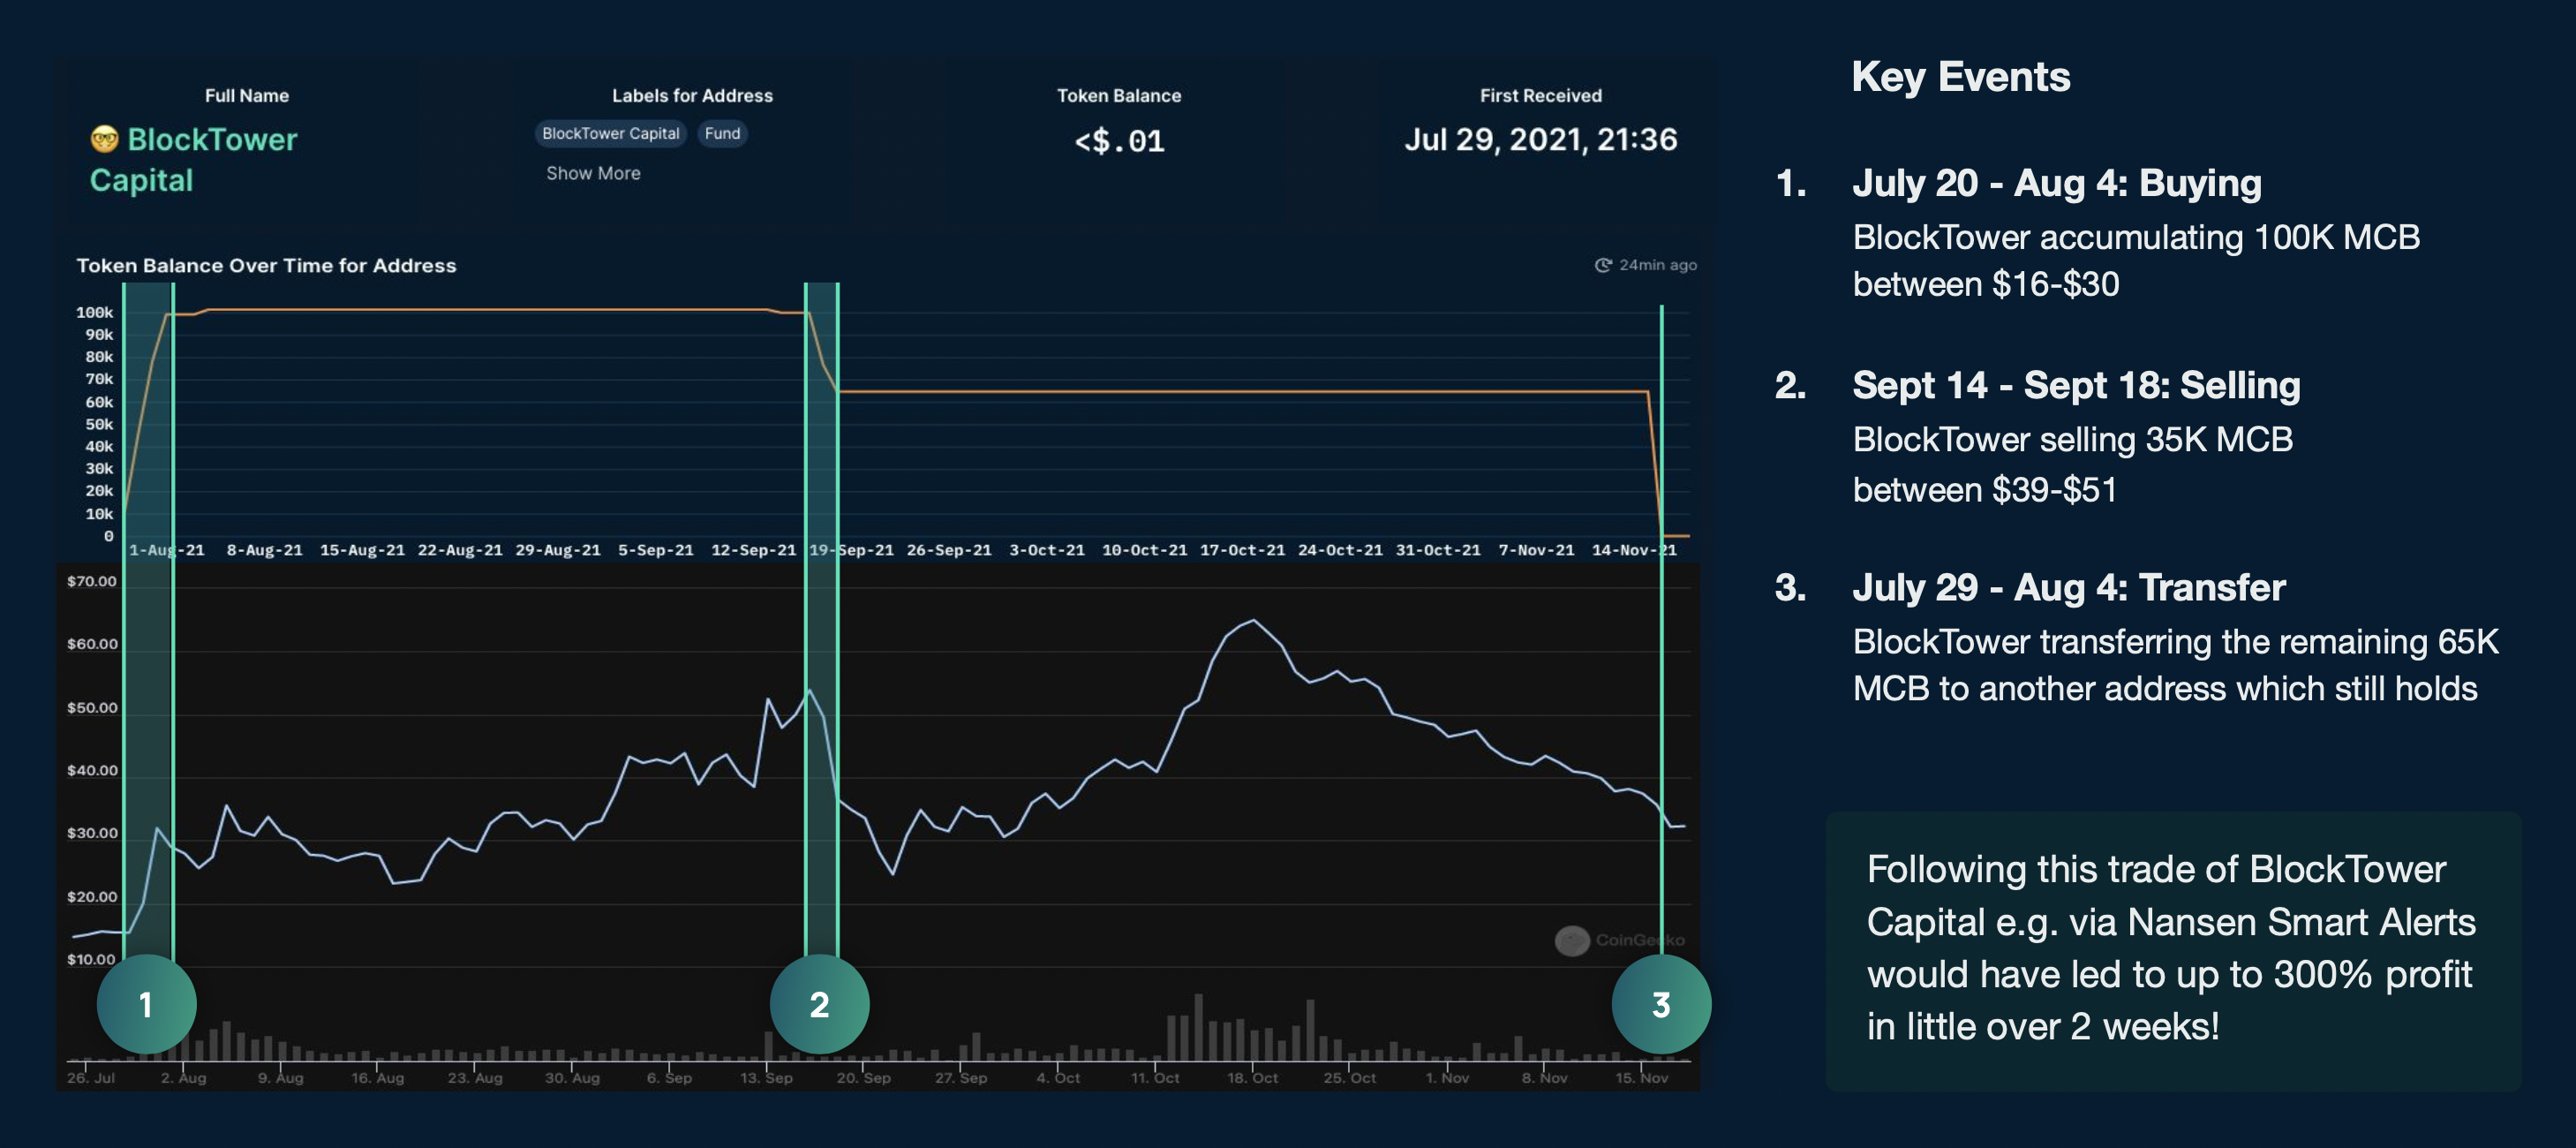
Example 2: Cryptocurrency hedge fund BlockTower’s capital surged on the decentralized perpetual contract trading platform MCDEX (MCB), and some sold at the top price. If you pay close attention, this is a good opportunity to make a quick profit.
image description
Example 3: Some smart alerts about capital flows and "smart money" inflows.
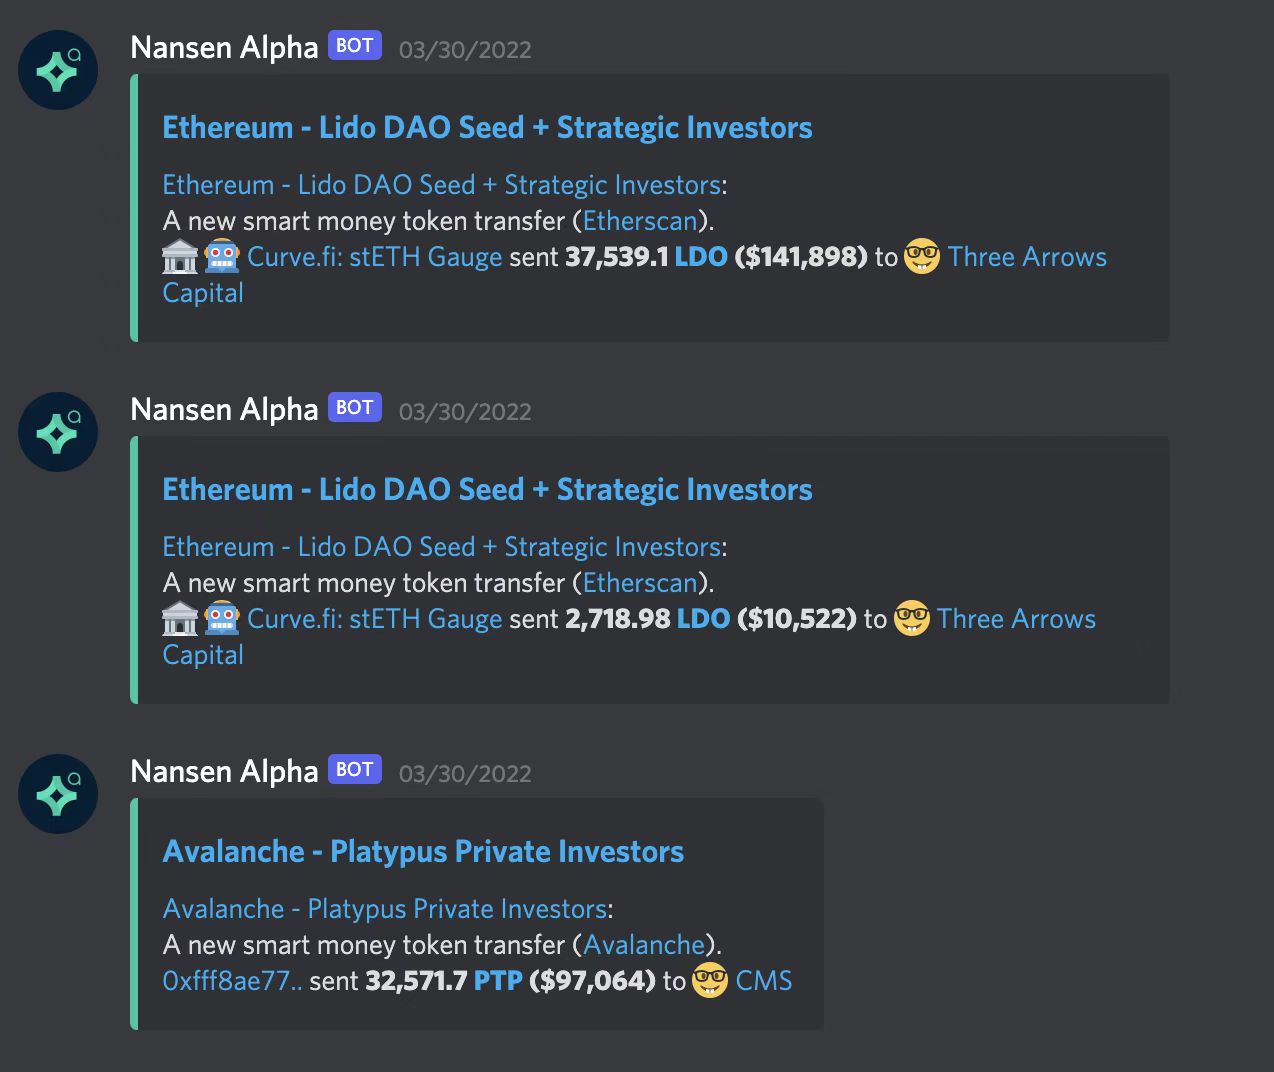
image description
secondary title
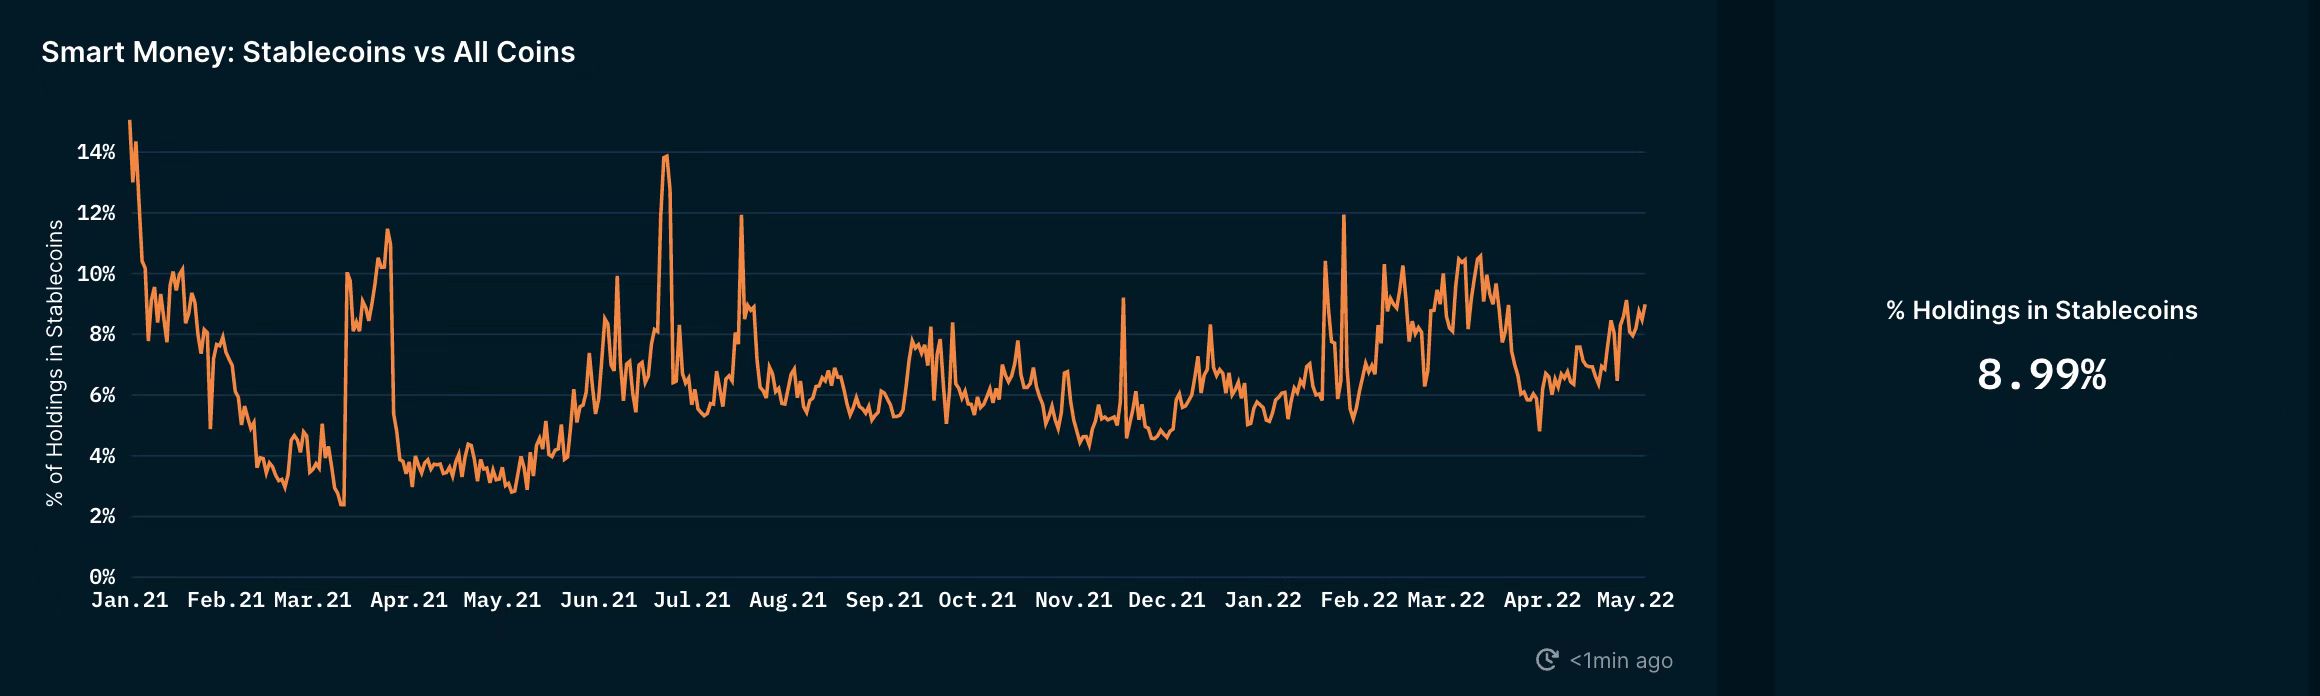
"Smart Money" Stablecoin Holdings Roughly Equal Market Sentiment
image description
Source: Nansen.aiNansen’s data dashboard shows “smart money” stablecoins as a percentage of their total on-chain cryptocurrency holdings. This is often used as a "sentiment check" on the current market. In general, a higher percentage of stablecoin holdings may indicate stronger risk aversion.example
For example, during a pullback, stablecoin holdings decline, which could indicate bullish sentiment, as “smart money” is buying low in anticipation of an uptrend to follow.
Look for opportunities in changes in "smart money" positions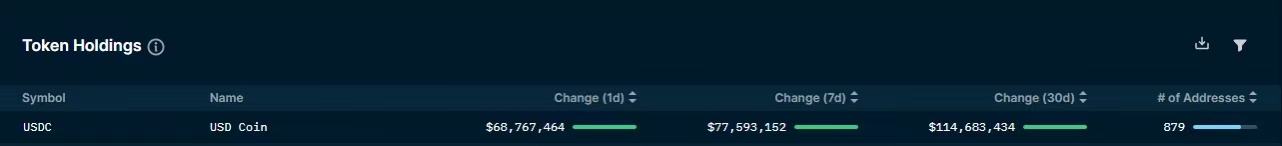
This data dashboard shows the 30-, 7-, and 1-day changes in the "smart money" holding a certain currency, and the number of addresses involved. This is often used to identify investable opportunities, but also serves as a sentiment check on projects and the market as a whole.
Source: https://pro.nansen.ai/smart-money/holdings

As shown above, within 30 days, 7 days and 1 day, USDC was accumulated in large quantities. This shows that the market is in a phase of emotional tension.
Source: https://pro.nansen.ai/smart-money/holdings
In this graph, the most tokens accumulated by “smart money” across 67 addresses over the past 30 days, 7 days, and 1 day are SHIB. Meanwhile, SHIB surged from $0.000009 to an all-time high of around $0.000088.
secondary title
Is HODL right for you?
HODL is a passive way of investing, not an active way of trading. This is ideal for those who don't have the time to track highly volatile markets, but would like to participate in them.
One metric people can look at is the token seniority distribution data dashboard on Nansen. The token-level distribution dashboard shows the number of tokens and the number of addresses as a percentage of tokens held over different time periods.In general, a higher number of tokens held long-term indicates a positive perception and belief in the value of the token, as people see its long-term potential. If the proportion of addresses holding the token for a longer period of time is also high, it indicates that more people agree with the long-term potential of the token. Of course, there are many factors that can explain why people are more likely to hold coins for a long time, which may be related to specific vesting schedules, holding rewards, other utilities, etc.More addresses holding tokens is usually a good sign that the wider market has confidence in the long-term viability of the project.
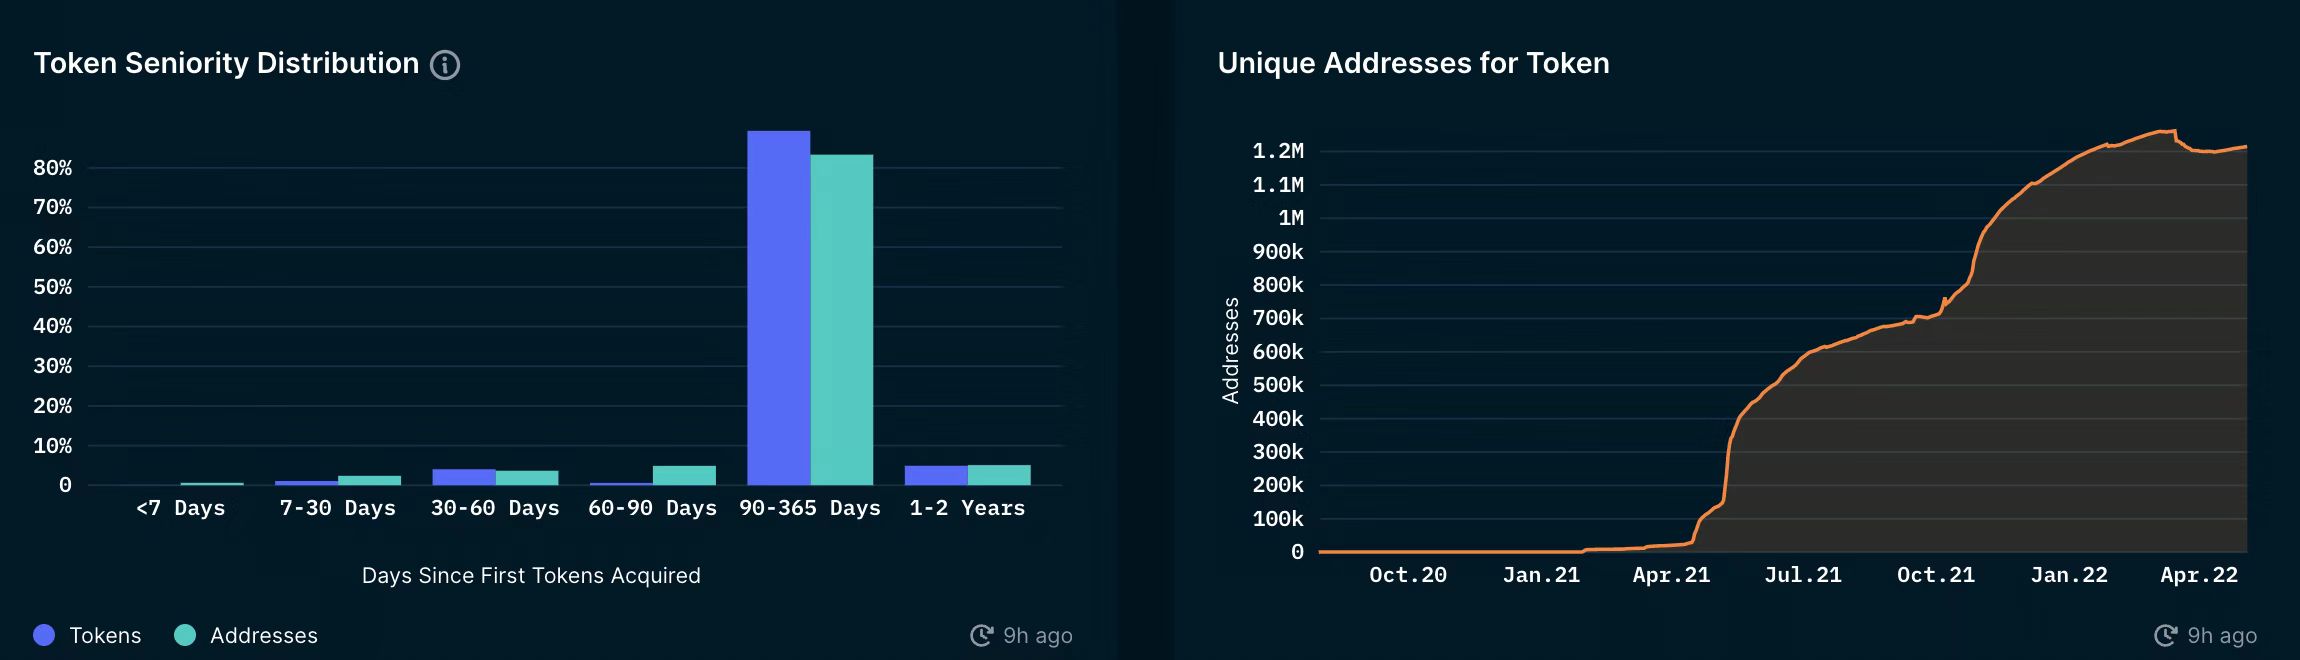
In addition, this also indicates that the concentration of holdings is low, which can be further confirmed by the highest balance of the Nansen platform, as shown in the figure below.
secondary title
Market value (MCAP) is the most basic indicator of the project
Market capitalization is basically an estimate of the total value of an asset based on its current market price. In our opinion, market capitalization is one of the easiest and most useful metrics for evaluating a project.
Market Cap = Current Price × Circulating SupplyGenerally, the market value of US$1 billion and US$10 billion are the two assessment thresholds for medium-sized and large-scale projects.
Compare the project's market capitalization (MCAP) with its competitors to get a rough estimate of the project's growth potential.
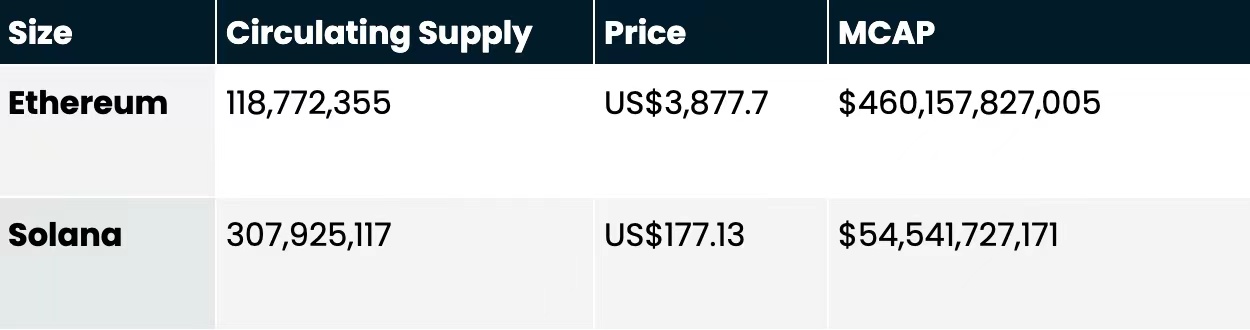
For example, Solana is the L1 network, often referred to as the "Ethereum Killer". Due to their similarities, it is appropriate to compare the market capitalization of Solana and Ethereum.
image description
Source: CoinMarketCap data as of December 17, 2021
If we assume that Solana will eventually reach the market cap of Ethereum, then we can calculate the future value of Solana.
SOL estimated ceiling = $1,494.38
Potential Upside = 743.66%
Fully Diluted Valuation (FDV) = Current Price x Total Supply
But FDV may not be the most reliable measure because it assumes that the additional supply of a token will not affect its price in the market, nor does it take into account the future development of the project and the space it is in.
secondary title
What indicators are used to evaluate DeFi projects?
When evaluating different DeFi projects, I think of many indicators for comparing valuations, including total locked value (TVL), transaction volume, and loan volume. The key is to understand the key drivers that make their protocol successful.
For DEX, the important indicator is trading volume. Because transaction volume is often directly related to revenue. To be more accurate, we can use their transaction volume, revenue or expense data for the past 3/6 months.
For lending protocols like AAVE or COMP, in addition to TVL, lending volume is a key metric to consider when making comparisons.
secondary title
Token Value Appreciation Mechanism
Out of thousands of tokens, only a small fraction have some form of utility.
The purpose of value-accumulating tokens is to reward token holders in some way (in the form of earning yield, participating in the governance of the protocol, etc.) that aligns the interests of token holders with the interests of the network.
1. Airdrop
Airdrops refer to blockchain projects sending their own native tokens to specific communities to encourage new users to interact with the new protocol. Airdrops are similar to new games offering free credits to new users in hopes of boosting player numbers.
Stake 1000 ATOM = airdrop 1988 OSMO
Staking $27,860 worth of ATOMs equates to $18,448 in rewards at February 26, 2022 prices. These airdrops are very attractive to everyone, regardless of the high yield initially invested in OSMO.
text
2. Liquidity mining/staking opportunities
On the other hand, the topic of vampire attack (vampire attack) is also emerging, and the new agreement provides additional rewards to incentivize existing liquidity providers on another platform to invest in LP tokens on the new platform.
3. Governance
text
3. Governance
Having a say in the future of the protocol is considered valuable. This concept is similar to the voting rights of ordinary shareholders. Beyond this impact, many governance tokens offer token holders various benefits such as:
(1) A fee-sharing mechanism between the protocol and token holders. Governance token holders can vote to distribute X% of the total fees generated by the protocol to token holders.
(2) Future token distribution. Token holders can earn additional tokens through staking/liquidity mining.
(3) Voting rights. The core concept of governance tokens. Essentially switching the "ownership" of the agreement.(4) Retroactive Token Airdrop. Reward early protocol adopters with tokens.
It is also important to check governance token distribution. In general, widely distributed tokens have a better structure for governance participation, as voting is not influenced by "whale" wallets that hold a large number of tokens.
Nansen's Token God Mode allows investors to easily assess token distribution.
One of the most common value accretion mechanisms is to repurchase the protocol's native token using revenue generated from fees in the protocol.
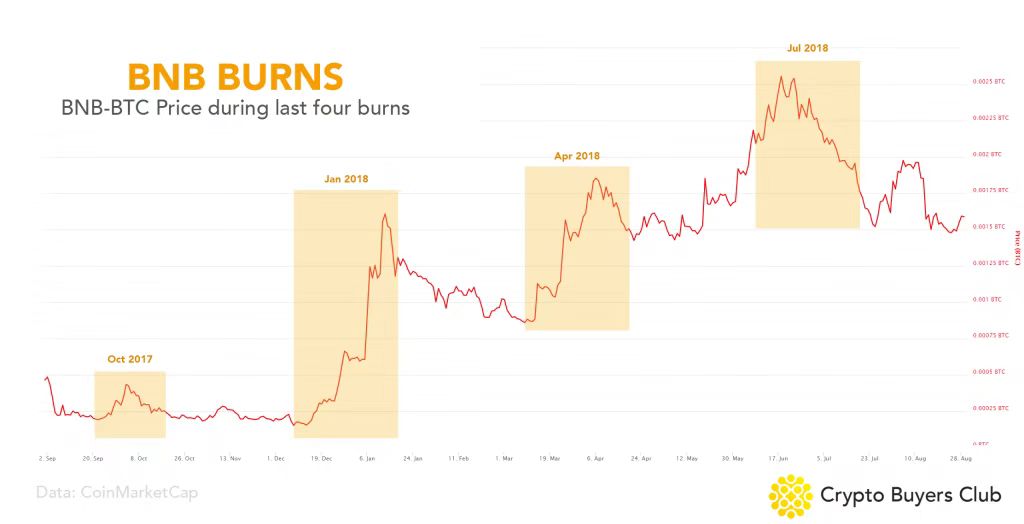
Tokens purchased by the protocol can be permanently burned, which reduces the total supply of tokens, or redistributed to participants. The act of distributing tokens to stakers will then create an additional incentive for token holders by putting buying pressure on tokens and ensuring a permanent incentive for good actors.
Source: Crypto Buyers Club
From the chart above, we notice that during every BNB burn, the price has a strong rally. However, it's also important to note that price rallies are also not guaranteed to occur with every burn seen here. In fact, burning does not create any real value, it only leads to scarcity of tokens.
text
5. Token Supply Release Rate
Many new tokens have a huge amount of room to unwind, creating strong inflationary pressures. Due to this design, the price action is unlikely to continue to be strong, as the only way to maintain the price of the token is to create continuous additional demand for it.
This idea was recently applied to the SLP token rewards for Axie Infinity players.
In order to improve the long-term sustainability of game rewards and support the SLP price, the developers decided to reduce the SLP emissions of game features (such as "dailies") to zero from the previous 130 million SLP. This significantly reduces the daily SLP token supply by 56%. As a result of this change, the price of SLP skyrocketed by more than 100%.
6. VeToken economic model
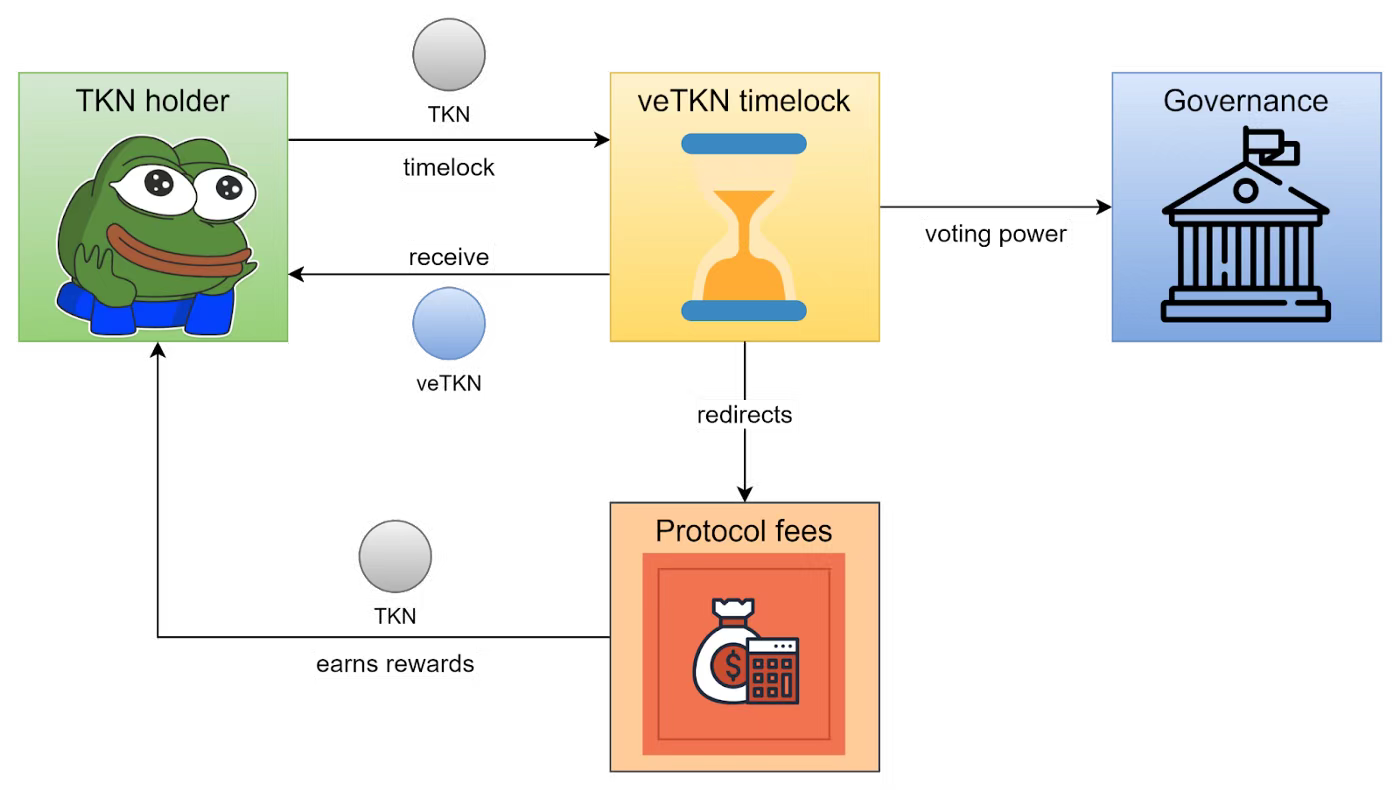
Curve has had great success with its Voting Escrow (Ve) model, which subtly encourages token holders to lock up their tokens for a preset amount of time. More and more protocols adopt similar mechanisms, such as Terra's Anchor protocol.
image description
This Ve model has become very popular, so there have been liquidity disputes in the DeFi field, such as Curve War.
Summarize
secondary title
Summarize


