
Messari: Are Bitcoin and Ethereum risky assets in the current market?
Compilation of the original text: The Way of DeFi
Original source: Messari
Compilation of the original text: The Way of DeFi
After a period of skepticism, cryptocurrencies have steadily entered the global financial leagues. Bitcoin, Ethereum, and other major cryptocurrencies have experienced considerable market volatility, with financial professionals pegging them directly to major asset classes and indices. While crypto industry players have embraced the asset class as mainstream since the release of the Bitcoin white paper in 2008, it took the financial community a while to change. We now see Bitcoin and Ethereum showing up on daily price charts alongside every other major asset, and even being one of the few items mentioned during major market swings.
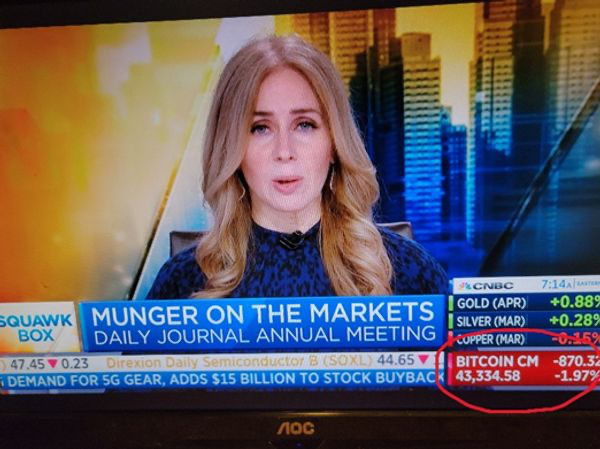
(This didn't exist a few years ago.)
Of course, there are good reasons to discuss these assets on a daily basis, and not just because of their price movements. We all know that cryptocurrencies provide open, fair and decentralized access to a new world of financial opportunity and innovation for millions of people. Not to mention its breakthrough use cases in decentralized finance, web3, and more.
However, rising prices have attracted those otherwise uninterested in the spirit of the industry or the use cases for the new technology. In terms of pure returns, BTC and ETH are generational investment opportunities since their launch, with an average return of over 80,000%. Even stripping out the huge volatility, these assets are some of the best performing investments in history. Using the Sortino ratio, investors can view positive volatility as a benefit to their investment (unlike the Sharpe Ratio, where either positive or negative volatility implies a negative impact on the asset), BTC and ETH measurements The values were all above 2.0 and even exceeded 3.0 for a while. These are very good numbers for any asset and should be included in any portfolio. Of course, the size of the asset allocation is debatable based on how much volatility an investor can tolerate, but at this level of returns it would be unwise not to engage in some asset allocation.
Because of cryptocurrencies' impressive profile and growing track record, many in the financial world have come to view them as an entirely new asset class alongside stocks and bonds. This view is often devoid of any nuance, with allocators referring to the cryptocurrency as a whole. Because most traditional investors don't even understand the basic differences between Bitcoin and Ethereum. The appropriate nuances of this view will likely emerge over time, but at this juncture it makes little difference even to most institutional allocators.
Investors in traditional finance like to categorize investments on risk and return spectrums. This helps them make portfolio decisions when deciding how to allocate their assets. Starting from the framework of a 60/40 portfolio (60% stocks, 40% bonds), if investors want higher or lower expected returns, they can decide to add or subtract risky assets from this baseline, subject to Understand that higher returns come with greater expected volatility. The chart below is an example of how the traditional risk-reward range would be presented if an investor were talking to an advisor today.
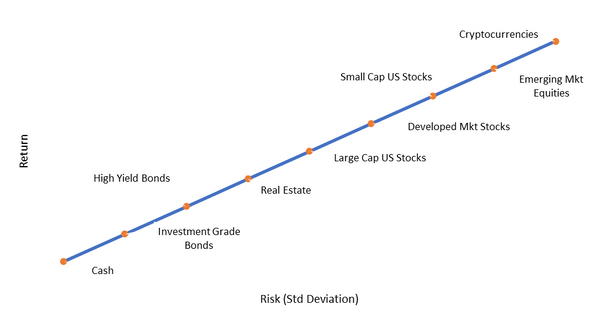
Due to their historical volatility, BTC, ETH, and other popular cryptocurrencies are firmly placed high on the risk spectrum. Most advisors consider them so risky they don't even add them to the map at all. This type of asset allocation will assume that the asset has cash flows in the far, far future (if ever) and is more volatile than any other asset class. In this regard, most traditional financial advisors still view cryptocurrencies as zero-cash-flow assets purely for speculation.
“On the one hand, we have everything I would call a bubble asset: technology, innovation, disruption, and cryptocurrencies. On the other side of this seesaw, you own everything else in the world.” — RichardBernstein, former chief investment strategist at Merrill Lynch。
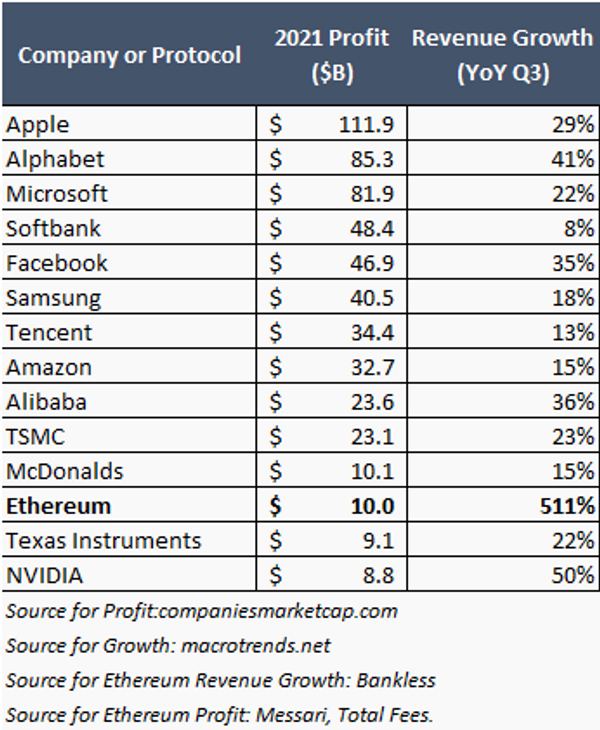
In terms of cash flow, we know that's not the case for most of the investable crypto market. The Ethereum network alone has captured over $10 billion in cash flow in 2021, making it comparable in size to large multinational corporations. This excludes the growth rate of tech start-ups. Revenue growth of more than 500% year-over-year in the third quarter of 2021. Not shown in the chart below, but Q4 2021 saw over 1,000% year-over-year growth in revenue from $230 million to $4.3 billion.
secondary title
About relevance
Investors also consider correlations between assets in their portfolios. They want to group negatively correlated assets together so that one part of the portfolio is up and the other part is down. This provides investors with a smoother overall return profile. In this context, it is currently assumed that cryptocurrencies are again highly correlated with the riskiest asset classes. In the view of the allocator, this would minimize the additional diversification benefits of holding these assets. While bitcoin and ethereum do have volatility, they don't actually track the riskiest parts of the market as closely as most people think.
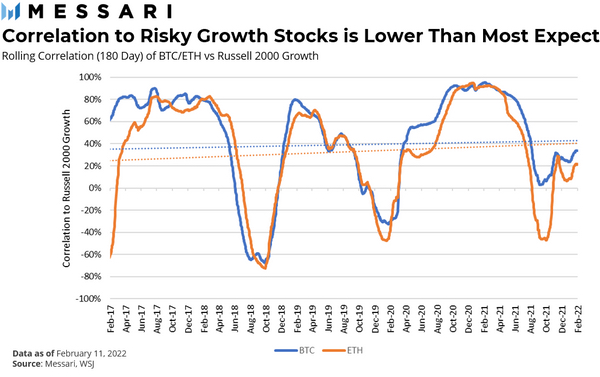
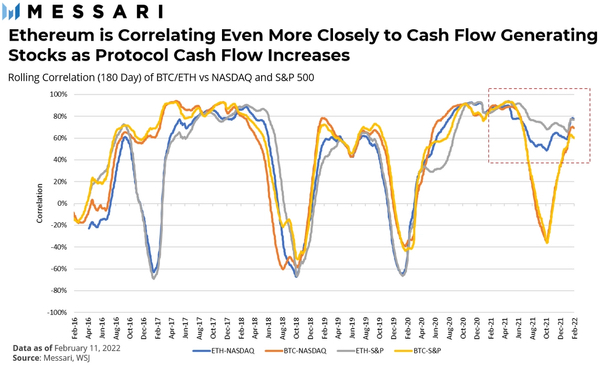
Using the Russell 2000 Growth Index as a proxy for small-cap stocks with little or no profitability (⅓ of the index typically has negative earnings in any given period), BTC has averaged about a 35% correlation over the past four years, ETH has an average correlation of about 30% over the same period. The correlation has also been deeply negative on several occasions, mostly during periods of strong equity markets. During risk-off events, a strong positive correlation can be seen. Notably, Ethereum has been showing a lower correlation with low/no-revenue tech stocks recently. This is an interesting development in the market as a whole, likely because the cash flow generated by the Ethereum protocol is increasing and becoming more stable.
This relationship holds if we compare BTC and ETH to the major market indices of the S&P 500 and Nasdaq (which is dominated by tech stocks). ETH has been acting more like a stock lately than BTC, with a higher correlation to these two major indices than BTC. Overall, BTC has an average correlation of around 40% with the two indices, while ETH has an average correlation of 45%.
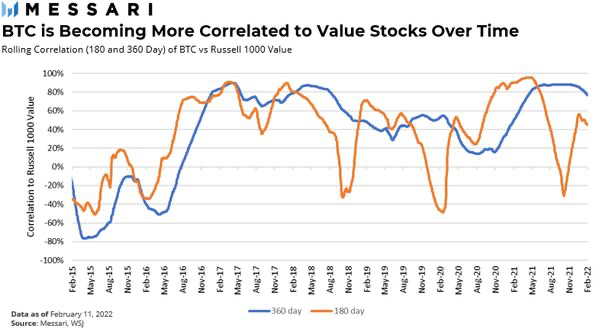
The top four in both the S&P 500 and Nasdaq are effectively the same: Apple, Microsoft, Amazon and Alphabet. So while ETH is acting like a cash flow tech stock, BTC is actually closer to a larger cap value stock. Below is the correlation of BTC with the Russell 1000 Value Index. It has an average positive correlation of more than 60% over most tracking periods. The top performers in the Russell 1000 Value Index are Berkshire Hathaway, J&J, JPMorgan, United Healthcare, Procter & Gamble (P&G), Bank of America, and Exxon.
While BTC and ETH have a more volatile relationship, interestingly, they have a similar correlation with high-yield bonds. The correlation between BTC and ETH and the US high yield bond index is about 25%. Over multiple periods, the correlation reached 80%. During risk-off periods, the 30-day correlation with high-yield bonds is almost 100%.
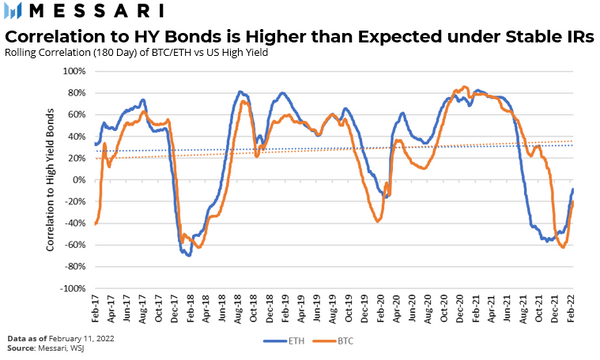
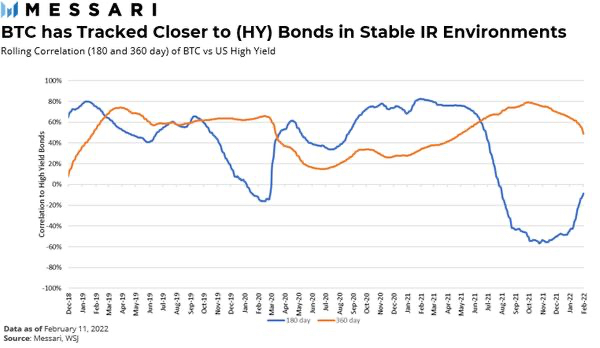
The periods of extreme negative correlations (late 2017 to late 2018 and 2021) occurred in an environment of rising returns, which could explain the deviation from the positive relationship otherwise seen. Bitcoin appears to be moving more in line with high-yield bonds. For a period in early 2019, Bitcoin’s correlation was above 60%. Intuitively, this makes sense, the asset is moving along the risk spectrum towards more stable asset formations while still maintaining a risk bias. For this lower risk profile, investors can expect lower returns than equity-like assets, and ETH seems to be becoming that.
secondary title
interest rate change
Since our sample size is short, we only have a few periods of cuts and gains to look at. To strengthen the analysis, we include periods of large swings in 10-year yields (such as early 2022).
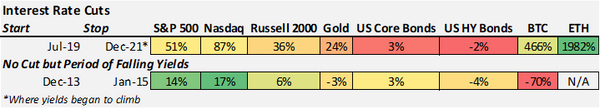
It's no surprise that most risky assets do well during periods of falling yields. BTC rose sharply after the first major halving, with a peak around December 2013. Compared with the decline after the halving, the sharp decline of 70% is less likely to be related to the interest rate environment at that time.
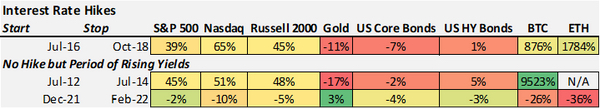
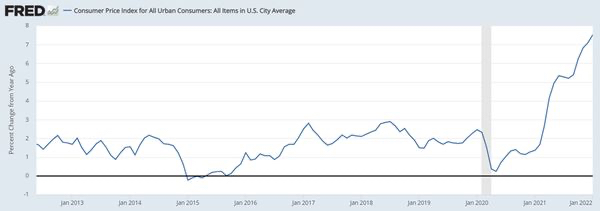
Both BTC and ETH have continued to perform well, outperforming other risk assets, during the only rate hike cycle of the past 10 years. The two assets have had mixed results during two important periods of rising interest rates. Between 2012 and 2014, real yields (treasuries' yields pegged to inflation) remained range bound. Treasury yields as a risk-free return, when inflation is factored in, result in the true minimum rate of return on any investment. When interest rates are low or negative, the bar is not high, making people less motivated to park cash in banks or short-term securities. Risky assets are very sensitive to real interest rates. Real yields have been negative for quite some time. As inflation rises during 2021-2022, real yields soar and BTC and ETH sell off.
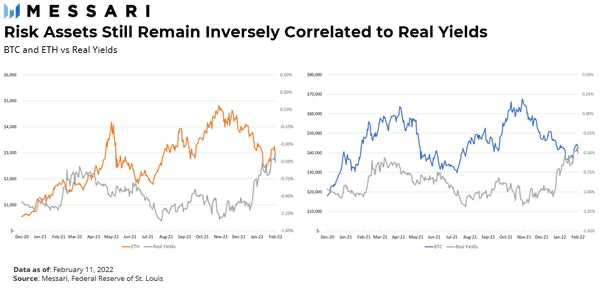
image description
change the inflation regime
source:
source:federal reserve bank of st louis
During this brief period of inflation, cryptocurrencies have had a mixed performance. ETH has decoupled from BTC, but also from all other major asset classes.

Much of this can be attributed to strong network demand throughout 2021, with renewed interest in DeFi and the emergence of NFTs. Leading DeFi exchange Uniswap spent the most fees on Ethereum until it was overtaken by NFT exchange Opesea in September 2021. Opensea now routinely receives double the amount of fees per day than Uniswap (the second largest fee spender).
Do we have reason to think that the current inflationary environment will persist? The cause of this inflation still appears to be due to conditions that will pass or (cue the Fed's joke) transitional. Supply chains are a pressing issue, but imports at the largest U.S. port show backlogs that are nearly 50% less crowded than peak times. Wage pressure is the main driver of future inflation, and it can be delivered through government checks or higher wages. Throughout 2021, we've experienced both.
During the 1970s, consumer costs increased, and thus labor demand, and a continuous feedback loop of higher wages (the "wage-price spiral") was a major factor in the last period of great inflation in the United States. Rising wages are a legitimate inflation concern. Now that the stimulus checks have been written, wages can only go up so far before it becomes unprofitable for employers to continue running businesses. Most of the recent wage gains have come from service and hourly workers. In these types of businesses, there is a natural upper limit to how much money a person can make. At the time, unions had enormous bargaining power and could continue to demand higher wages. Union membership is currently at an all-time low. Collectively, workers do not have the bargaining power to demand higher wages, and industries where wages have been rising may have hit a natural ceiling. oil pricealso quadrupled in the early 1970s, which had a huge impact on inflation. Not even the most bullish oil analyst thinks oil will hit $400 a barrel.
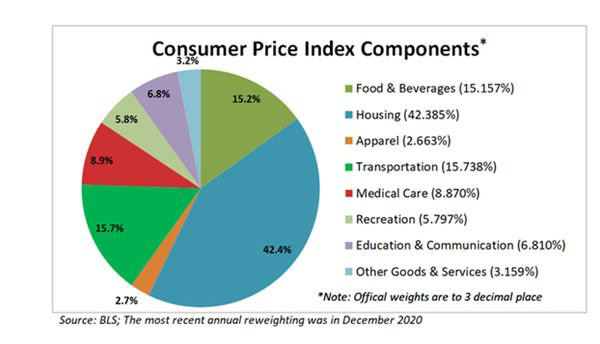
Looking at the actual mechanisms that make up reported inflation, (see CPI breakdown below) housing accounts for over 40% of the index. With home prices up nearly 20% year-over-year, the average selling price is now over $400,000, which is pretty shocking. Because the annual salary in the United StatesThe median is around $35,000, the gap is the highest ever. Overall, housing data should ease after the spring home-buying season. Mortgage applications, a strong leading indicator of future purchases, fell 12.5% in January. The latest data suggests house price growth may have peaked and is turning over. Rising interest rates will only further squeeze demand for new home prices. The adjustment to housing in the CPI does have a lag of a few months, so we shouldn't expect an immediate drop in the CPI, but by the end of 2022 we should be back to a more reasonable headline CPI number.
Last point, 16% of the CPI is transportation (air tickets, used cars, etc.), which is backed up by the highest used car sales figures in history (10% per month, for months!). Used cars alone add 1% to the current CPI figure. This too shall pass. Or used cars will hit $100,000 and people won't be able to afford them (driving prices down). Whichever happens first. But really, this increase is mostly due to a shortage of chips in new cars (which is expected to ease soon), forcing people to think about older cars, and demand from new working groups (most of whom probably already bought their car). We will see in early 2022demand starts to fade. The Fed also expects seven or more rate hikes for the remainder of 2022, which should dampen any remaining inflationary impulses.
image description
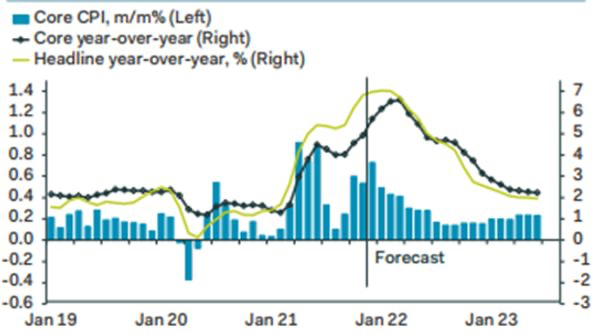
Source: Pantheon Macro
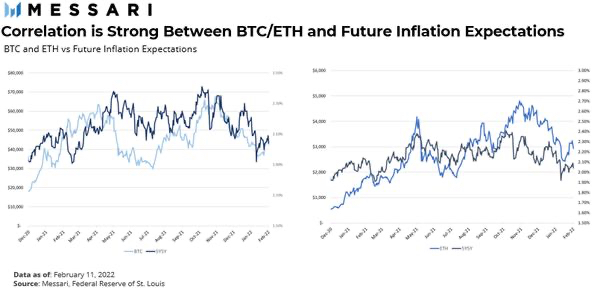
But if we do move to a lower inflation regime after this brief period of high inflation, we will be entering uncharted territory for cryptocurrencies. Cryptocurrencies have never experienced the backdrop of rapidly falling inflation. A look at inflation expectations does give us some clues, though.
secondary title
bull market
bull market
Both Bitcoin and Ethereum started out during historic market bull runs. Since Bitcoin’s launch in 2009, the overall market direction has been “up by the numbers.” Here’s how BTC and ETH have compared to the broader market since BTC’s first bull run in 2012, and the subsequent COVID bull run that began in early 2020.
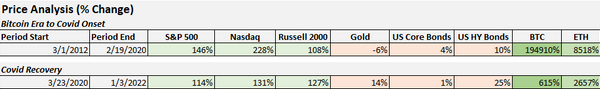
The returns across the board are amazing. Even though these assets have matured, they still have amazing returns in the 2020-2022 bull market.
text
sell off
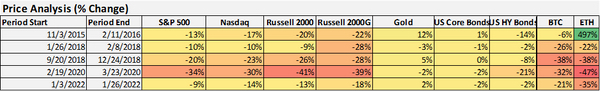
Below is a chart of all 10%+ stock market corrections (as defined by the S&P 500) since Bitcoin’s inception. It's a surprisingly short list.
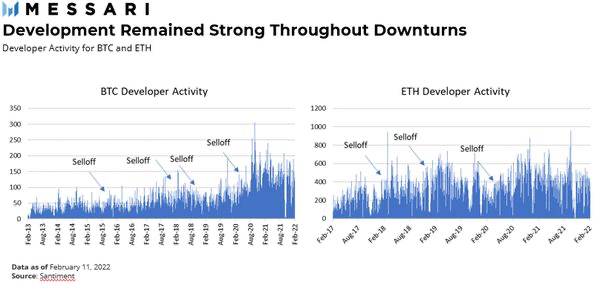
Developer
Developer
text
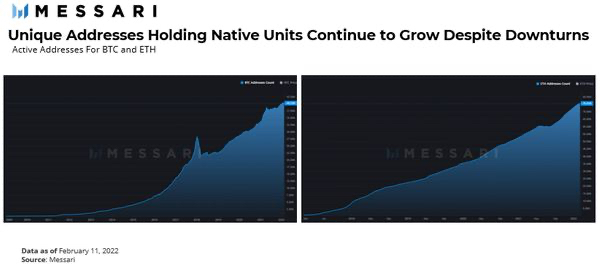
event address
Bitcoin’s active addresses declined in early 2018, among other things, but the data on unique addresses with local units has skyrocketed. A stock market sell-off is bad. Ethereum is an even more impressive case. Except for a flat period of address growth in the summer of 2021, it has never experienced any real address contraction period.
secondary title
Conclusions and main points
BTC and ETH behave less and less like risk assets in normal times, especially BTC exhibits a price pattern similar to value stocks in an environment of stable or declining yields. Still, when the sell-off occurs, cryptocurrencies move in line with the riskiest parts of the market. During these downturns, builders keep building and network activity remains strong. As the market develops, this could increase use cases and overall cash flow, leading to shorter downturns, even in a broader macro bear market.
As we gain more time-series data and the asset class matures, we will likely have to further refine our thinking about the role of BTC, ETH, and other cryptocurrencies in a portfolio. If these trends continue, the role each asset plays in traditional portfolios may become easier for investors to understand, driving more mainstream adoption.
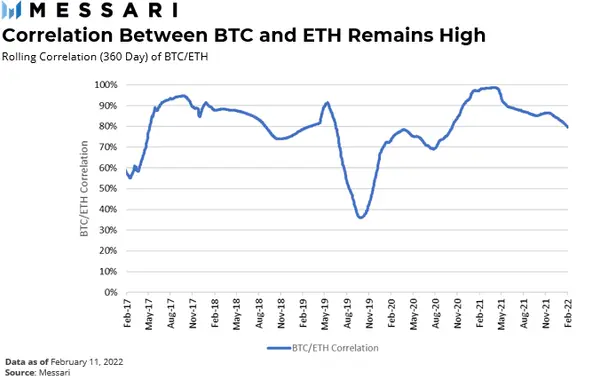
Given the short price histories of other cryptoassets, this analysis is limited to ETH and BTC, but we will soon have more data to understand how different protocols perform across a range of market environments. Currently, the two largest cryptocurrencies are still closely correlated (pictured above), although from our analysis above, we see that this may be changing as Ethereum, and those companies operating on its network, begin to look More like a cash flow generating company than a currency.


