NFTGo function upgrade: comprehensive analysis of NFT investment portfolio of any address
Original Title: Announcing NFTGo.io New Feature: Portfolio Analysis
Recently, NFTGo.io has upgraded the Profile page function. Users can not only view the investment portfolio of each address on NFTGo, but also obtain the address relationship map, which greatly helps NFT investors and enthusiasts to conduct multi-dimensional data analysis.
overview
overview
NFT
Stats
Activity
overview
value index
This module covers the basic information in an address portfolio. Holding value refers to the sum of the prices of each NFT held by the address. Considering the volatility of NFT transaction prices, NFTGo introduces another indicator when analyzing portfolio performance. This metric is known as estimated holding value and is calculated as follows.
Estimated holding value = NFT quantity held by the address × max (average price, floor price)
In addition, estimated unrealized profits (estimated unrealized profits) is another important indicator, which reflects the difference between estimated holding value and holding value.
behavioral indicators
Activities include selling, minting, burning, transferring and buying activities.
This module shows NFT-related historical activities and their changes. The total purchase volume of the address (buy volume) refers to the total expenditure of the account to purchase NFT; by analogy, the total sales volume (sell volume) refers to the total income obtained by the account through the sale of NFT.
Profit reflects the difference between the amount sold and the amount bought.
Stats (data)
The data module shows the full picture of the investment portfolio held by the address, including the following charts:
Position ratio
Position trend
relevant address
relevant address
project details
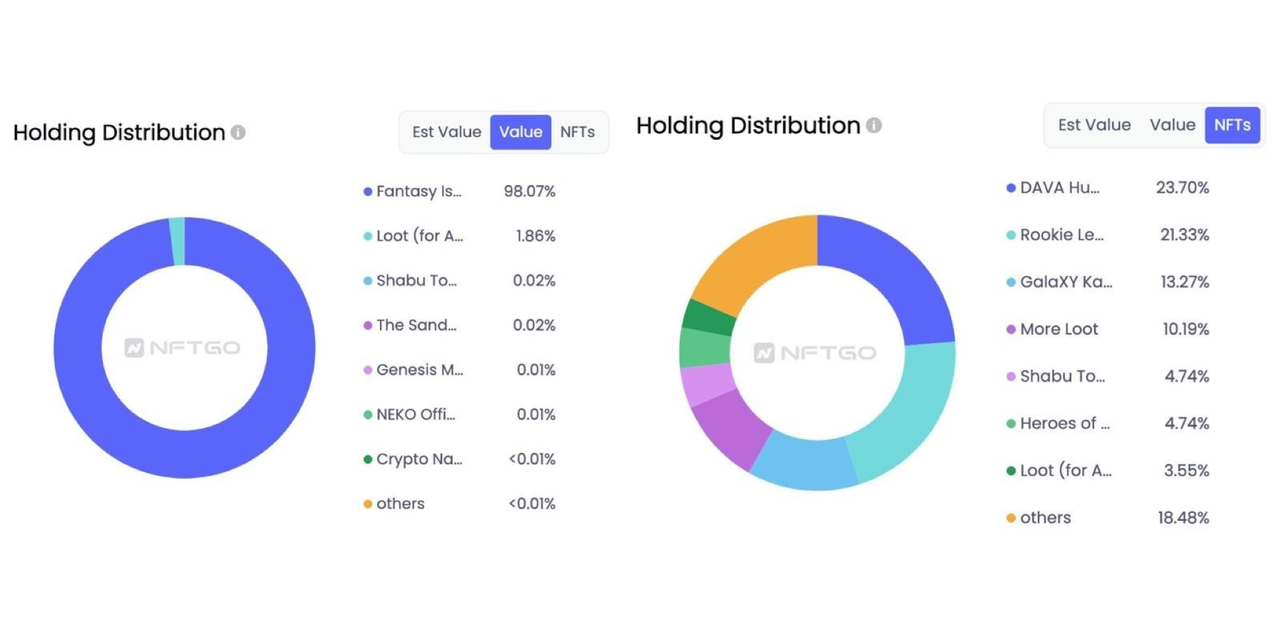
Position ratio
The position ratio chart shows the diversity of the current investment portfolio according to the proportion of NFT holdings in different collections, helping investors discover potential benefits and risks. In the example presented in the figure below, from the perspective of the number of NFTs, the portfolio has a high degree of diversification; however, if analyzed from the perspective of holding value distribution, most of the value of the portfolio comes fromFantasy Islands - Sandbox。
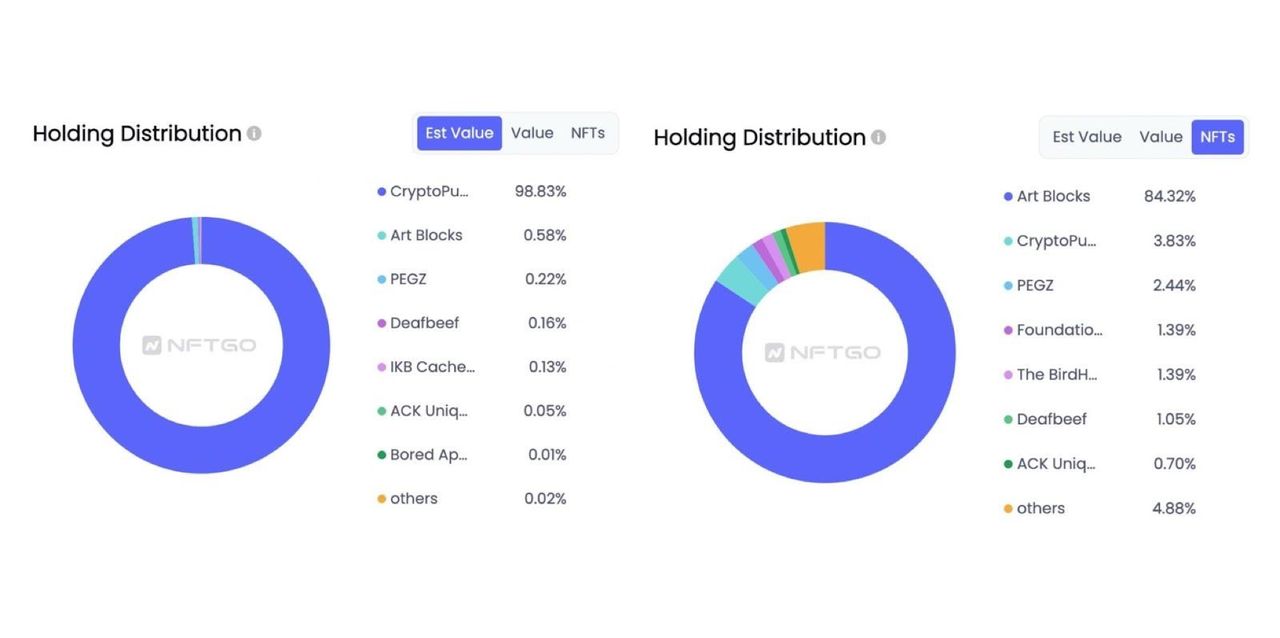
The chart below demonstrates the profitability of each NFT collection in this portfolio. In terms of quantity, most of the NFT held by this address comes fromArt Blocks, accounting for more than 84%; however, the address heldCryptopunksThe estimated holding value of the series NFT accounted for 98.83% of the estimated holding value of the portfolio, while Art Blocks accounted for an extremely low share of less than 1%-reflecting that the continued growth of profits at this address mainly comes from Cryptopunks A surge in value.
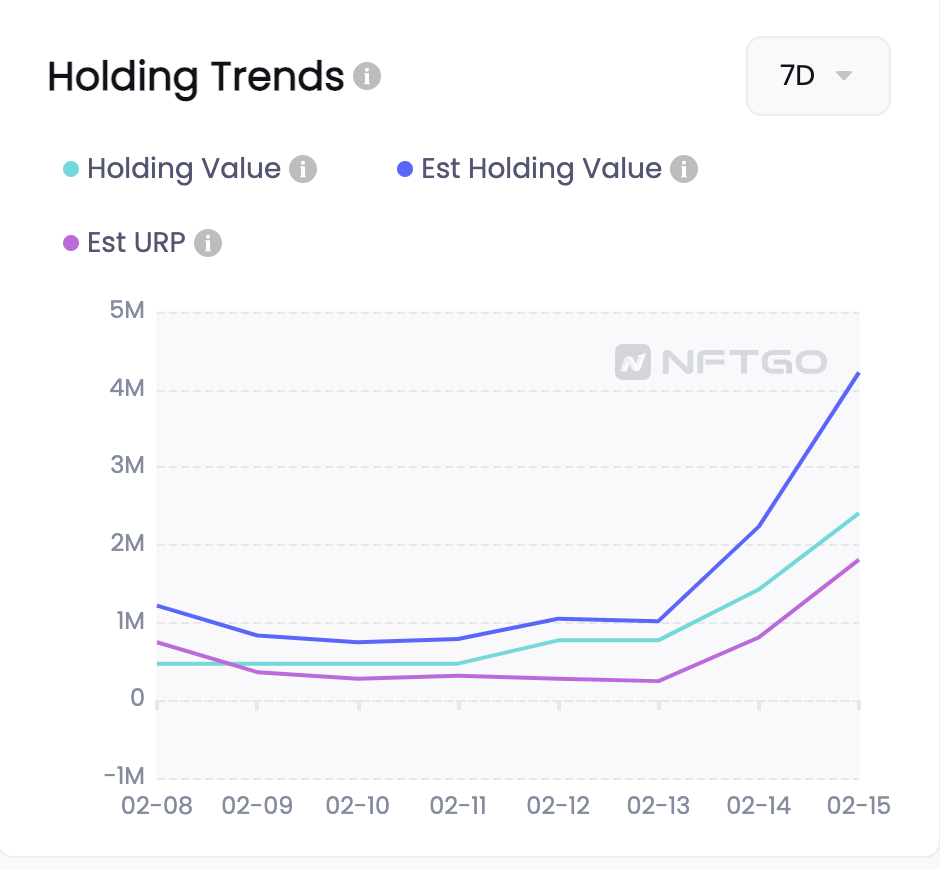
Position trend
Trend analysis is one of the most important manifestations of data-driven decision-making. The position trend chart module records the change paths of the three indicators, which are:
holding value
estimated holding value
Estimated Unrealized Gains
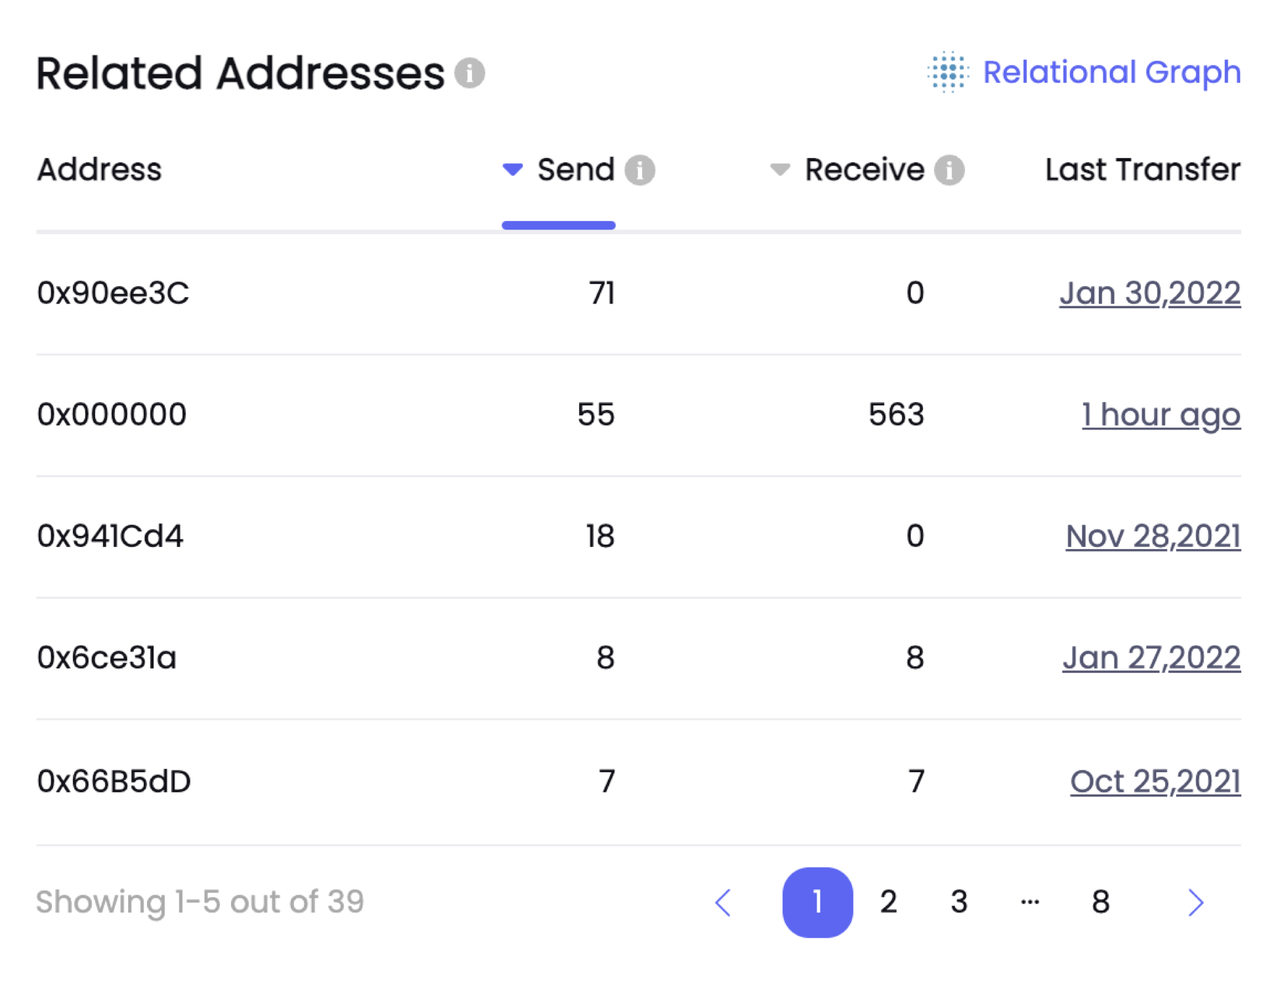
relevant address
relevant address
sheet
sheet
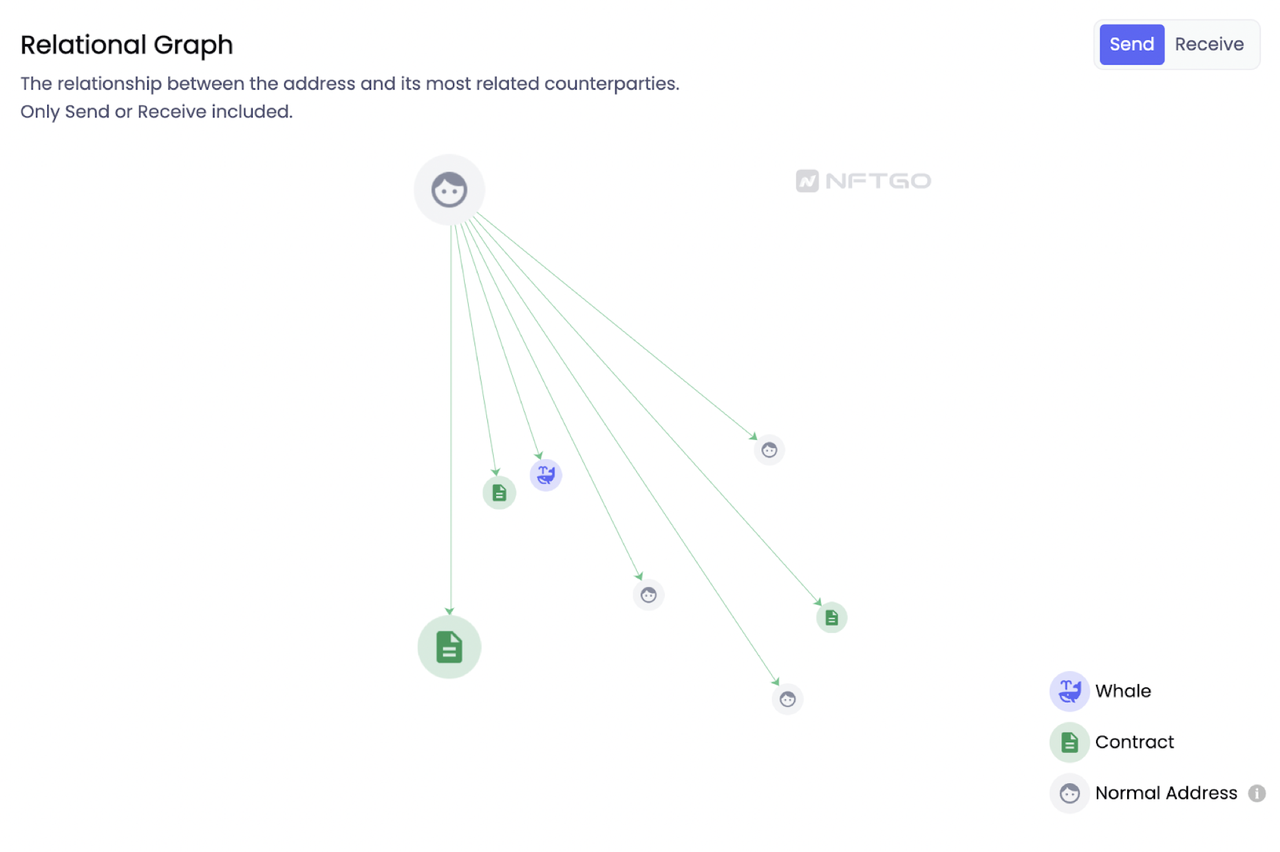
relation chart
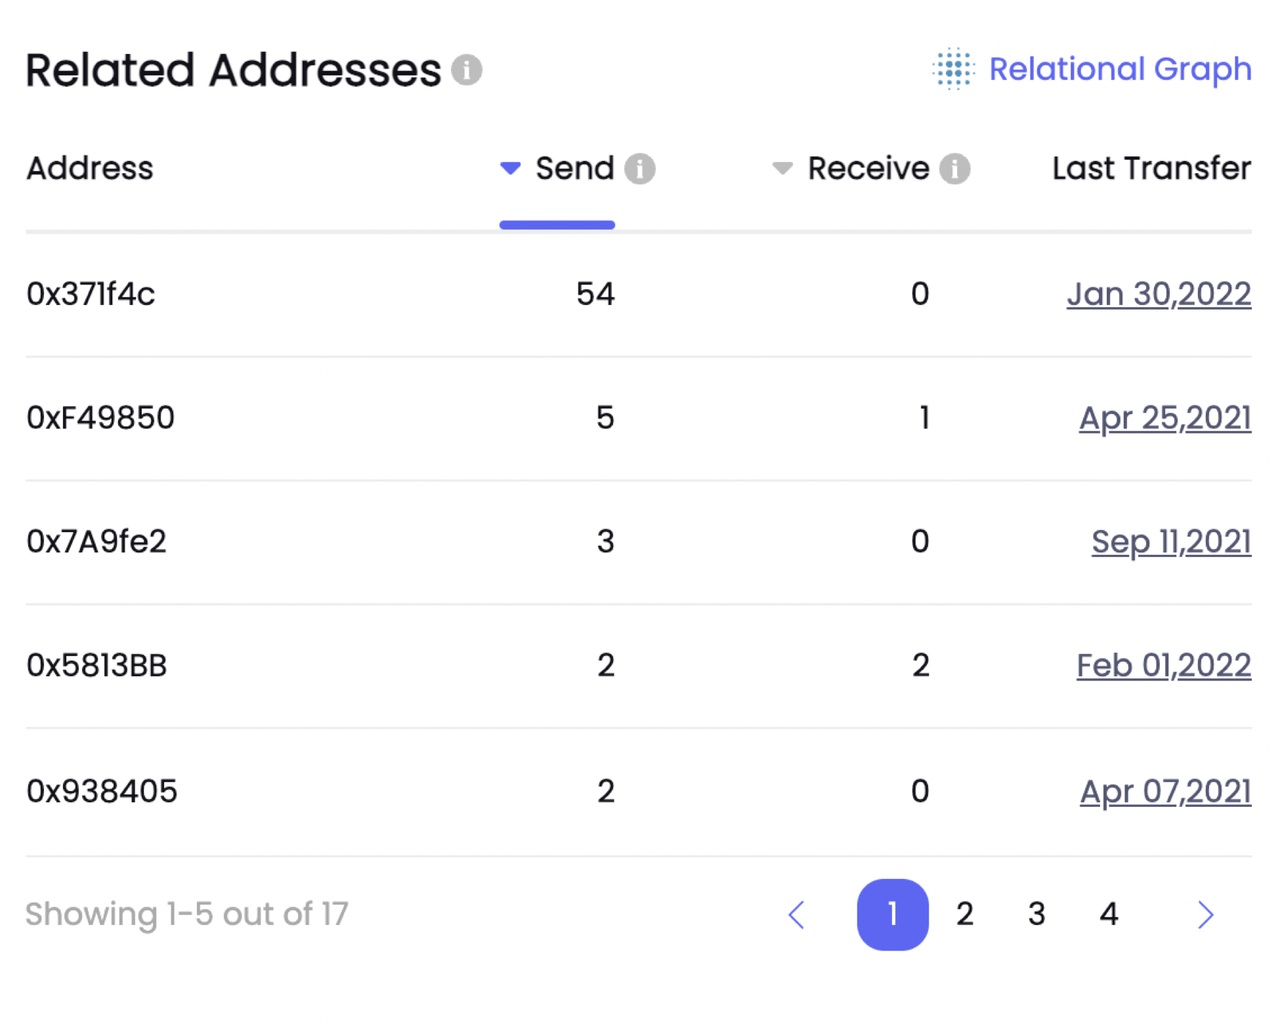
Relevant data includes the scope of each receive/send event, the corresponding address, and the time of the last transaction.
Note: The icon 📄 indicates the contract address, and the icon 🐋 indicates the whale address.
project
project
The project module integrates the relevant information of each collection held by the address in the form of a table, reflecting the income or loss brought by each NFT project held by the address.
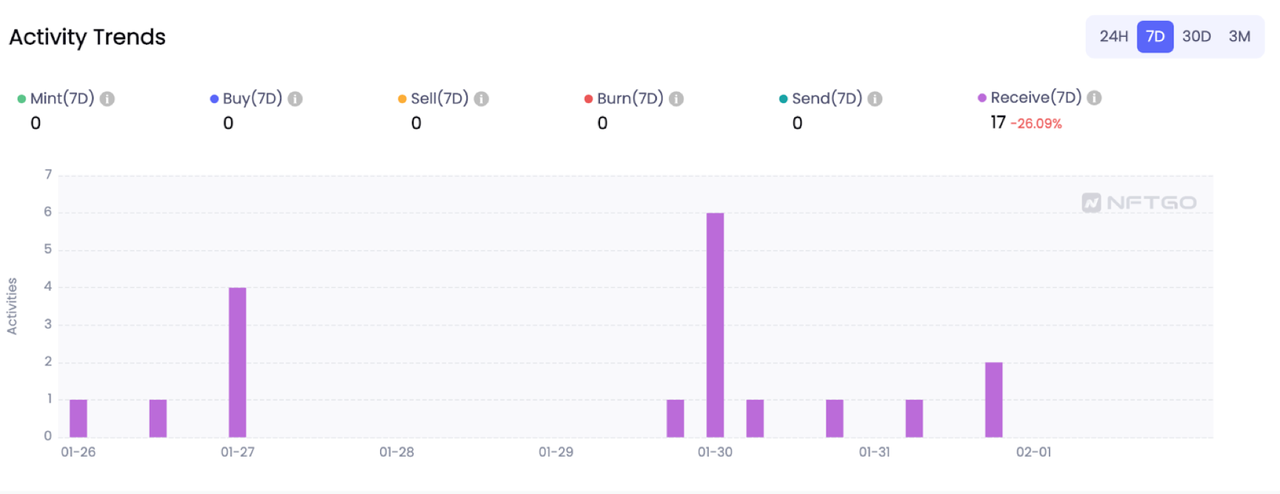
Activity
The activity tracking function is an important part of the portfolio analysis tool. This module shows all activity for this address.The following figureIt is an activity trend bar chart. Here are a few data points to consider when analyzing activity trends, where minting, buying, selling, burning, sending, and receiving are all represented in the chart.
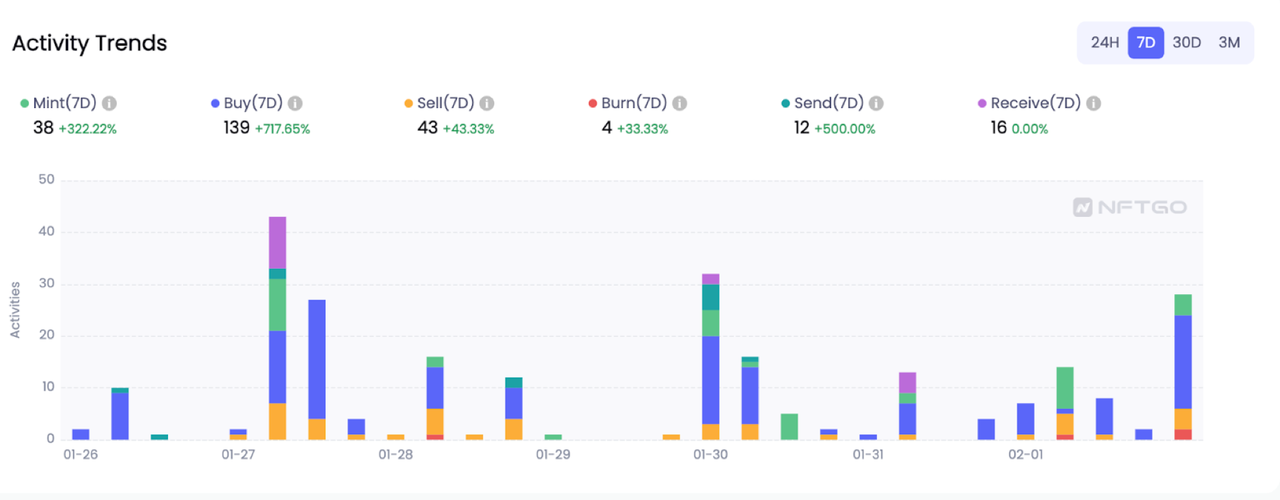
The graph shows the volume of each activity and its relative contribution to other activities during the selected time frame. As can be seen from the above figure, overall, the purchase activity of this address is the most active.
Contract addressContract address。
By looking at the contract’s activity graph, we can clearly see that this contract address acts as another “vault” for the current whale address.
The above functions can help users easily and quickly distinguish the functions of different addresses, and users can also select the corresponding time period to view the detailed information of various activities of a certain address.
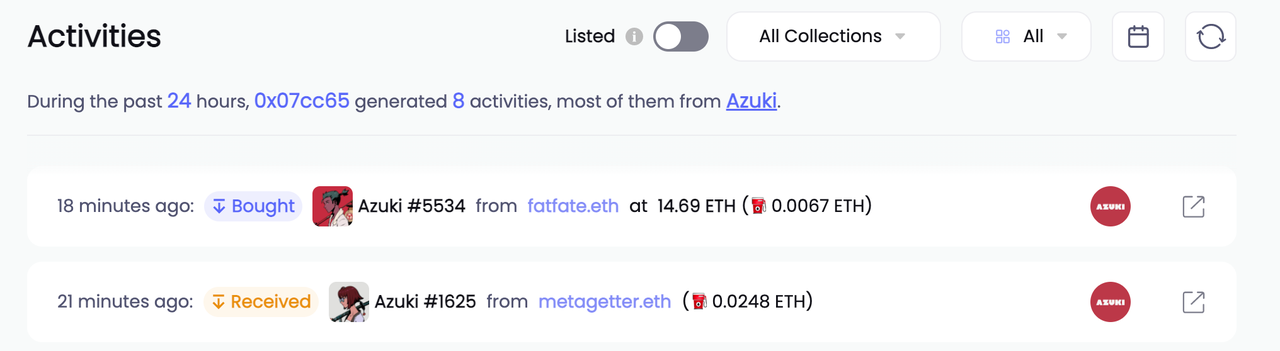
Through these options, users can filter and obtain important data that affects decision-making. Since NFTGo does not include all NFTs on the blockchain, users can choose to only display items that have been included in NFTGo.
Users can also filter the data based on favorites or events, or use the calendar function to select a specific time range.
If you want to know the relevant product information at the first time, please pay attention to the social platform account of NFTGo, click to read the original text to view the original text: https://mirror.xyz/nftgoio.eth/9aS7y5m8ruaGkjqyl_JRuk4pPNyi1UEpL59b8JkD7es