Understand how to build an Ethereum gas tracker in five minutes

introduce
secondary title
introduce
The London hard fork in August 2021 brought about the largest upgrade in the history of the Ethereum network. The fork implements EIP-1559; a gas pricing mechanism touted as superior to the blind auction model. It also introduces a fundamental change in Ethereum’s (ETH) monetary policy, making it a deflationary currency, at least in the short term.
In this tutorial, we will build a gas tracker that tracks the two new components of gas fees in EIP-1559 and other statistics (such as block size) for the last 20 blocks. By doing this, we will achieve two important goals:
Gain a deeper understanding of how EIP-1559 works, and what improvements it brings.
A full-featured gas tracking application that retrieves the latest block volume and gas fees, categorized by base and priority fees.
In order to do this, we'll use Alchemy, the Alchemy web3.js library, Node, and React. If these words sound foreign to you, don't worry, we'll cover them in detail!
This tutorial assumes the reader has a basic understanding of how gas and gas prices work on Ethereum. A preliminary understanding of EIP-1559 is also helpful, but not required.
EIP-1559 Quick Review
EIP-1559 brings the following changes to Ethereum's gas pricing mechanism:
The blind auction gas fee is now replaced by two fees: a base fee and a priority fee (or miner tip).
The base fee is determined automatically by the network. It can be increased to 12.5% if the previous block was full and decreased to 12.5% if the previous block was empty.
The miner's tip is determined by the user and can be tuned according to the urgency of the transaction.
Base fees are burned by the network to prevent miners from artificially flooding blocks. However, miners can pocket the tip.
In addition to improving gas prices, EIP-1559 also proposes improvements to better equip the network to handle sudden traffic spikes. As you probably know, transactions in Ethereum are grouped into blocks. Before the fork, a block could only hold 15 million gas transactions regardless of traffic.
With the upgrade, the block size cap has doubled to 30 million gas. This is done to better respond to periods of increased demand. However, it is expected that the base fee will adjust to an average of 50% of the block volume (or gas used by the block) or around 15 million gas.
You can see how this all works in real time with the gas tracker we made. We will build this project in two parts: In the first part, we will write a node script that tracks the history of transaction fees in real time. In the second part, we will utilize this script to create a React application to build the final tracker.
Part 1: Transaction Fee History Script
In this section, we will write a script (in a node) that will allow us to get a history of gas fees for the last 20 blocks on the Ethereum network.
Step 0: Install node and npm
Make sure you have node and npm (at least v14 or higher) installed on your local machine.
Step 1: Create an Alchemy account
In order to get the latest gas fee history for a block, we need to connect to the Ethereum network for communication. Alchemy is a blockchain development platform that allows us to do this without launching our own nodes.
Step 2: Create an Alchemy application (and API key)
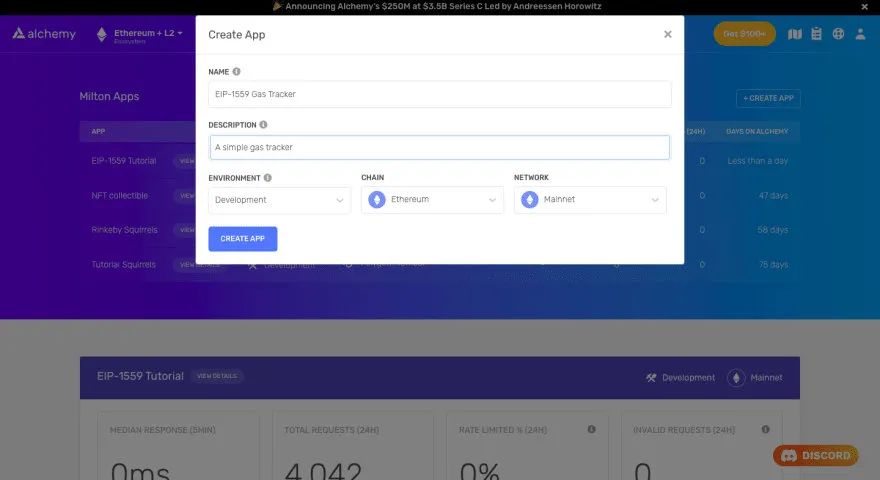
Create an application on the Alchemy dashboard. The chain is set to Ethereum and the network is set to mainnet.
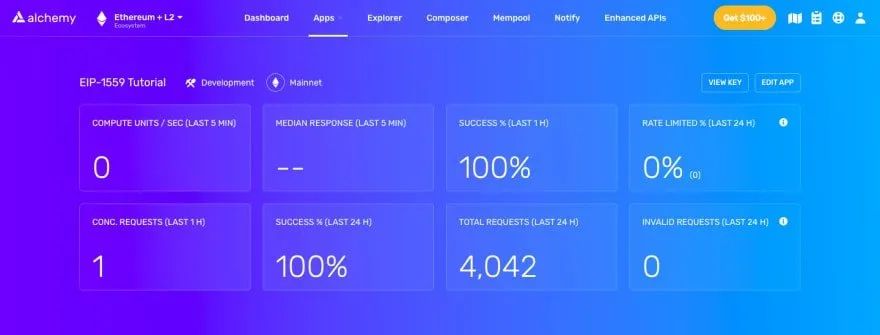
Next, visit your application page and click View Key. This will open a popup with the application's HTTP and Websocket URLs. In this tutorial, we will use Websocket URL.
Step 3: Create a node project and install dependencies
> mkdir gas-tracker-script && cd gas-tracker-script > npm init -y > npm install --save @alch/alchemy-web3 > touch main.js
Now we can start writing node scripts. Let's create an empty repository and install dependencies. For this script, we will need the Alchemy web3.js library.
On your terminal (or command prompt), run the following command:
This will create a repository called gas tracker-script with all the files and dependencies we need. Open this repo in your favorite code editor. We will write all the code in the main.js file.
Step 4: Create a web3 client instance using Alchemy
const { createAlchemyWeb3 } = require("@alch/alchemy-web3");// Using WebSockets
const web3 = createAlchemyWeb3(
"wss://eth-mainnet.alchemyapi.io/v2/<--API KEY-->",
);
Creating a client instance with Alchemy web3 is very simple.
In the main.js file, add the following lines of code:
Make sure to replace the placeholders above with your application's websocket URL.
Step 5: Get the history of the last 20 blocks
We want the gas cost history for the last 10 blocks. The data we are interested in includes base fees, preferred fee ranges, block sizes, and block numbers.
Luckily, Alchemy has a very handy eth_feeHistory that automatically returns all of the aforementioned data.
web3.eth.getFeeHistory(20, "latest", [25, 50, 75]).then(console.log)
All we need to specify is the most recent block for which we want data, the total number of blocks to look at, and the percentage range for the preferred fee.
We are interested in the most recent 20 blocks and the 25th, 50th and 75th percentiles of priority fees.
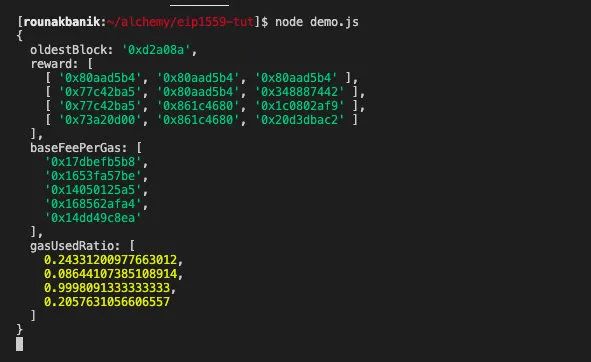
Running this script (using node main.js) should fetch the data you're looking for. Here is some data, the result I received after requesting 5 blocks of data.
Step 6: Formatting the output
const formatOutput = (data, numBlocks) => { let blocks = []
for (let i = 0; i < numBlocks; i++) {
blocks.push({
blockNumber: Number(data.oldestBlock) + i,
reward: data.reward[i].map(r => Math.round(Number(r) / 10 ** 9)),
baseFeePerGas: Math.round(Number(data.baseFeePerGas[i]) / 10 ** 9),
gasUsedRatio: data.gasUsedRatio[i],
})
}
return blocks;
The output we received in step 5 was correct, but not very readable. Fees are represented in hexadecimal, and the data structure makes it difficult to figure out which data corresponds to which block.
const numBlocks = 5;web3.eth.getFeeHistory(numBlocks, "latest", [25, 50, 75]).then((data) => {
const blocks = formatOutput(data, numBlocks);
console.log(blocks);
});
Let's write a small function that converts the raw data into a list of dictionaries, where each dictionary will contain the data on a particular block. This function also converts all hexadecimal gas values expressed in wei to decimal numbers expressed in Gwei.
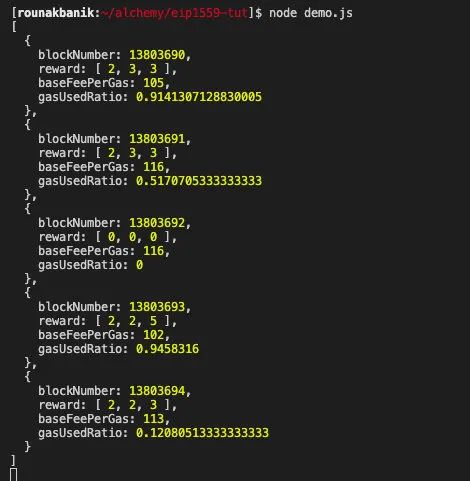
Finally, let's use this function as feeHistory.
Running this version of the script should produce output in the following format:
Step 7: Subscribe to the latest block header
let subscription = web3.eth.subscribe('newBlockHeaders');subscription.on("data", () => {
web3.eth.getFeeHistory(numBlocks, "latest", [25, 50, 75]).then((data) => {
const blocks = formatOutput(data, numBlocks);
console.log(blocks);
});
});
A new block is added to the Ethereum blockchain approximately every 15 seconds. So, ideally, we'd like to subscribe to events for blocks being added, and update our transaction history so it always shows data from the last 20 blocks.
Let's nest the getFeeHistory function inside the subscribe event callback.

Running the main.js script now will output a batch of the latest data every 15 seconds or so. If you've come this far, congratulations! You now have a fully functional gas tracker.
Part 2: React application
In the previous section, we wrote a script that retrieved the fee history for the last 20 blocks every time a new block was added to the Ethereum mainnet.
In this section, we'll build a small React application that streams this data from the terminal to the browser. In addition to the fee transaction history, we will also display the average gas fee and block size over the past 20 blocks.
> npx create-react-app gas-tracker-frontend > cd gas-tracker-frontend
Step 1: Initialize the React project and install dependencies
> npm install --save @alch/alchemy-web3
Execute the following command:
This will create a sample React project. In addition to the react dependencies, we also need to install the Alchemy web3 library from the previous section.
import './App.css';
import { useEffect, useState } from 'react';
import { createAlchemyWeb3 } from '@alch/alchemy-web3';const NUM_BLOCKS = 20;function App() { const [blockHistory, setBlockHistory] = useState(null);
const [avgGas, setAvgGas] = useState(null);
const [avgBlockVolume, setAvgBlockVolume] = useState(null); const formatOutput = (data) => { let avgGasFee = 0;
let avgFill = 0;
let blocks = []; for (let i = 0; i < NUM_BLOCKS; i++) { avgGasFee = avgGasFee + Number(data.reward[i][1]) + Number(data.baseFeePerGas[i])
avgFill = avgFill + Math.round(data.gasUsedRatio[i] * 100); blocks.push({
blockNumber: Number(data.oldestBlock) + i,
reward: data.reward[i].map(r => Math.round(Number(r) / 10 ** 9)),
baseFeePerGas: Math.round(Number(data.baseFeePerGas[i]) / 10 ** 9),
gasUsedRatio: Math.round(data.gasUsedRatio[i] * 100),
})
} avgGasFee = avgGasFee / NUM_BLOCKS;
avgGasFee = Math.round(avgGasFee / 10 ** 9) avgFill = avgFill / NUM_BLOCKS;
return [blocks, avgGasFee, avgFill];
} useEffect(() => { const web3 = createAlchemyWeb3(
"wss://eth-mainnet.alchemyapi.io/v2/<--API KEY-->",
); let subscription = web3.eth.subscribe('newBlockHeaders'); subscription.on('data', () => {
web3.eth.getFeeHistory(NUM_BLOCKS, "latest", [25, 50, 75]).then((feeHistory) => {
const [blocks, avgGasFee, avgFill] = formatOutput(feeHistory, NUM_BLOCKS);
setBlockHistory(blocks);
setAvgGas(avgGasFee);
setAvgBlockVolume(avgFill);
});
}); return () => {
web3.eth.clearSubscriptions();
}
}, [])
return (
EIP-1559 Gas Tracker
{!blockHistory &&
Data is loading...
}{avgGas && avgBlockVolume &&
{avgGas} Gwei | {avgBlockVolume}% Volume
}{blockHistory &&
| Block Number | Base Fee | Reward (25%) | Reward (50%) | Reward (75%) | Gas Used |
|---|---|---|---|---|---|
| {block.blockNumber} | {block.baseFeePerGas} | {block.reward[0]} | {block.reward[1]} | {block.reward[2]} | {block.gasUsedRatio}% |
);
}export default App;
Step 2: Populate the App.js file
All our logic will reside in the App.js file. Copy the following content to the above file.
Since this is not a React course, we are not going to delve into React-specific parts. But you should be able to observe that all we're doing is retrieving the expense history as we did in the script and outputting it as an HTML table.
The only additional logic we use is to calculate the average gas price and average block size over 20 blocks, which is a trivial task.
.main-container {
text-align: center;
}table {
border-collapse: collapse;
margin: 20px auto;
box-shadow: 0 8px 16px 0 rgba(0,0,0,0.2);
}thead {
background: linear-gradient(267.45deg,#05d5ff -34.23%,#53f 99.39%);
color: white;
padding: 10px;
}th {
font-size: 18px;
padding: 15px;}tbody > tr {
border-top: 1px solid #ccc;
border-bottom: 1px solid #ccc;
margin: 0px;
padding: 15px;
}td {
padding: 6px;
}.gas {
color: #4299E1;
}.vol {
color: #4C51BF;
(Optional) Step 3: Add some styles
You can add some basic styles in the App.css file like this:
npm start
Step 4: Deploy the application to localhost
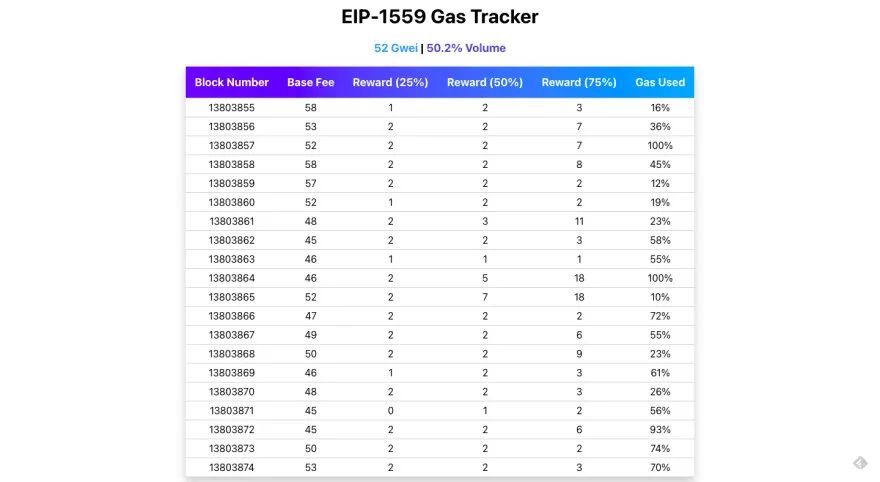
Here's what the app should look like:
analyze
Congratulations! You have a fully functional gas tracking application.
analyze
Let's go back and analyze the data above. The following are direct results of the EIP-1559 implementation that we can observe.
The base fee does not fluctuate greatly from block to block. In fact, its largest increase or decrease was 12.5%.
Block sizes tend to fluctuate, but the average block size hovers around 50%.
in conclusion
The data seems to indicate that gas costs are much more predictable in this model. Since everyone pays the same base and priority fees, and in most cases the priority fee is only a small fraction of the total fees, most transactions don't end up paying exorbitantly for gas. Therefore, this sample data shows that EIP-1559 has successfully achieved its goals; more predictable gas prices, less gas overpayments.
We've covered a lot in this article. By building a gas tracker for EIP-1559 from the ground up, I hope you can understand and appreciate the improvements it brings to Ethereum transactions.