
In-depth discussion of the indicator framework that affects the direction of 2022 and the next BTC bull-bear cycle
At 18:15 UTC on January 3, 2009, the genesis block of the Bitcoin network was born, and the first batch of 50 BTC was dug out by Satoshi Nakamoto. It has been a full 13 years since Bitcoin, and with three halved block rewards, BTC has also experienced three complete bull-bear cycles. Today is the 13th anniversary of Bitcoin. Next, let’s discuss the influencing factors and indicators that cannot be ignored in the BTC bull-bear cycle.
TL;DR
The cryptocurrency market is closely related to the global economy (even from beginning to end), and it is necessary to combine changes in the external economic cycle to judge the time point of value return.
Bitcoin is not a safe-haven asset, it has the attributes of a risky asset, and it is more sensitive to inflation than stocks.
The traces of policy (fiscal policy and monetary policy) stimulus are more obvious in the recovery of the economy.
If smooth reduction is the goal of the Fed, it may still provide easing, but not expand easing, to achieve the effect of a moderate interest rate increase.
The regulatory issue of USDT as a Crypto safe-haven asset should be considered in the policy risk next year.
1k-10k BTC giant whales are more sensitive to the bull-bear cycle, and have obvious cycle prediction value.
"Old Money" movement is usually a precursor to a change in the chart.
first level title
1. Introduction: How does 2022 BTC describe?
secondary title
image description
Data source: OKEX, 2020.1.1-2021.12.31
Bitcoin is called digital gold, its quantity is limited and it is scarce. And the inflation rate has a "half-decay" every four years, with its own anti-inflation attributes. In addition, at the transaction level, the consensus on Bitcoin prices is still in the discovery stage, and the volatility is relatively high. In 2021, it will rise and fall twice, which is a risk asset.

So, when will the narrative (Narrative) of these two attributes be bought by the market, resulting in a directional consensus on both sides of supply and demand? When is BTC more like gold and when is it more like stocks? Is Bitcoin's true independent market still there? Just an interesting question.
Cryptocurrencies as a class of global assets, according toCompaniesMarketcapThe data show that there are currently about$2377b(billion), about 1/5 of the market value of gold. Among them, the market value of Bitcoin (BTC) is about $965b, accounting for about 40% of the market value of the encryption market. Assets of this size must be in the portfolio or shortlist of global investors, and to a certain extentby the global economic environment, policy and other external factors.On the other hand, Crypto also has its ownFundamental and trading informationsecondary title
Top 10 global asset market capitalization

Data source: Companies Marketcap
secondary title
BTC Analysis Framework

First of all, external factors refer to the macroeconomic environment other than Crypto, which determines the market trendexpansion or contraction. Whether inflation and the economy picks up determines the external environment of BTC. The analysis of this part mainly lies in the globalJudgment on the flow and direction of funds, and the investor'srisk appetitecapital costcapital costDetermined by the rate of return on risk-free assets and transmitted to the market terminal. On this basis, inflation affects people's purchasing poweractual income. Some factors with high uncertainty, such as the epidemic and supervision, will bring variables to the market with a certain probability.
Starting from Bitcoin itself, BTC was first designed as a monetary mechanism independent of the existing central bank.Decentralized Currency Model, is an asset after being traded. As a currency, the meaning of its existence isretained value, the value target ispurchasing power, which is one of the biggest differences between it and ordinary stocks. And the elements that support something to become currency areTrust and Adoption. People believe that precious metals become money because of their physical scarcity, that fiat currencies are backed by governments, and that Bitcoin is all about mathematics. Decentralization and mathematical algorithms with higher certainty make Bitcoin more credible, and the accumulation of trust will be transmitted tomarket adoption, is determined by the degree of market acceptancefirst level title。
2. External Factors—Consensus Outside the Circle
The U.S. dollar anchors the future economic prospects of the United States, and BTC anchors the Crypto market and some assets outside the circle. The value of BTC relative to the U.S. dollar istext。
image description
Data source: TradingView, 2014.12-2021.12
Bitcoin, as an asset with limited inflation and a "half-life" inflation rate, can catch up with the assets held by the Federal Reserve, which has implemented quantitative easing (QE) multiple times in terms of market value. "Super QE" is particularly obvious.
At the same time, we can also infer that the cryptocurrency market, which is half of BTC, is closely related to the global economy (even from beginning to end).
Next, let's disassemble the influencing factors in the external environment of Bitcoin.
inflation
inflation
BTC price (log, blue) vs 10-year breakeven inflation rate (yellow)

Data source: TradingView, 2020.8-2021.12
The 10-year breakeven inflation rate (T10YIE) is often used to represent the market's inflation expectations for the dollar. It can be seen from the trend that the BTC price and the expected trend of inflation are highly correlated, almost in parallel.
U.S. debt
U.S. debt is a bond issued by the U.S. Treasury Department on the basis of U.S. national strength, including economic credit, and is an advance consumption of the future economy.
U.S. Treasuries are the basis for pricing in the fixed-income (risk-free) market, affecting almost any security around the world. If its rate of return fluctuates and is synchronized to the financing environment, it may triggerrisk repricing, leading to volatility in emerging markets like cryptocurrencies.
BTC price (blue) vs US bond 10-year yield (yellow)

Data source: TradingView, 2020.4-2021.12
The 10-year U.S. bond yield is a nominal interest rate, which represents market expectations for long-term interest rates.
On the whole, the inflation rate and U.S. bond yields have generally risen, which has a strong correlation with the price trend of BTC.
image description
Image from: OKLink
As an alternative indicator of expected economic growth, the overall decline in real interest rates (TIPS) has dropped from 1.57 in April 2020 to -0.98 at the end of 2021, while inflation and nominal interest rates have generally risen. The traces of policy (fiscal policy and monetary policy) stimulus in the recovery are more obvious.
2. Fiscal Policy & Monetary Policy: Guiding Direction
Since the United States is the largest economy in the world, and the U.S. dollar is also the joint of global currency liquidity, this part of the analysis focuses on the fiscal and monetary policies of the United States. The U.S. Congress sets the government's fiscal policy, and the Federal Reserve sets monetary policy. The latter bears the maintenance entrusted by CongressTriple OKR of long-term interest rate stability, long-term dollar value stability (inflation) and maximum employment。
Fiscal policy and monetary policy are the supply-side and demand-side respectively at the transaction level.
Since the outbreak of the epidemic in 2020, the supply side has been relatively stable, and a series of strong fiscal stimulus has been introduced. After 22 years, the stimulus began to decline. According to the budget of the Congressional Budget Office, the fiscal deficit in 22 years will drop from 3 trillion in 21 to 1.2 trillion.
In recent years, monetary policy has been mainly controlled by QE and the federal funds rate. Since 2008, major central banks have pumped more than $25 trillion into the global economy, of which more than $9 trillion has been “mint” on bond purchases in response to COVID-19 alone. Currently, central banks around the world need to unwind large-scale asset purchases without affecting economic growth.
The monetary policy of the United States in 2022 will focus on shrinking debt and raising interest rates, and what we usually refer to as "raising interest rates" is raising the federal funds rate (FFR). Buffett likens interest rates to the gravity of the stock market. The higher the interest rate, the greater the gravity.
First of all, based on information from various sources, the purpose of this round of interest rate hikes is toprevent inflation in the US, Since the beginning of 21 years, the CPI and CPE indexes have continued to rise, and the Federal Reserve has also admitted that inflation is not temporary, which also shows that the Federal Reserve has begun to deal with inflation.
Secondly, in order to balance the employment rate and inflation rate, and learn from the situation of the previous cycle to avoid the recurrence of "tap panic", the Fed is expected to steadily test the market's reaction.
Federal Reserve Chairman Powell said after the FOMC meeting in December that it was confidence in the economic outlook that allowed the Fed to accelerate Taper. This move can be seen as ahawk among doves, that is, moderate and tough, can be said to be the main style of this Fed.
ps: The market's expectations for interest rate hikes will be reflected in CME's federal funds rate futures.
In the figure below, the GDP growth rate is relatively normal.There are no signs of economic overheating, considering that people may have become dependent on the Fed to inject stimulus into the market, the main problem at present is to eliminate the impact of policy since the epidemicexcessive subsidyThis "dependence" brought about. Coupled with the large-scale infrastructure policies of the Bai and other governments, a relativelow interest environment, to reduce the government's debt repayment pressure. If a smooth taper is the Fed's goal, maintaining the size of the balance sheet by reinvesting a percentage of maturing proceeds from Treasuries and MBS may be one of the options. ie stillTo provide easing, but not to expand easing, to achieve a moderate interest rate effect.
image description
Data source: TradingEconomics, 2016.1.1-2021.12
For the market, apart from reducing the scale of bond purchases and raising interest rates, the biggest uncertain factor isThe Fed's view of its balance sheet. The Fed has stated that it will not start shrinking its balance sheet until the interest rate level is normalized, so the market generally believes that the shrinking of the balance sheet will happen in thelate in the rate hike cycle. Goldman Sachs predicts that in addition to the 3 rate hikes in 2022, the 4th rate hike may be in theFirst half of 2023, It is also possible that the shrinking of the balance sheet will start at that time. And this time is just in the middle and late period of the halving of Bitcoin production (usually the trough of the bear market cycle), with the release of the Fed news, it may form a long-term pressure on the price of BTC. The impact of the Fed's eventual balance sheet reduction on markets can sometimes be greater thanhike bigger. Because the Fed has purchased too many assets, which has increased from 4.1 trillion US dollars in January 2020 to 8.7 trillion now.
3. Risk of uncertainty
However, with economic indicators and policy factors, the trend cannot be confirmed, and there are still some uncertain factors. Here are two points:
Supervision
Supervision
The epidemic will bring about a series of chain reactions such as employment problems→supply chain→commodity prices→economic expectations→monetary policy. For example, the announcement of the South African variant of the new crown on 11.26 caused panic, global stock markets plummeted, and Bitcoin immediately fell by 8%. The prices of safe-haven assets, such as U.S. bonds, Japanese yen, and Swiss francs, rose significantly. It can be seen that the market has a strong consensus on the bearish effect of the rebound of the epidemic on risky assets. With the emergence of prevention and control, vaccines and even possible special drugs, it is believed that the impact of the epidemic in 2022 will not be too great.
In terms of policy, after May 19, a series of policies to crack down on virtual currency mining were introduced, and the computing power plummeted, causing panic.

Data source: Master on OKLink
The policy pressure in 2022 may mainly come from the U.S. supervision of USDT, USDC and other USD stablecoins, or on-chain USD. The market value of USDT plus USDC accounts for about 8% of the total market value of Bitcoin and Ethereum, which is already a considerable scale. We said earlier that Bitcoin can store value, but it cannot be a hedge. The real safe-haven asset in Crypto is only the US dollar on the chain, and it is also the channel for most investors to enter or exit the Crypto market. Therefore, the regulatory issue of such a large-scale safe-haven asset should be considered in the policy risk next year.
To sum up, market indicators (inflation and U.S. debt) reflect the current situation of the economy and market expectations. Fiscal and monetary policies hope to guide the direction of the market through the adjustment of market parameters. Epidemics and regulations constitute market uncertainty risks. It affects the judgment and sentiment of the market, and the asset positioning of BTC determines how this judgment or sentiment views it.
3. Asset positioning of BTC
Gold price index/BTC price (log, blue) vs US Treasury 10-year yield (green)

Data source: TradingView, 2014.4-2021.12
It is not difficult to see that the two curves basically present a relatively obvious negative correlation trend. That is, long-term interest rates strengthen, market risk appetite increases, and the more gold you can buy per unit BTC, that is, the relative appreciation of BTC; in a smaller range (such as the blue area), long-term interest rates weaken, and risk aversion takes the lead Dominant, gold appreciates against Bitcoin.
We usually say that Bitcoin is scarce, and the category of value storage may only be applicable in a small range, such as the status of BTC in the Crypto market. In other words, the scarcity attribute of Bitcoin has not really gone out of the circle.
Although Bitcoin is more inflation-resistant than gold, and both have value-preserving attributes, Bitcoin is not a safe-haven asset, but has the attribute of a risk asset.As can be seen from the figure below, the volatility of Bitcoin is highly correlated with stocks, and the volatility trends are also highly similar.
BTC price (blue) vs NASDAQ index (orange) vs Tesla stock price (green)

Data source: TradingView, 2020.10-2021.12
Note: The rise and fall of BTC can anchor at least one of NASDAQ or Tesla
BVOL (Bitcoin Historical Price Volatility Index, blue) vs VIX (S&P 500 Volatility Index, yellow)

Data source: TradingView, 2020.1-2021.12
To sum up, we position the four assets mentioned above in the figure below. Gold and treasury bonds are safe-haven assets (on the left side of the vertical axis), with low risk appetite, but gold is relatively pro-inflation, which means that sometimes BTC and gold trends have a certain correlation;Bitcoin and Stocks Are Risky Assets(to the right of the vertical axis),It depends on the improvement of the economy and the rise of inflation, and Bitcoin is more sensitive to inflation than stocks。

It should be noted that in the long run, the strengthening of the economy and the expansion of inflation are good for BTC. But in the short term it mayGive politicsStrategies to remove negative factors。
For example, before the release of the CPI (Consumer Price Index) data on December 10, both the U.S. bond yield (nominal interest rate) and the breakeven inflation rate (inflation expectations) continued to rise, indicating that the market gave higher inflation expectations and strengthened the Expectations of tapering and bringing forward rate hikes. Tapering bond purchases and raising the federal funds rate are both monetary policies. It is the bad news that the interest rate hike is expected to be priced in. After the Federal Reserve FOMC meeting on December 15, it will bring a wave of rise.
If it is said that in 2021, Crypto is regarded as a hedging asset for inflation risk, and is favored by funds. Then the property of hedging inflation in 2022 will berelatively weakened, the attributes of risky assets are enhanced.
As far as next year is concerned, the current interest rate hike expectations have peaked, and the future direction is likely to fall, waiting for further confirmation of the non-agricultural employment report.In the long-term interest rate hike expectations, the market needs time to digest, so that it is possible not to panic when the interest rate hike comes.
The following are the release dates of some of the indicators mentioned above in 2022. There may be risks of changing the market at key time points, so please take it yourself.
2022 Overseas Macroeconomic Calendar

3. Internal indicators - consensus within the circle
In terms of internal factors, we mainly split the indicator system from the fundamentals and the transaction layer, which can be divided into on-chain data indicators and off-chain data indicators. There is a lot of information that can be interpreted. In this article, we only select some representative interpretations. More comprehensive indicator interpretations will appear in future articles.
1. Fundamentals of BTC
pricing factors
There are three main factors in the pricing of Bitcoin: cost, network value and scarcity, corresponding to three pricing ideas:
Analogous to the "cost pricing method", the cost of mining is considered, that is, the shutdown price of the major computing power pools we often hear, which is relative to the cost price of each computing power equipment;
The network value model is used to measure the activity of the network, measured by the price of Bitcoin, the number of users on the chain, the transaction volume on the chain, etc., the most commonly used is the NVT model;
Scarcity Quantification Model, Stock-to-Flow (S2F). The model evaluates and compares precious metal assets such as gold, and believes that the intrinsic value of Bitcoin is built by scarcity. But S2F seems to have lost its focus at the end of 21. Let’s briefly analyze:
S2F is a Bitcoin price prediction model given by PlanB, an encryption researcher from the Netherlands, in 20 years: from the halving of output in 2012 and 2016, BTC prices follow theThe price bubble caused by scarcity, and then returned to fluctuate around its S2F price.
The S2F model isQuantification of scarcity, it should be noted that what it gives is a value regression line, which is neither a bottom support nor an extreme high point. However, as BTC is traded and deployed as an asset, macro factors are increasingly influential, and scarcity should not be the only point of obsession. For example, this time PlanB predicted that Bitcoin would hit the $100,000 mark by the end of 2021, but it did not materialize. The crazy rise that a bull market should have has not occurred. The reason is probably that ordinary people do not have good expectations for the economy, and there is no surplus food to pull the market, and the sentiment of retail investors has not been fully activated.
Therefore, it is necessary to combine changes in the external economic cycle to judgeTime point of value return。
adoption
Data Sources:woobull.com, 2010-2021
adoption
In addition to the core scarcity, whether it can be adopted by more people and then circulated is also a compulsory course for currency. According to Chainalysis data, Crypto's global adoption index (Adoption Index) in 2021 has increased by 7 times compared with last year, and emerging markets (Southeast Asian countries) have the most prominent acceptance of Bitcoin.
Crypto Global Adoption Index Change Trend
Geographical Distribution of Crypto Acceptance

Image source: Chainalysis
2. Transaction layer: Recognition of intrinsic value in the general environment
Market microstructure: revealing "class positions"
This section mainly analyzes the relationship between the behavior of holders with different net worth in the market microstructure and the BTC price from the perspective of currency holding balance. According to the currency holding balance, in the following analysis, we will simply divide the holder into:
Retail (0.001-0.1 BTC)
Middle class (100-1k BTC)
Giant Whale (1k-10k BTC)
Super Whale (10k-100k BTC)
Because users with different net worth have different influences on the market, different levels of professionalism, different information they have, and different sensitivity to the cycle, which in turn has different reference significance for us to predict bull and bear.
1) retail investors
Balance 0.001-0.01 BTC address holdings vs Balance 0.01-0.1 BTC address holdings vs BTC price

Data source: OKLink, 2016.1-2021.12
In the figure above, from January 2016 to December 2021, two bulls and bears have been crossed, and the fluctuation of the number of coins held by retail investors basically follows the law of the currency price, and the reduction of holdings lags behind the decline of the currency price, which is of little reference value.
2) Super Giant Whale
Balance > 10 BTC address holdings vs balance > 10000 BTC addresses vs BTC price

Data source: OKLink, 2016.1-2021.12
It can be seen that BTC super whales do not seem to be so sensitive to the bull-bear cycle, or they do not have a strong consensus on the price trend. Before the bull market peaked in 2018, there was a trend of reducing holdings, but the overall increase in holdings at high points is somewhat incomprehensible. in this cycleWithdrew earlierAt present, no signal of price prediction has been observed from the behavior of super giant whales.
3) middle class
image description
Data source: OKLink, 2016.1-2021.12
In the bull-bear cycle before and after the BTC price peaked in 2018, we can see that addresses belonging to the "middle class" holding 100-1000 BTC began to reduce their holdings before the peak of the bull market. However, at the bottom of the bear market, we continued to reduce holdings, and there was no consensus on the bottom of the market. After the start of the 20-year bull market, it was relatively"Hindsight", It started to erupt in February 21. In general, the middle class as a whole has a slightly stronger judgment on the cycle than retail investors, but it is not very meaningful to judge the bull-bear cycle.
In February 21, the number of >100 addresses and the number of BTC held by the middle class diverge, indicating thatHigher net worth whales may start to withdraw from the >1000BTC echelon.
4) giant whale
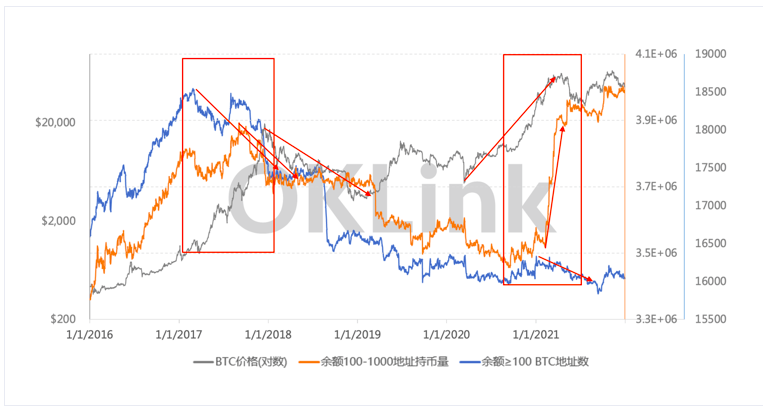
image description

Data from: OKLink, 2016.1-2021.12
Since addresses with more balances have lower appetite for risk, the time to reduce their holdings is earlier, which is what we saw in 2017 and 21. The giant whales reduced their positions earlier than the middle class. At the bottom of the bear market 18 years later, when the giant whales and the middle class continued to sell off, they continued to accumulate money. In February 21, they began to reduce their holdings. Before 519, there was another wave of holding reductions. It can be seen that the giant whale's judgment on the bottom is very firm and consistent, and the top shipment is very smart, which belongs to the Smart Money of this cycle.
In the rising cycle of 2020-2021, the giant whales of 1k-10k BTC are the backbone of this round of rising, and they have predicted the top in advance.middle relay, Retail investors contribute the final strength to the top.To sum up, the 1k-10kBTC giant whale is more sensitive to the bull-bear cycle, and has obvious cycle prediction value.
Market Sentiment: Are You Smart Money?
The four stages in the market cycle

The chart above depicts the different stages of the bubble in the market cycle, which reflects the entry crowd and market sentiment at different stages. In the "Stealth Phase" (Stealth Phase) not many people talk about it, smart money is accumulating low-priced chips. As prices began to "take off", institutional investors saw market opportunities and gradually entered. After gaining the attention of the media and the public, driven by FOMO sentiment, a large amount of retail funds entered the market, early investors or giant whales began to withdraw steadily, and the bubble entered the final stage of "mania". After the withdrawal of the last batch of smart money funds, market buying could hardly support the selling pressure, and the bubble burst.
The social volume (Social Volume) in the figure below counts the number of times Bitcoin-related feature lexicons appear in various social media (Telegram, Reddit, etc.), and the positive sentiment (Positive Sentiment) reflects the views on "Bitcoin" in the network (optimistic/negative). We can judge the different phases of the price cycle based on market sentiment. Of course, there are other indicators that reflect market sentiment, such aswait.wait.
image description
Data source: Santiment, 2019.12-2021.12
Supply and demand relationship: how much do you know about the exchange stock
image description
Data source: OKLink chain master, 2020.5-2021.12
In the figure, the balance of BTC at the exchange address and the price of BTC are the same most of the time.negative correlation trend. The reason is that as the price rises, investors are bullish in the medium term and will transfer the BTC in the exchange out of the cold wallet. On the contrary, when investors are bearish, they will put theirLow priced chips exchanged for dollars, cash out, that is to say, what we often sayLarge transfers from exchanges,formshort-term selling pressure。
A similar indicator is ASOL. ASOL is the ratio of each UXTO spend to the "UTXO" from the last transaction to the transactionlife", and then calculate the average life expectancy (days) in a certain period of time. That is to say, ASOL can reflect the trend of "old-money" and "new-money" during this period as a whole. If ASOL is high, it means Long-term currency holders start trading, which is usually a harbinger of market changes.
image description
Data source: OKLink, 2019.2-2021.12
Although we only listed a few sporadic indicators among the many indicators on the chain, in general, the reaction of the transaction layer is actuallyThe degree of recognition of intrinsic value under the general environment trend is the exposure of trading behavior under the trend and expectation.Regardless of on-chain or off-chain, at the transaction level we want tobehavior and emotionsInvestors who see different characteristics in the marketexpected, makeMore deterministic trend judgment。
summary
In 2021, driven by ample global liquidity and anti-inflation demand, the market's risk appetite is high, and cryptocurrencies have benefited a lot from it.
In the medium and long term, given the size of Bitcoin's market capitalization, it has been difficult to really get out of its own independent market. will definitely be affected by the marketeconomic environmentexpected andoverall moodimpact, and the asset positioning of BTC determines thiswhat a judgment or emotion says about it. hikeandandactualThe rate of interest rate hikes and the trend of the inflation rate will determine the consensus outside the circle of bitcoin's risk asset attributes and inflation hedging attributes next year.
Returning to Bitcoin itself, we hope that Bitcoin'sIntrinsic values such as decentralization and scarcityCan get affirmation inside and outside the circle. And pay attention to the entry and exit signals released by the trading layer, and draw your own cycle judgment from the behavior and sentiment of the market.


