KingData: Nine sets of data charts to understand whether the Bitcoin bull market is over
The following content data comes from KingData, please indicate the data source as KingData for reposting and citation. KingData uses data to empower transactions, one step ahead to meet wealth.
The following content data comes from KingData, please indicate the data source as KingData for reposting and citation. KingData uses data to empower transactions, one step ahead to meet wealth.
"Is this the beginning of the end of the Bitcoin bull market?" To find the answer, you need to understand the origin of this bull market and use data to objectively prove whether the logic supporting the bull market is still there. Below we use 3 sets of numbers to understand the origin of this round of Bitcoin bull market.
1. The cause of the bull market
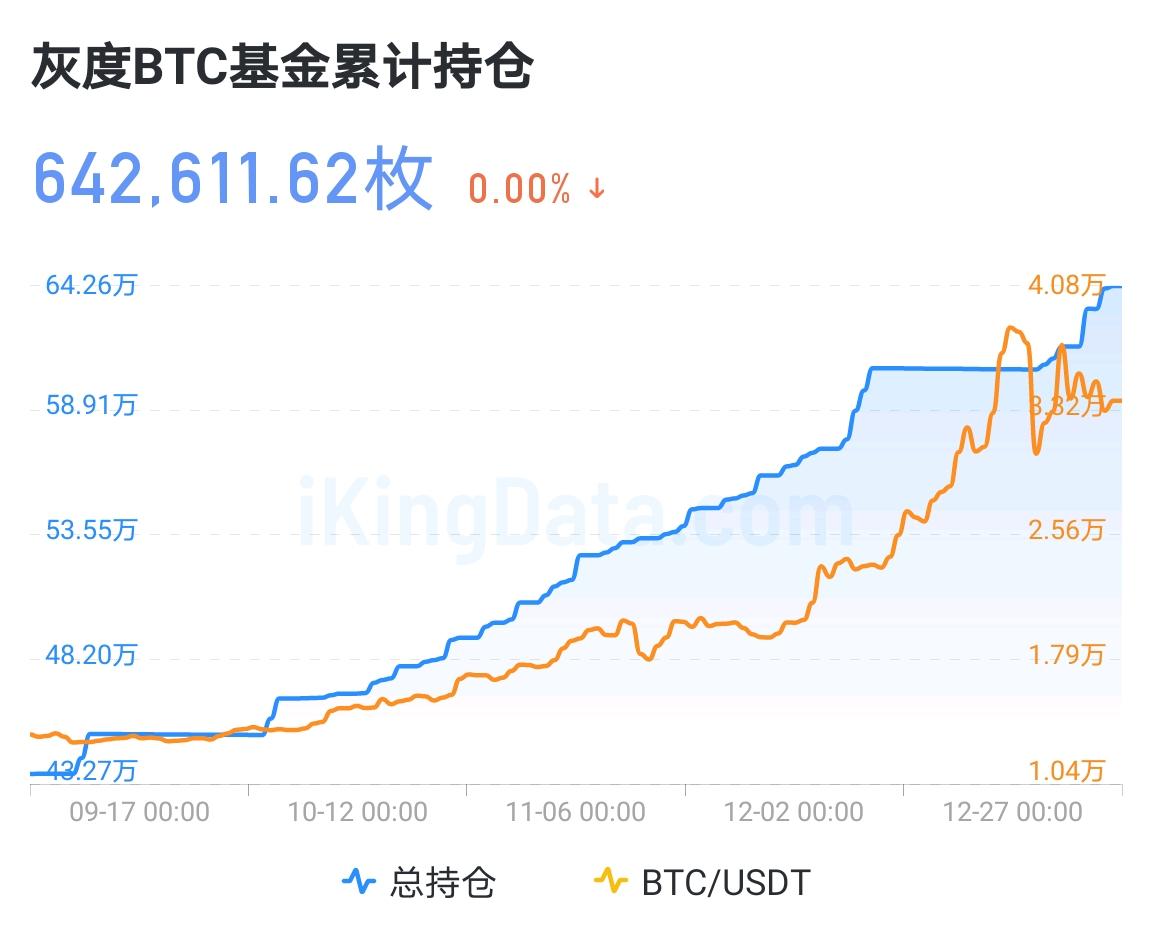
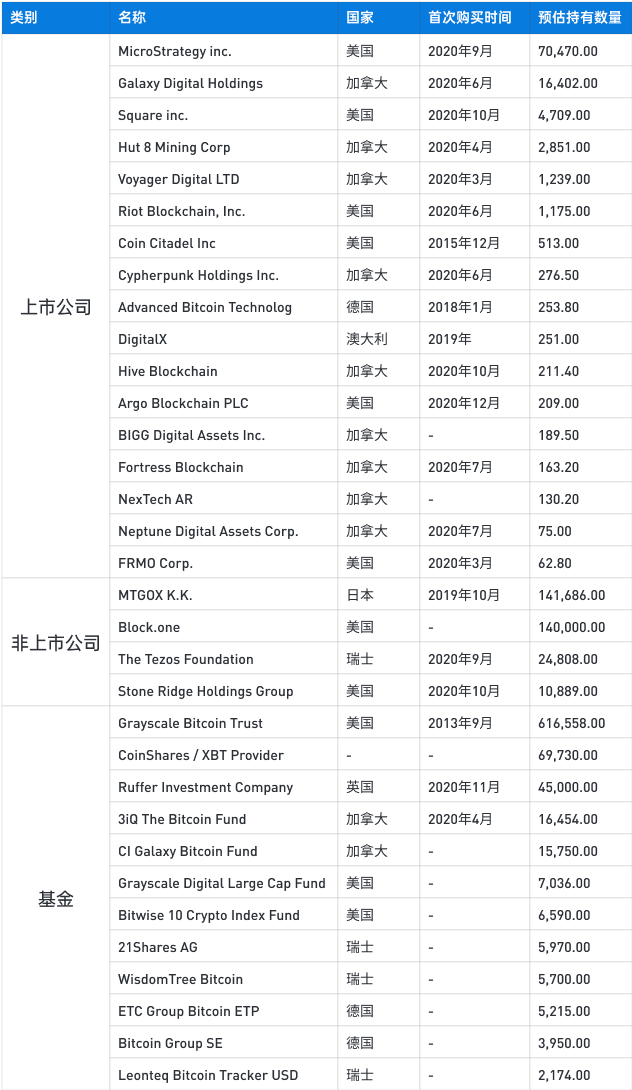
image description
Figure 3: List of bitcoin holders
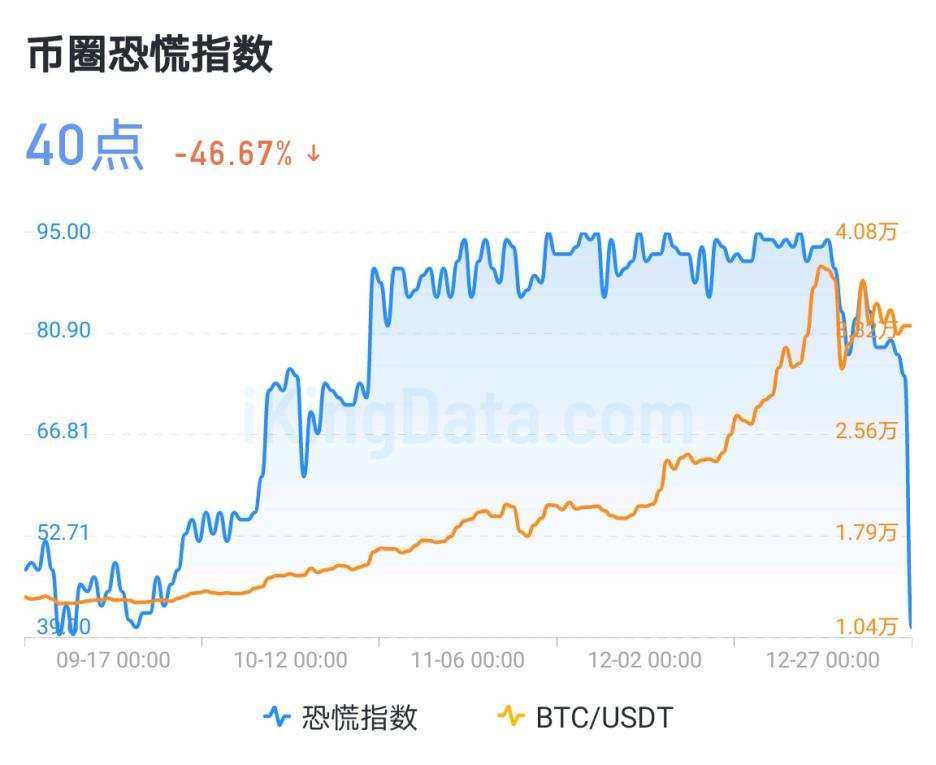
From the charts of "Cumulative Holdings of Grayscale BTC Fund" and "Daily Increase and Decrease of Grayscale BTC", we can see an obvious positive correlation between the price of BTC and the increase in Grayscale holdings. The higher the price of the currency. Of course, Grayscale is not the only fund and institution that increases its holdings of Bitcoin.
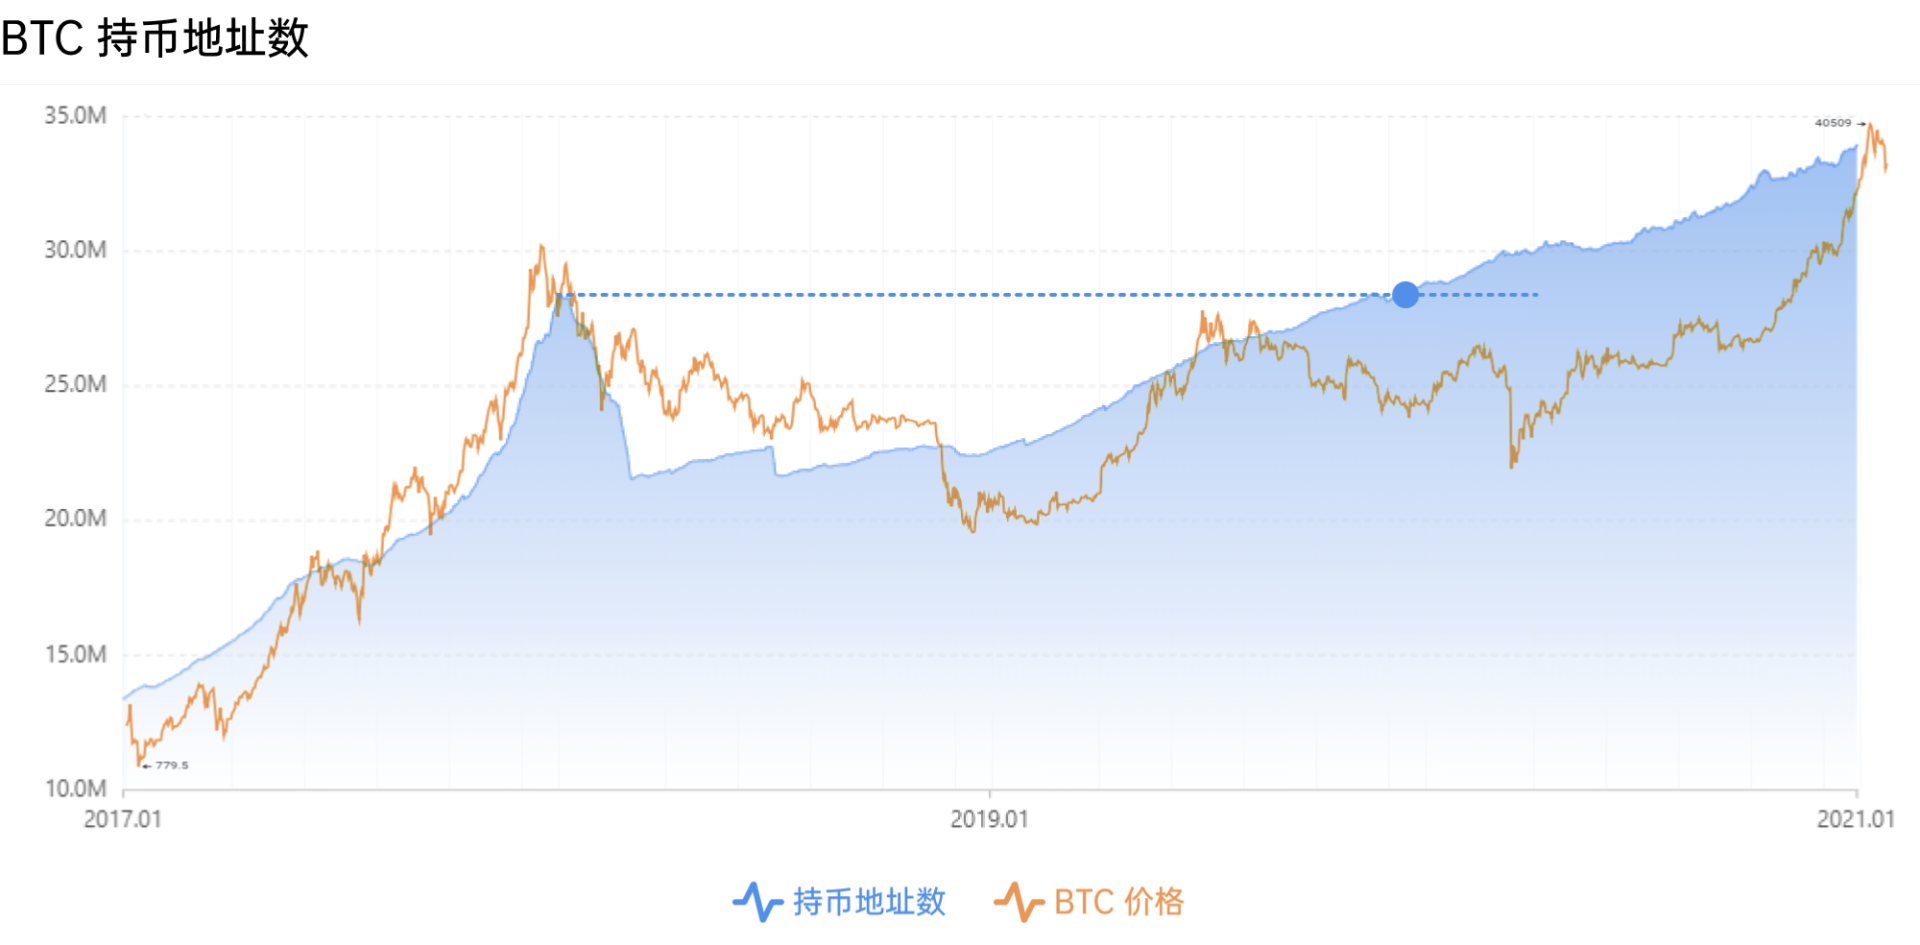
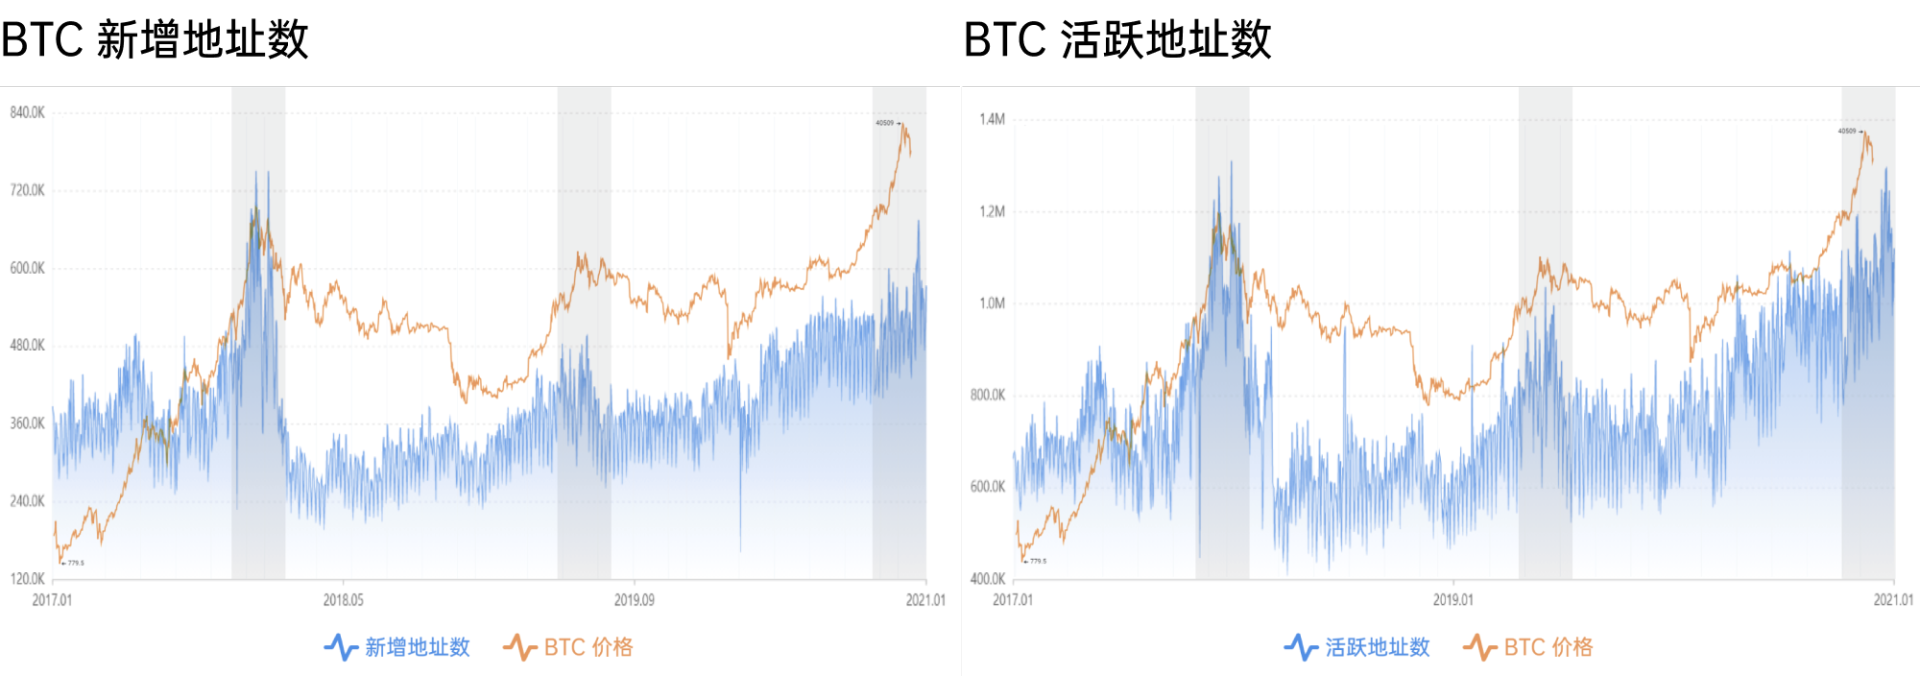
From the trend chart of "Number of Bitcoin Holding Addresses", we can see that in February 2020, the number of BTC holding addresses hit a record high, and the high point of near-currency holding addresses was in January 2018, which was exactly the last round of BTC bull market 2 million dollar end. From this point of view, the number of BTC holding addresses or one of the leading indicators of the start of the bull market has a certain predictive effect. The continuous growth of "the number of BTC holding addresses" may indicate the continuous increase of long-term holders, among which there are unavoidable figures of above-priced investment institutions.
secondary title
2. Is the bull market over?
If the cause supporting the bull market is still there, then the result will inevitably appear. If institutions and funds continue to increase their holdings of BTC is the cause of the Bitcoin bull market, will the increase in holdings of these institutions change?
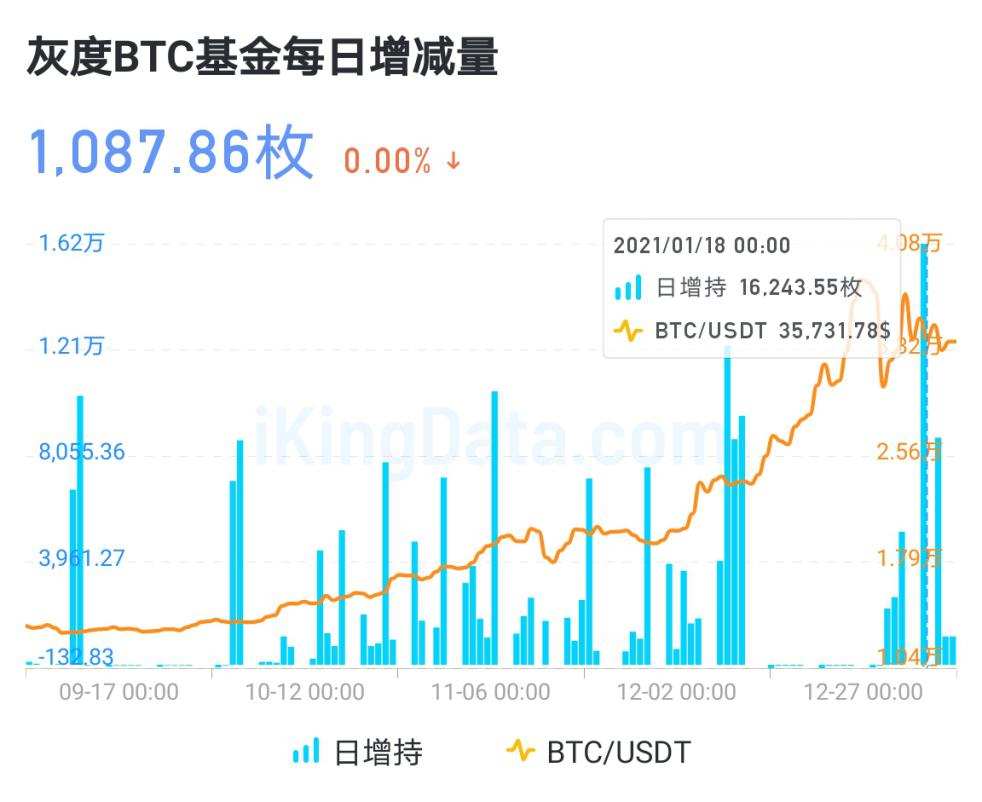
Judging from the data of Galaxy, which holds the largest number of BTC among institutions, after half a month of rest, Grayscale started to increase its holdings again in mid-January. Compared with the height of the column chart, the increase in holdings has not weakened , of which the highest single-day increase in holdings was 16,200 BTC.
According to news reports, several new Bitcoin funds are preparing to enter the market. Judging from the existing data trends, the purchases of institutions and funds are still continuing and have not weakened significantly. We can preliminarily judge that the bull market is not over yet. So will there be more objective data evidence in the data on the BTC chain?
We have seen that the number of active addresses on the BTC chain and the number of newly added addresses did not hit a record high with the price, and did not show a vertical explosive growth at the end of the bull market. This is obviously not in line with the data performance at the end of the bull market, or the market emotional display.
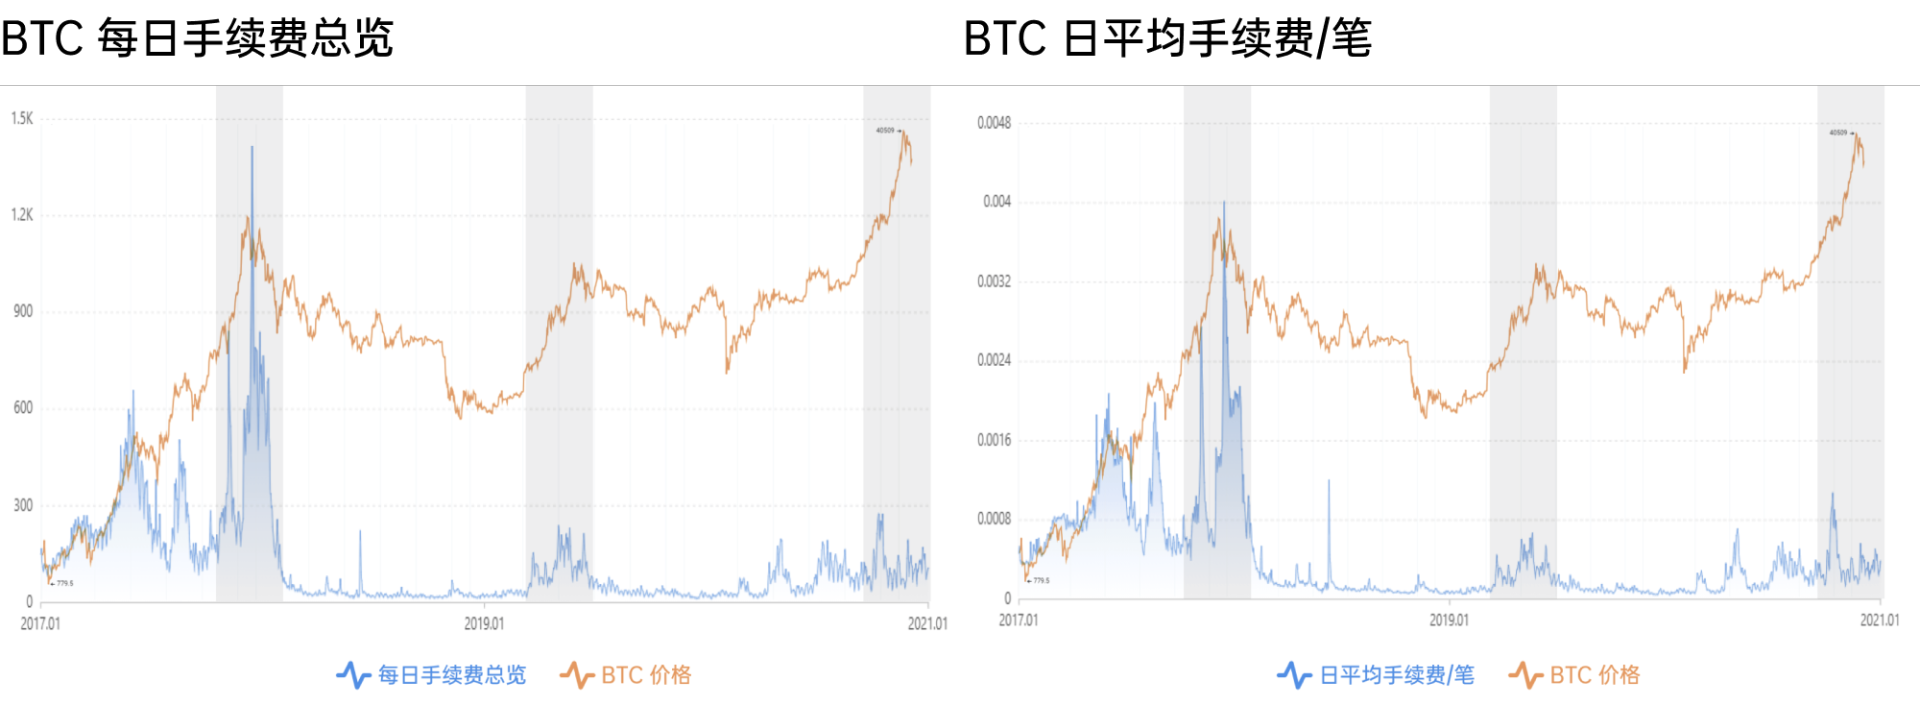
From the historical trend graphs of "daily handling fee" and "daily average handling fee/transaction", it can be clearly seen that at the end of the BTC bull market in 2017, the transaction activity on the chain was extremely high, and a similar phenomenon also appeared at the end of the BTC bull market in 2019 . In the context of the current BTC hitting a record high, these two sets of data failed to reach a new high simultaneously, and are close to the 19-year data. Although the structure of the retail bull market in 2017 is different from the structure of the current institutional bull market, if it is the end of the bull market, the data changes generated by market sentiment should exceed 19 years, and form a short abnormal growth phenomenon at the end of 17 years.
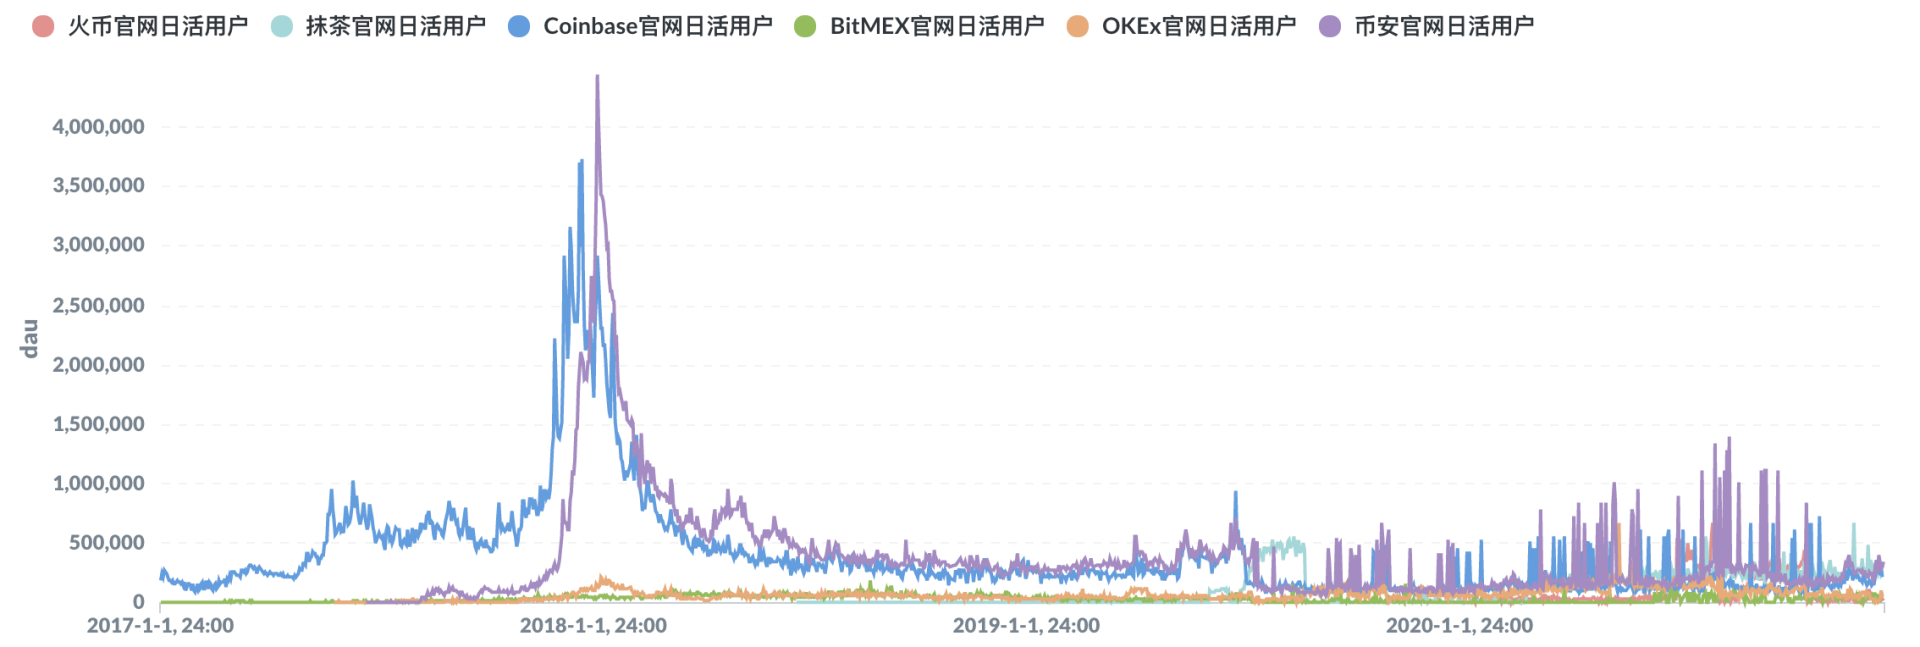
image description
Figure 9: Trend of daily independent IP visits of each exchange
On the whole, although the price of BTC has broken through a record high, active users in the industry have not made a breakthrough, and the overall level has returned to the level at the end of 2017.
Based on the analysis of the above nine sets of data: no signal of the end of the BTC bull market has been seen, and the current decline is highly likely to be a phased adjustment.https://ikingdata.com