






Macro Weekly Report (8.14): A busy week with a lack of additional positive factors.


Although the market rose at the beginning of the week, as of Fridays close, the SP 500, Nasdaq The Dak Index and Russell 2000 Index fell for the second consecutive week, but the decline slowed down from the previous week. The Nasdaq 100 fell for two consecutive weeks for the first time since December last year. The Dow Jones Industrial Average fell sharply on Tuesday, but rebounded to end the week higher. The market is currently making radical upward revisions to long-term interest rates. Even if the macro and micro data are good, the market does not buy it because these expectations have been digested.
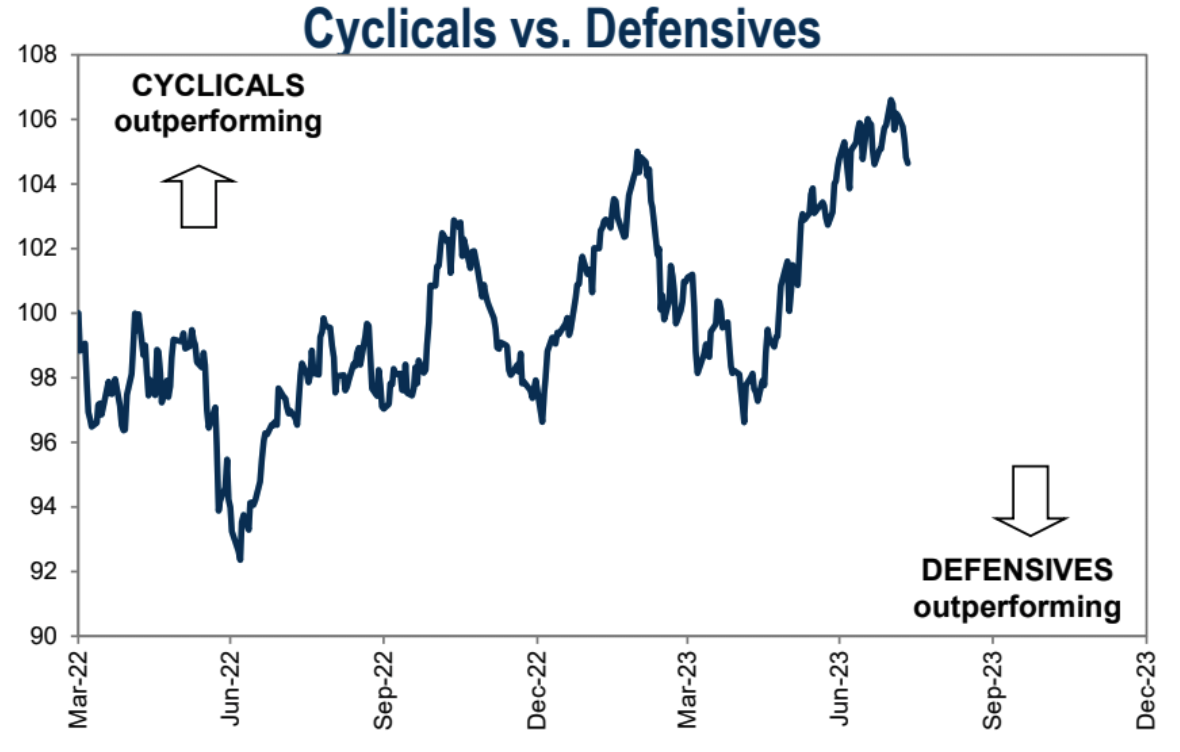
The focus now is on whether the rally in big tech stocks will drag the broader market lower if it pares further, or whether other stocks will help turn the tide.
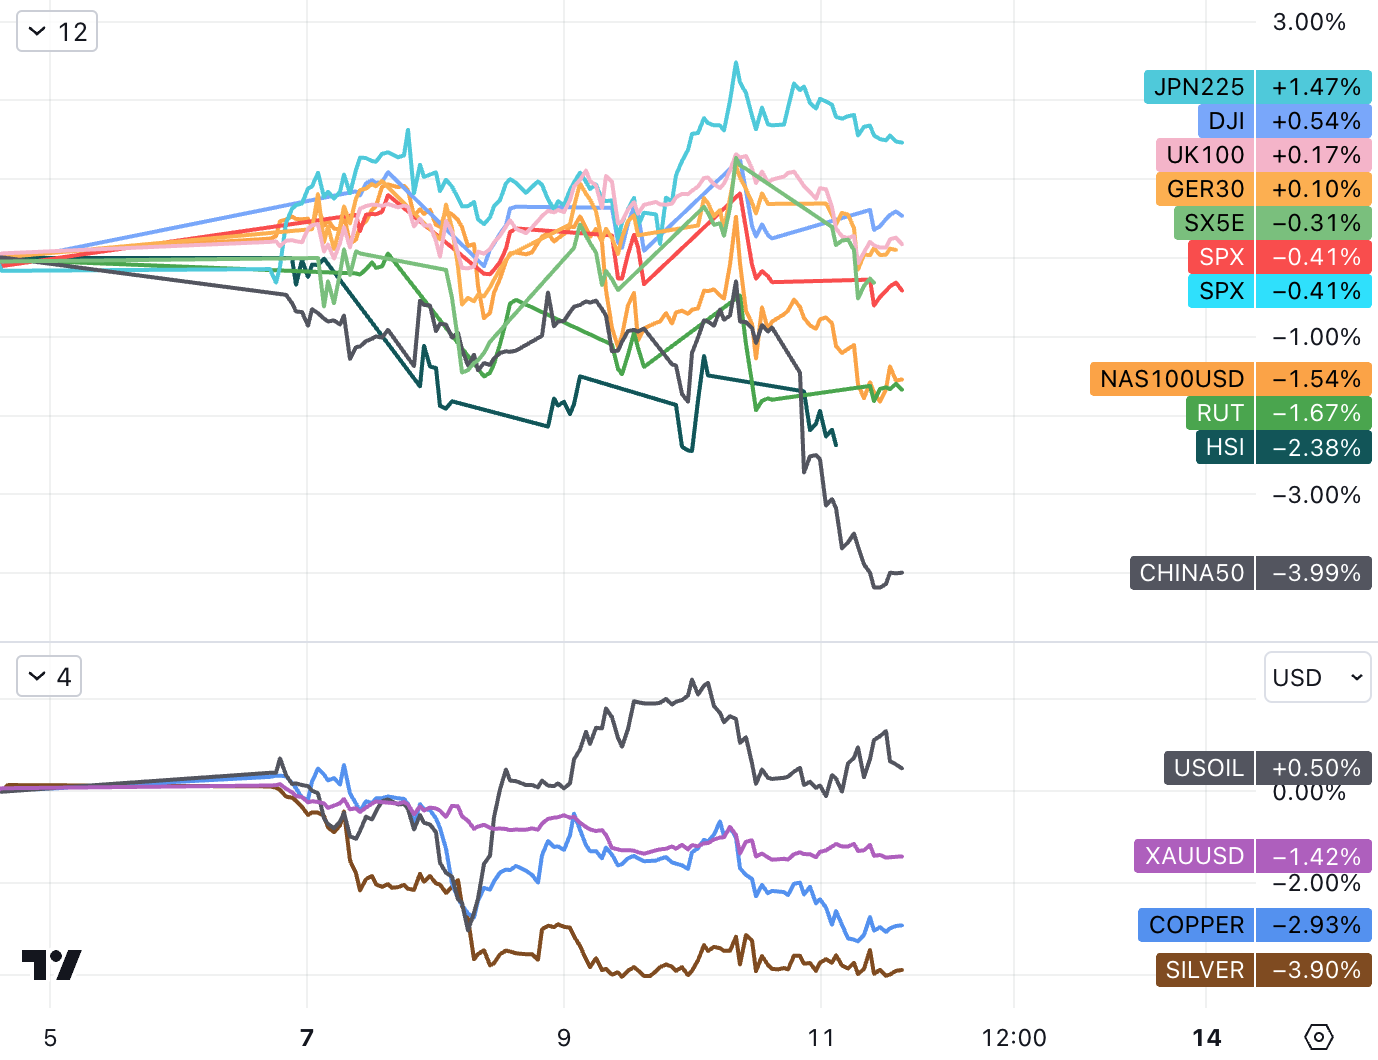
In terms of sectors, in the first half of this year, overbought large-scale technology stocks were particularly weak, while oversold energy stocks rebounded strongly. The SP 500 energy sector has risen by about 10% since the third quarter. As of last Friday, international oil prices had risen for seven consecutive weeks, the longest streak since 2022, with U.S. oil at $83/barrel and Brent at $86.5/barrel.
Regarding whether the AI craze is replaying the Internet bubble of the late 1990s, analysts from some institutions summarize the arguments of two schools of thought as follows:
Analysts who are positive about this round of rebound believe that this is obviously different from the bubble period, and AI-related companies are at the forefront of technology that will change society in the next few years. While tech stock valuations are a key concern, AI is propelling the tech sector into a 1995 moment, with future growth not seen since the 1990s.
Skeptical analysts see the current market boom as one of hype and false hope, warning that the tech rally is just a bubble. As previous boom-and-bust cycles in tech stocks have shown, picking the few companies that could end up dominating a given industry in the long run is much harder than it might seem.
Overall, the market has already priced in a lot of good news, including better inflation trends, a possible pause in Fed rate hikes, and continued above-trend economic growth. The market correction is currently looking healthy and allows the market to digest recent gains. Get ready for a potential move higher.
Historical data shows that since 1950, the SP 500 has risen by more than 15% 35 times. On average, a rally is followed by at least one pullback within six months. These pullbacks ranged from -2.5% to -19%, with an average of -8.2% and a median of -7.6%. Currently, the SP 500 is down only about 3% since its recent high on July 31.
In other markets, with the depreciation of the yen, Japanese stocks rose 1.47%, European stock markets fluctuated sideways, British and German stock markets closed slightly higher, Stoxx 50 fell 0.3%, Chinese stock markets were the worst performers due to the cliff drop of social financial data, A 50 It fell 4%, the Golden Dragon Index fell 6.55%, and the CSI 300 fell 2.9%.
Bond Market
U.S. Treasury yields of all maturities have roughly returned to levels prior to the release of the U.S. non-farm payrolls report last Friday. The 10-year U.S. Treasury note rose about 12 basis points this week, rising for three weeks in a row. The 2-year U.S. bond yield, which is more sensitive to the outlook for interest rates, has risen by about 13 basis points this week, erasing an 11-basis-point drop last week and climbing for the second week in five.
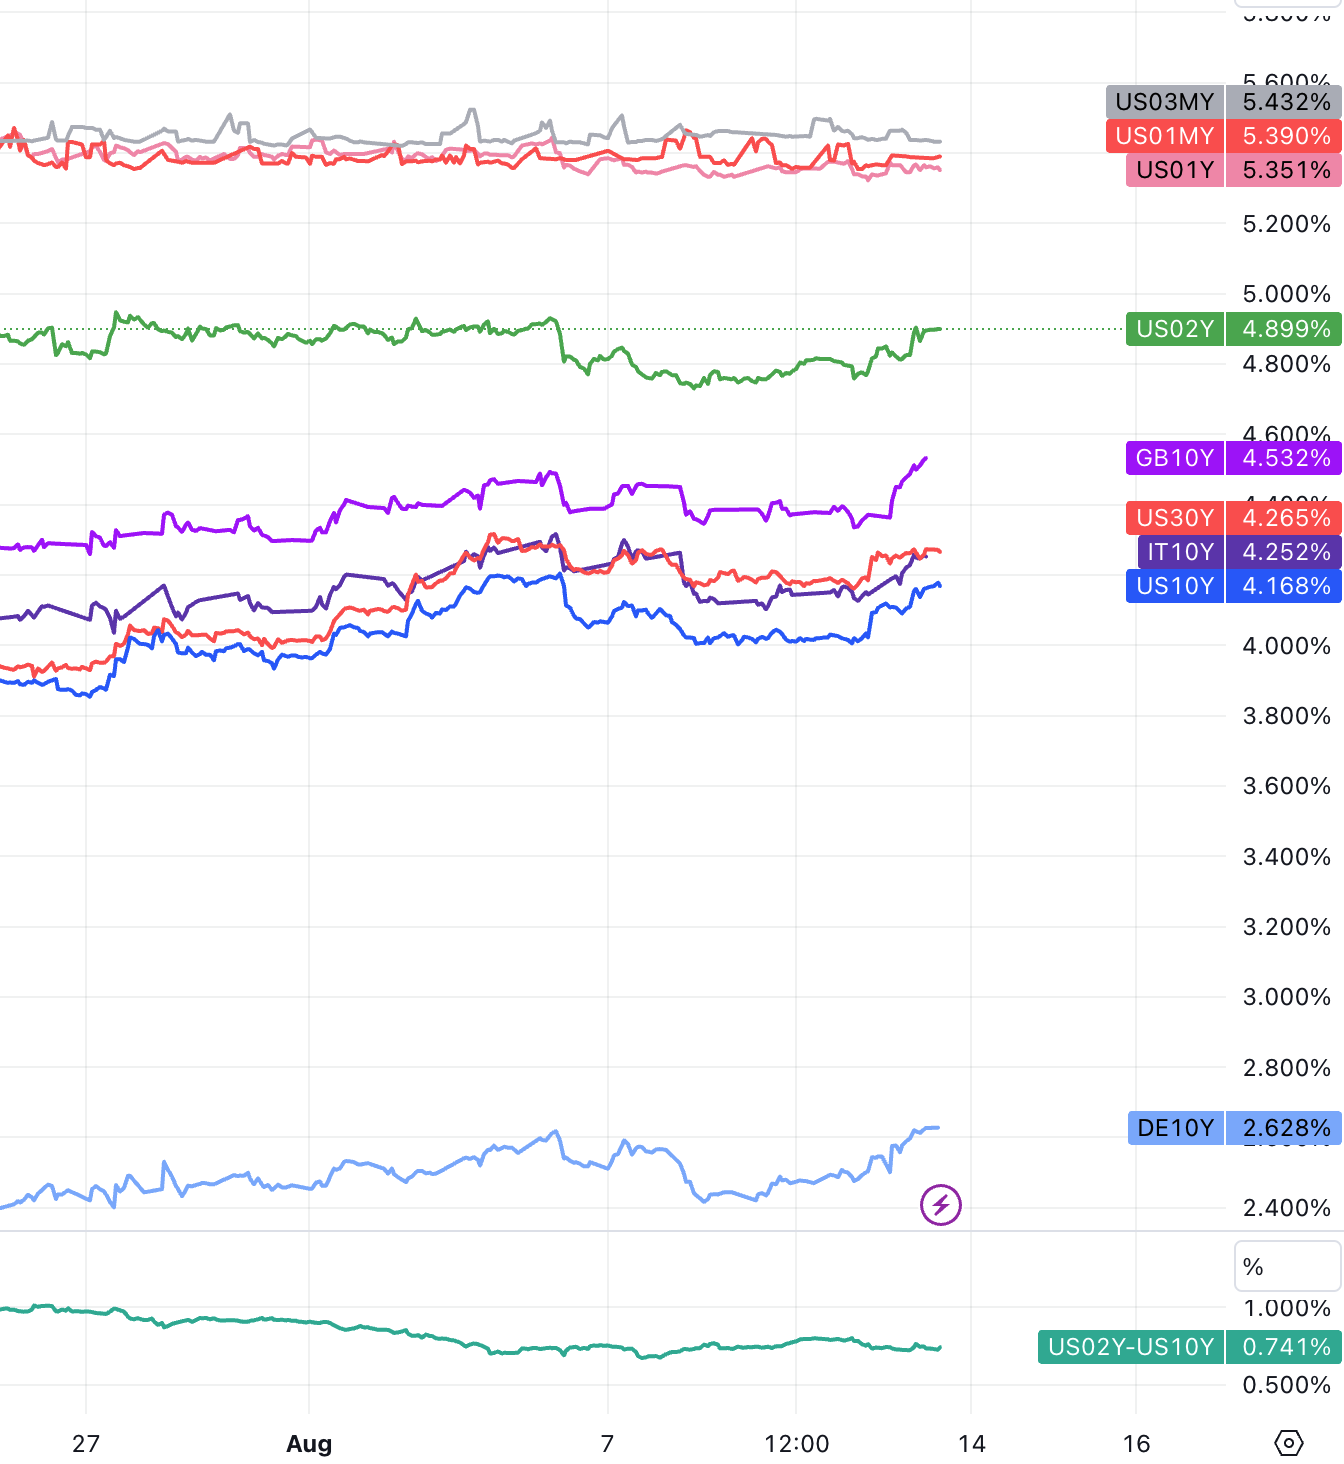
The U.S. 30-year Treasury Inflation-Protected Securities (TIPS) yield is infinitely approaching the 2% mark. A breakthrough would be the first since 2011, and countless bond investors are waiting with bated breath. Some of the upward pressure on TIPS and long-term nominal U.S. Treasury yields reflects high market uncertainty about the path of inflation. Although inflation expectations released this week and inflation indicators from surveys fell.
exchange rate market
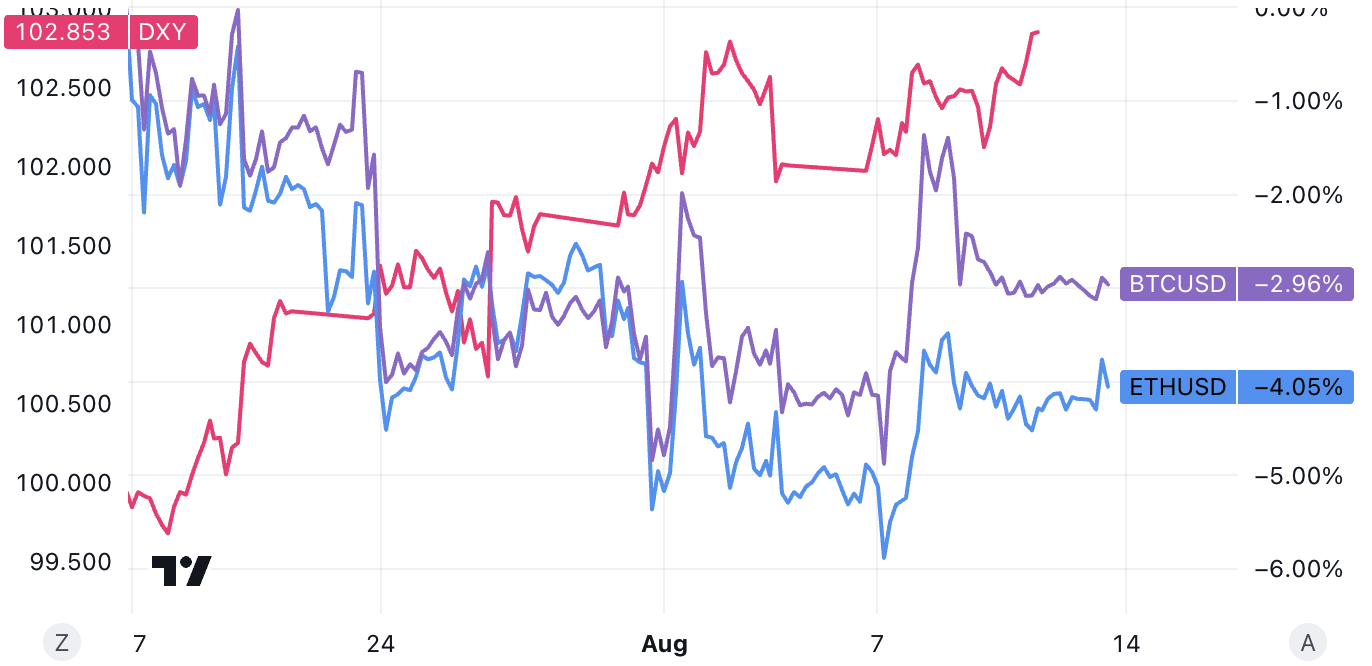
The U.S. dollar index stands at 102.80, up about 0.8% last week and extending its fourth straight week of gains. Among non-U.S. currencies, the Japanese yen performed poorly, falling against the U.S. dollar for five consecutive days. On Friday, it reached 145.00, the threshold for Japanese government intervention in the foreign exchange market in September last year. The offshore yuan was trading at 7.2601 against the U.S. dollar, falling 722 points last week and falling for two consecutive weeks.
The digital currency once rose sharply in the middle of next week in anticipation that the ETF may pass, but was eventually suppressed by the strong US dollar and the rise in US bond yields. Above the mark, while the traditional market is slightly pessimistic, the performance has been relatively strong in the past two weeks.
Spot gold fell 1.49% throughout the week to $1,913 an ounce, the largest weekly drop since June 23, falling for three consecutive weeks, and falling more than 1% a week in the last two weeks.
Review of hot events
inflation expectations
On Thursday, U.S. inflation in July, measured by the consumer price index, was 3.2%, slightly lower than market expectations. Core inflation, which excludes energy and food, rose 0.2% this month, unchanged from June. The 0.2% month-on-month increase in core CPI for the second consecutive month was a positive sign that price pressures are easing, a development that could lead the Fed to consider a pause in rate hikes, but a rebound in energy prices suggests that slowing inflation is not all plain sailing either.
In this data, commodity prices such as used car prices (-1.3%) and furniture and home appliances (-0.4%) continued to fall, air ticket prices (-8.1%) fell sharply for the second consecutive month, and hotels (-0.5%) Lower prices for services such as rentals and car rentals (-0.3% ) have played an important role in containing core inflation.
However, fuel oil (+ 3.0%), gasoline (+ 0.2%), and natural gas services (+ 2.0%) all rose in July, and global oil prices have continued to rise since August, which may indicate that energy prices in August will rise further month-on-month. There is a risk of inflation rebounding upwards.
Since late June, oil prices have continued to rise due to production cuts by Saudi Arabia, Russia and other countries. JPMorgan currently forecasts that oil prices could hit $90 by September as supply and demand in the spot market are tightening rapidly.
Driven by rising service industry prices, the U.S. July PPI year-on-year growth rate announced on Friday was revised up by 70 basis points to 0.8%, excluding the volatile food and energy indicators. The year-on-year growth rate in July was not as expected. slowed down, but accelerated slightly to 2.4%. The month-on-month growth rates of PPI and core PPI were both slightly higher than expected.
U.S. PPI reflected high inflation stickiness, offsetting the short-term optimism brought by CPI data. After the release of the data, the U.S. dollar index wiped out its losses and jumped up. U.S. Treasury bond prices plunged and yields rose. go lower.
In August, the University of Michigans one-year short-term inflation expectations unexpectedly fell to 3.3%, tying the lowest level in more than two years, and long-term inflation expectations also fell. This months overall consumer confidence index fell slightly from July.
The El Niño phenomenon has been confirmed, and the EU even believes that it will be more serious next year. India has begun to restrict rice exports, which has led to a sharp rise in rice prices in Asia. Now the pressure on the supply side is not only in energy but also in food.
Q2 earnings season
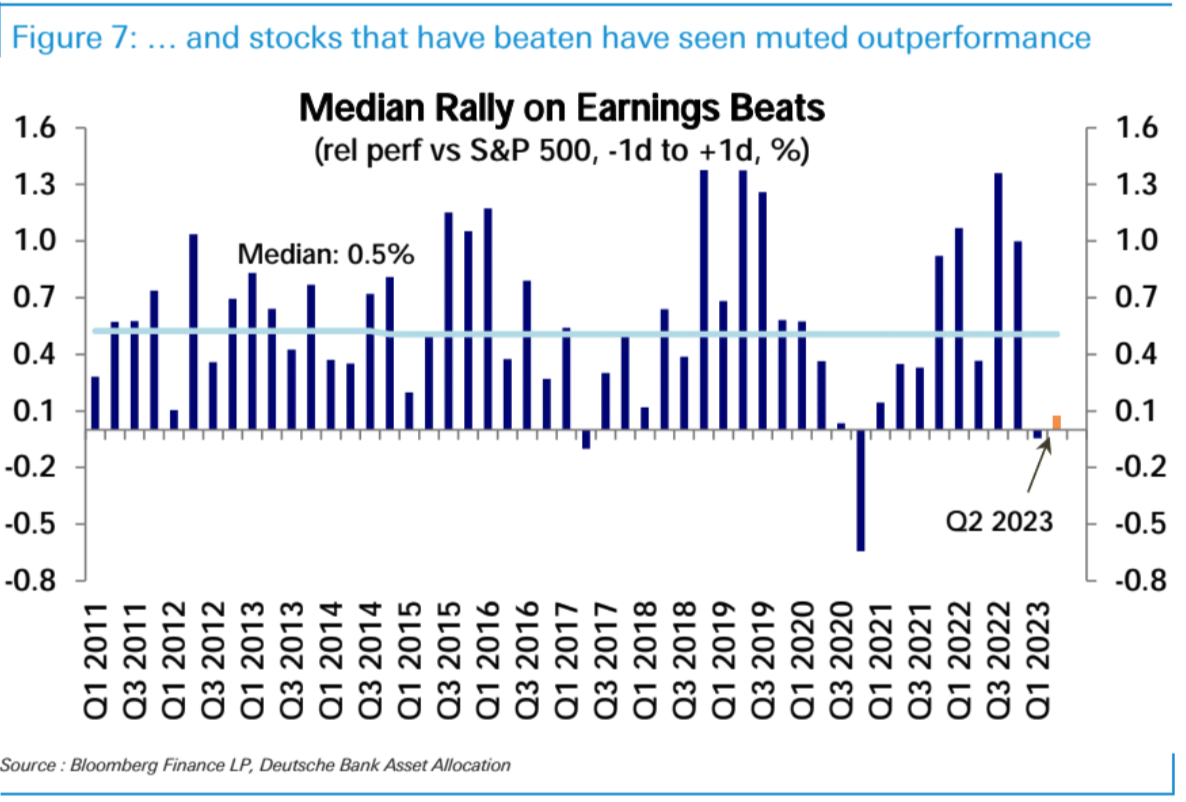
SP 500 second-quarter profits fell 4% year-over-year, down from the 9% decline expected when earnings season began in early July. Both revenue and margins rose. 54% of SP 500 stocks beat consensus EPS estimates by at least one standard deviation. Companies that beat EPS estimates beat SP 500 performance by an average of 0.8% the day after the report.
Moodys downgrades rating
Moodys on Monday downgraded the credit ratings of 10 small and medium-sized U.S. banks and noted that several larger lenders were under review. The rating agencys move reflects the challenges still facing the banking industry, including rising loan costs and declining profitability.
The U.S. debt auction
Last Wednesdays $38 billion 10-year U.S. Treasury auction yielded a seven-month high, with interest rates reaching a seven-month high. Overseas indirect buyers received 72.2% of the bonds, a six-month high, far exceeding the previous auctions 67.7% share. The wave of U.S. debt issuance that hit this week brought surprises, and buyers were not scared away. Following strong demand for Tuesdays $42 billion three-year U.S. Treasury note sale, Wednesdays 10-year U.S. bond issuance saw strong demand rarely seen this year, and overseas buyers swept the goods with alarming intensity.
On Thursday, the U.S. Treasury Department completed a $23 billion 30-year Treasury auction, with the winning rate hitting the highest since July 2011. The bid-to-bid ratio for the auction was 2.42, the lowest since April this year. The results of the 30-year U.S. Treasury bond auction were somewhat unexpected, and the market had expected Thursdays auction to be completed easily. But the result is that the long-dated Treasury auction has faced challenges.
Chinas challenge
Chinas exports fell 14.5% year-on-year in July, the largest decline since February 2020; imports fell 12.5% during the same period. The decline in import and export data released on Tuesday exacerbated the weakening of the countrys economic difficulties. Combined with the previously announced price turn negative, Chinas economy has fallen into deflation for the first time since the epidemic.
Chinas new RMB loans and social financing growth plummeted in July, hitting a new low in nearly 14 years. The scale of social financing in July was 528.2 billion yuan, expected to be 1.1 trillion yuan, and the previous value was 4.22 trillion yuan; M2 money supply in July was 10.7% year-on-year, 11% expected, and the previous value was 11.30%; new RMB loans in July were 345.9 billion yuan, expected 800 billion yuan, the previous value was 3,050 billion yuan. The decrease in credit growth was mainly due to:
Corporate loans decreased by 49.9 billion yuan year-on-year, mainly due to the advance release of corporate loans in June under the guidance of the steady growth policy, which resulted in partial overdraft demand;
Residential medium and long-term loans decreased by 215.8 billion yuan year-on-year, mainly due to weaker mortgage loans and higher repayments; residents short-term loans decreased by 106.6 billion yuan year-on-year, reflecting the slow recovery of credit card and consumer loans.
However, the Political Bureau meeting held at the end of July was aware of the economic predicament. The meeting proposed that the current economic operation is facing new difficulties and challenges, and macroeconomic policy control should be stepped up in the second half of the year to expand domestic demand, boost confidence, and prevent risks. Investors expect that in the future, Chinas supervision is expected to exert efforts across the board in terms of monetary, fiscal, property market and even capital market policies.
Alis 2024 fiscal year Q1 financial report
On August 10, Alibaba released its financial report for the first quarter of fiscal year 2024 (ending June 30). As the first financial report after the spin-off of the six major businesses, these data are not only an explanation of Alibabas quarterly operations, but also a test of the effectiveness of its organizational structure changes.
Alibaba achieved a total revenue of 234.156 billion yuan, a 14% increase compared with the revenue of 205.555 billion yuan in the same period last year; net profit was 33 billion yuan, a 63% increase compared with 20.298 billion yuan in the same period last year. Such data allows the market to once again see the vitality of Chinas e-commerce industry.
However, it is worth noting that international digital commerce has the fastest revenue growth in this quarter. Revenue in this quarter increased by 41% year-on-year. Among them, international retail business revenue increased by 60% year-on-year and orders increased by approximately 25% year-on-year. For Jiang Fan, who was transferred from the Tmall segment three years ago to take charge of overseas e-commerce business, the current operating data has once again verified his ability.
In addition, Alibaba Clouds revenue and profit both increased this quarter. The financial report showed that revenue increased by 4% year-on-year to 25.123 billion yuan, and adjusted EBITA increased by 106% year-on-year. (Adjusted EBITA can more accurately reflect the companys daily operating profitability because it excludes the impact of non-operating expenses such as interest, taxes, depreciation and amortization. A high adjusted EBITA usually indicates that the company has strong profitability Capacity) EBITA is much larger than revenue growth, which may involve cost reduction, improvement of production efficiency, or changes in the companys profit structure.
Consumer Confidence Slumps
US consumer confidence dipped slightly in mid-August after peaking in July, but remains elevated year-on-year. Survey data released by the University of Michigan on Friday showed that the preliminary consumer confidence index fell to 71.2 in August from 71.6 in July, noting that consumers perceived that the economic environment is almost no material difference from last month.
UK Q2 GDP growth beats expectations
UK GDP in the second quarter was +0.4%, which was expected to be only 0.2%. Household consumption and government consumption grew strongly, which gave the Bank of England more room to raise interest rates, leading to violent market turbulence on Friday. After this data was released, British government bonds plummeted, and the British stock index Under pressure, GBP was boosted for a short period of time, and once rose by 100 bp against the US dollar. Prior to this, the market had some doubts about whether the Bank of England could complete this round of interest rate hikes. However, strong economic data has boosted market confidence. However, only the foreign exchange market and the interest rate market have fully reflected it, and the impact on the stock market has been limited. .
Correlation drops
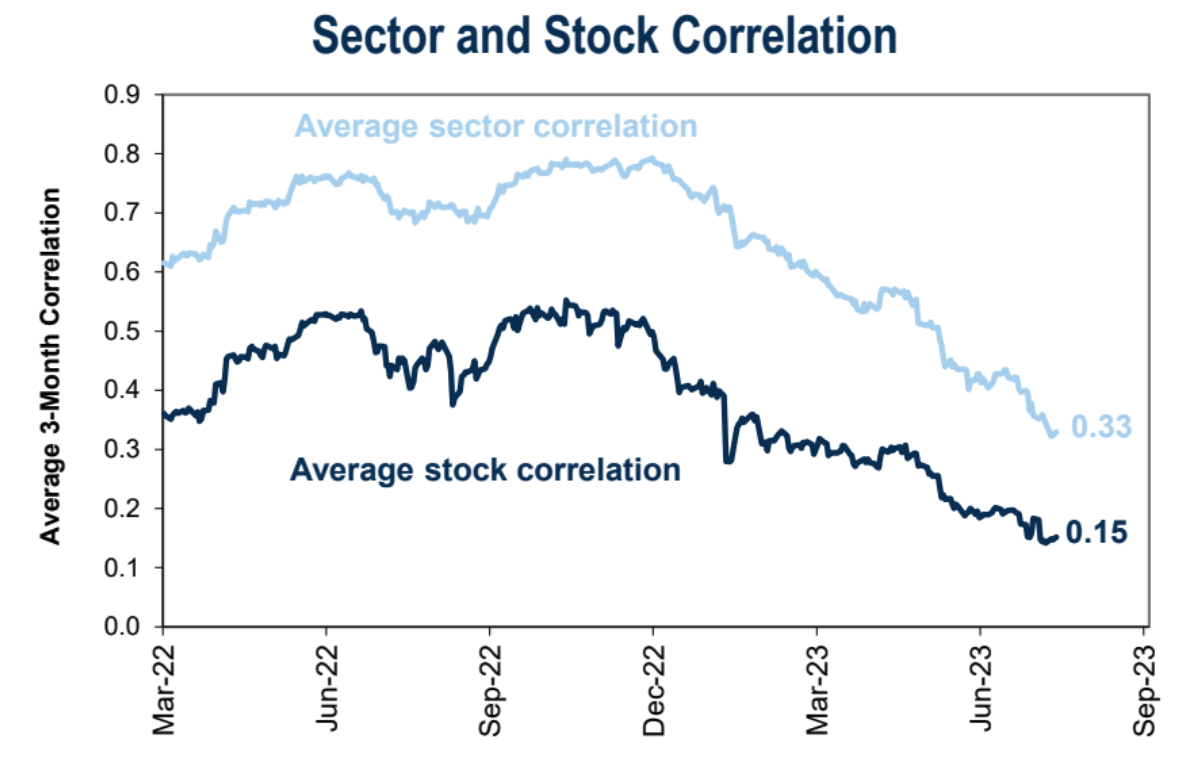
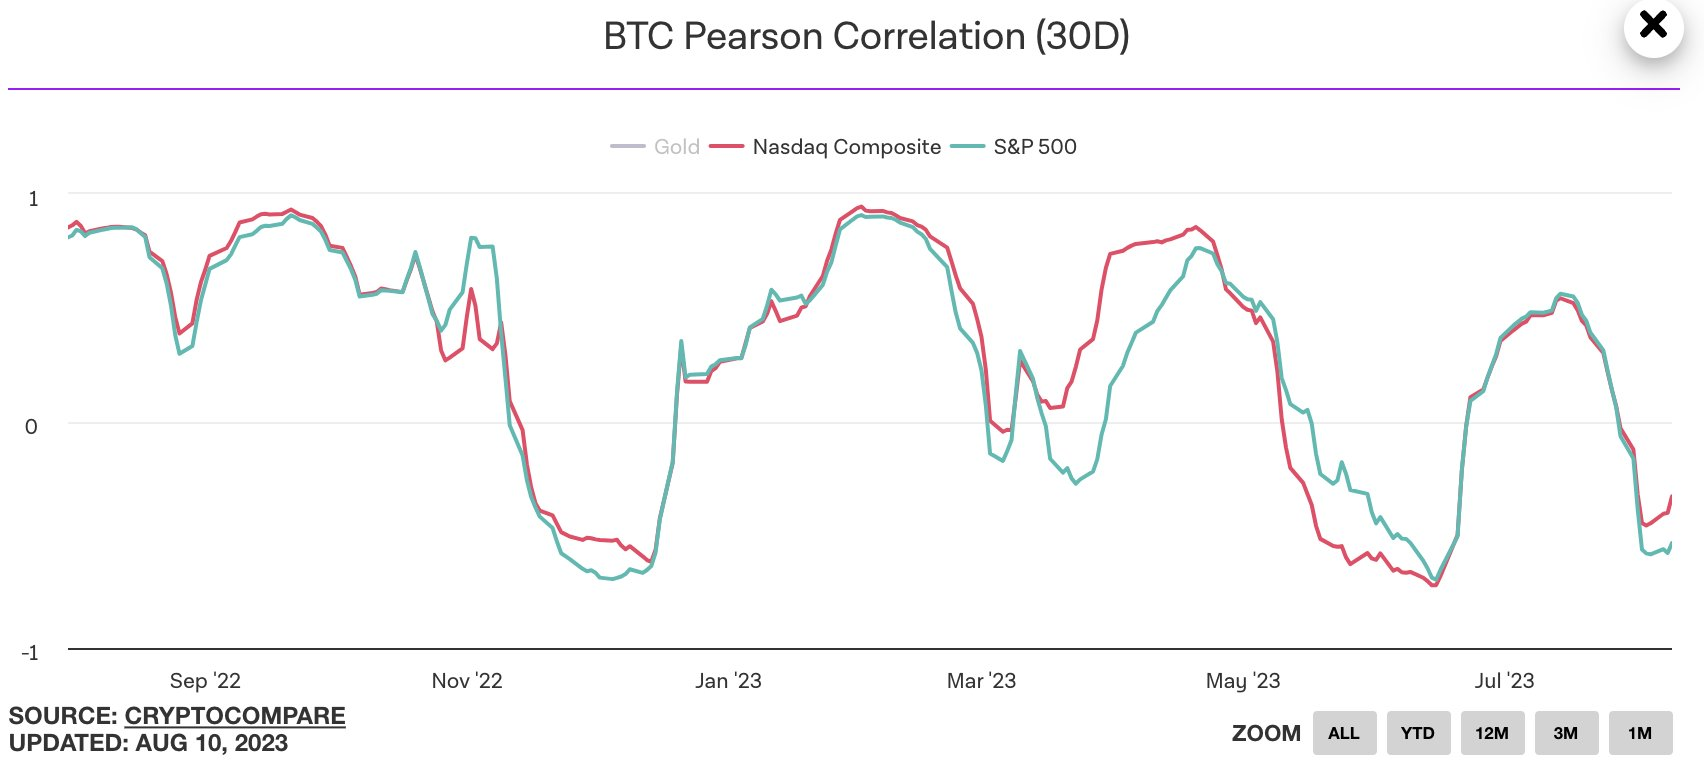
The correlation between digital currencies and stock indexes has hit a low point, and the correlation within stocks has also hit a bottom. The impact of technology and innovation and the uncertainty of global economic and trade trends are the main background reasons.
 Fund position changes
According to Deutsche Banks statistics, in the past three weeks, the overall stock position has continued to decline and is now at a two-month low. This is largely due to a sharp pullback in subjective investor positioning, which has given back more than half of its sharp climb from late May to mid-July and is now close to neutral.
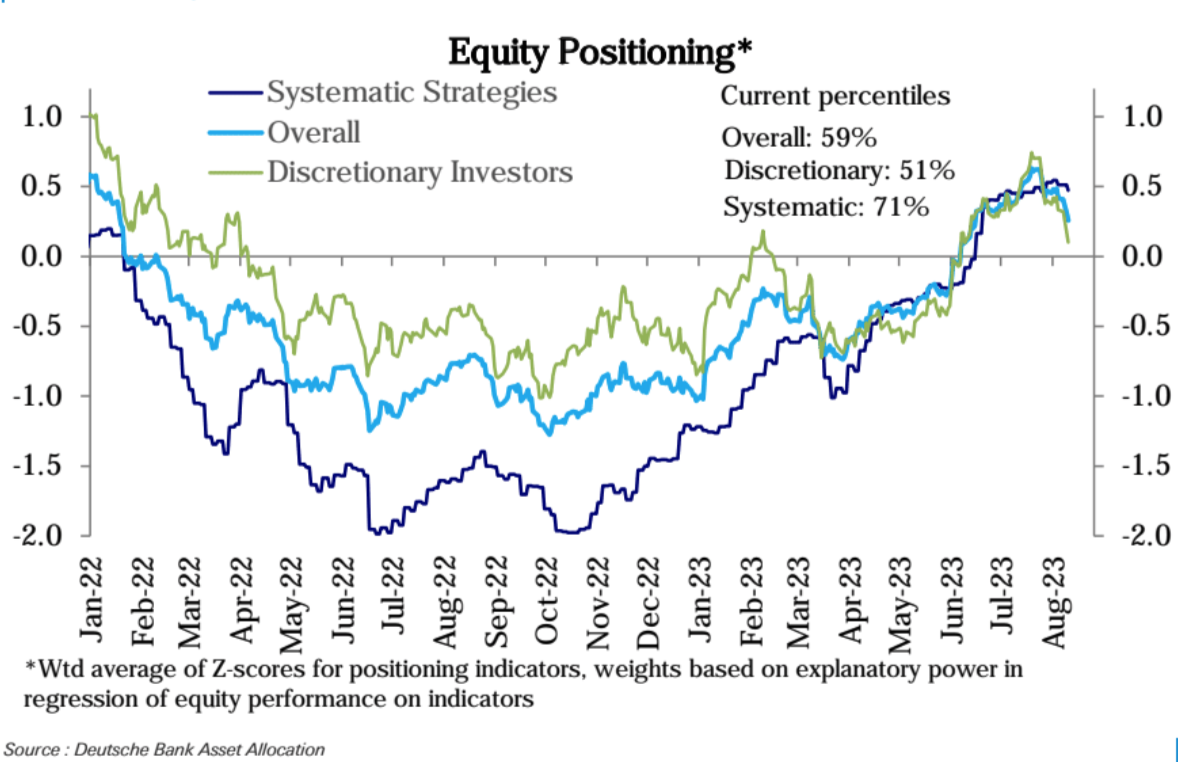
Systemic strategy positioning has been creeping higher since mid-June, and fell slightly last week. Key factors influencing equity positioning are macro data surprises, earnings season and interest rate volatility. Macro expectations have been steadily improving, with higher growth data and lower inflation data, and further positive data surprises have been hard to come by.
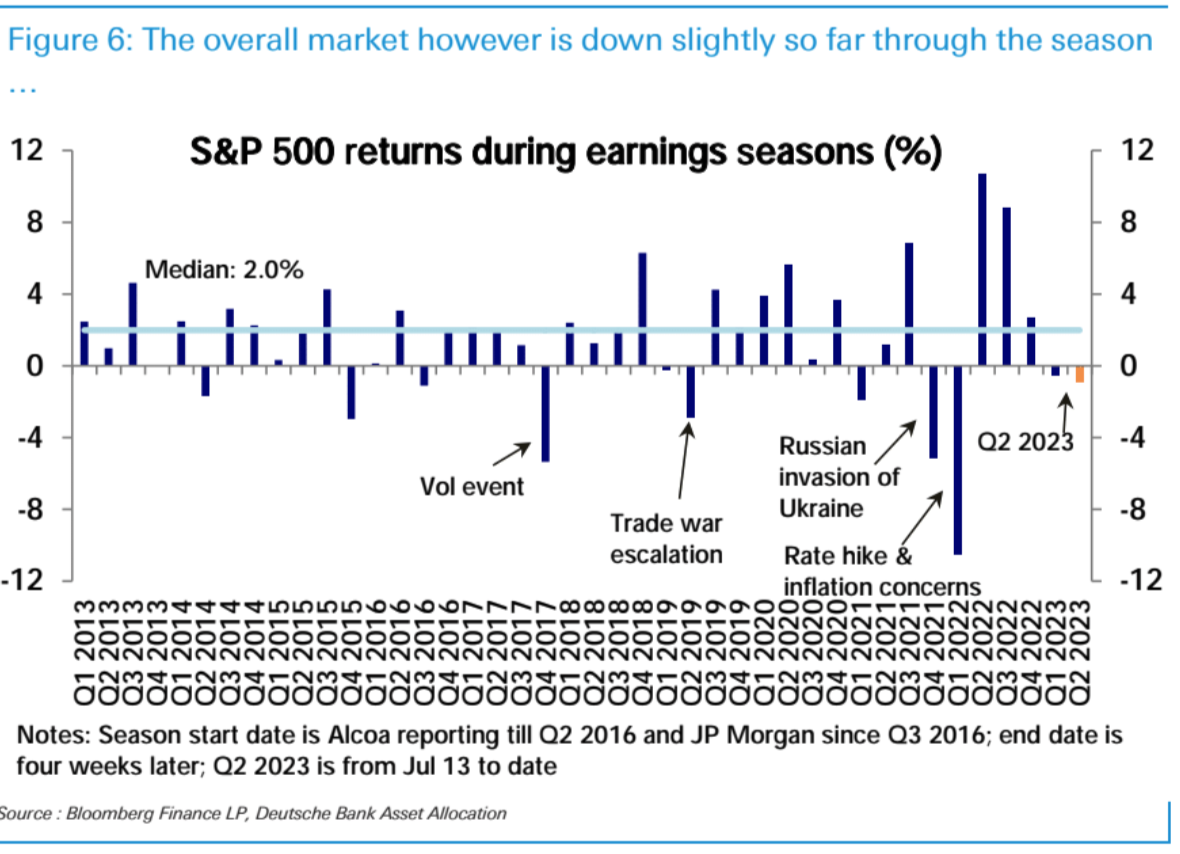
The second-quarter earnings season was strong, with companies beating expectations. However, the overall profit of the market fell slightly after the quarter, and the performance of companies with better-than-expected performance was not outstanding.
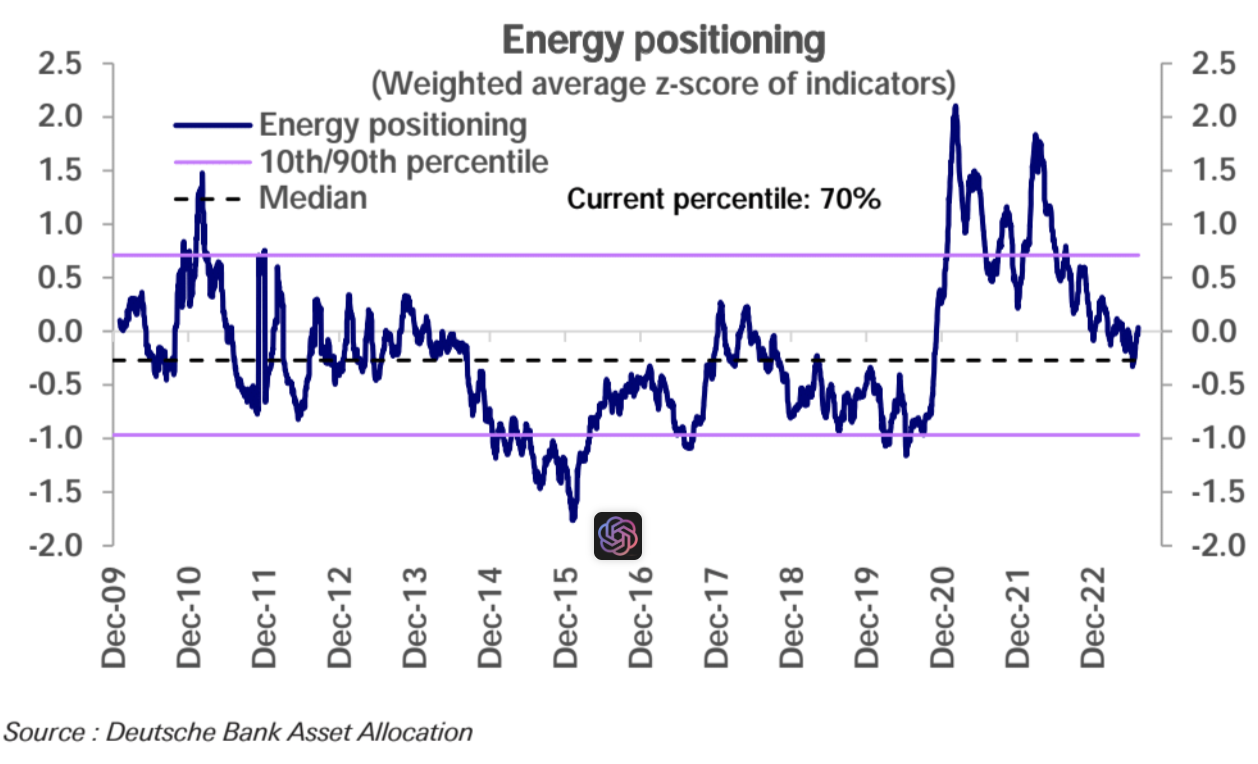
From an industry perspective, the positions of technology, communication services and non-daily consumer goods fell slightly this week, but were at high levels in the historical range. Positioning in consumer staples has risen sharply this week and is now near top levels. Industrial product positions are also rising and are currently entering an over-allocation range. Energy positions have gradually risen to neutral levels.
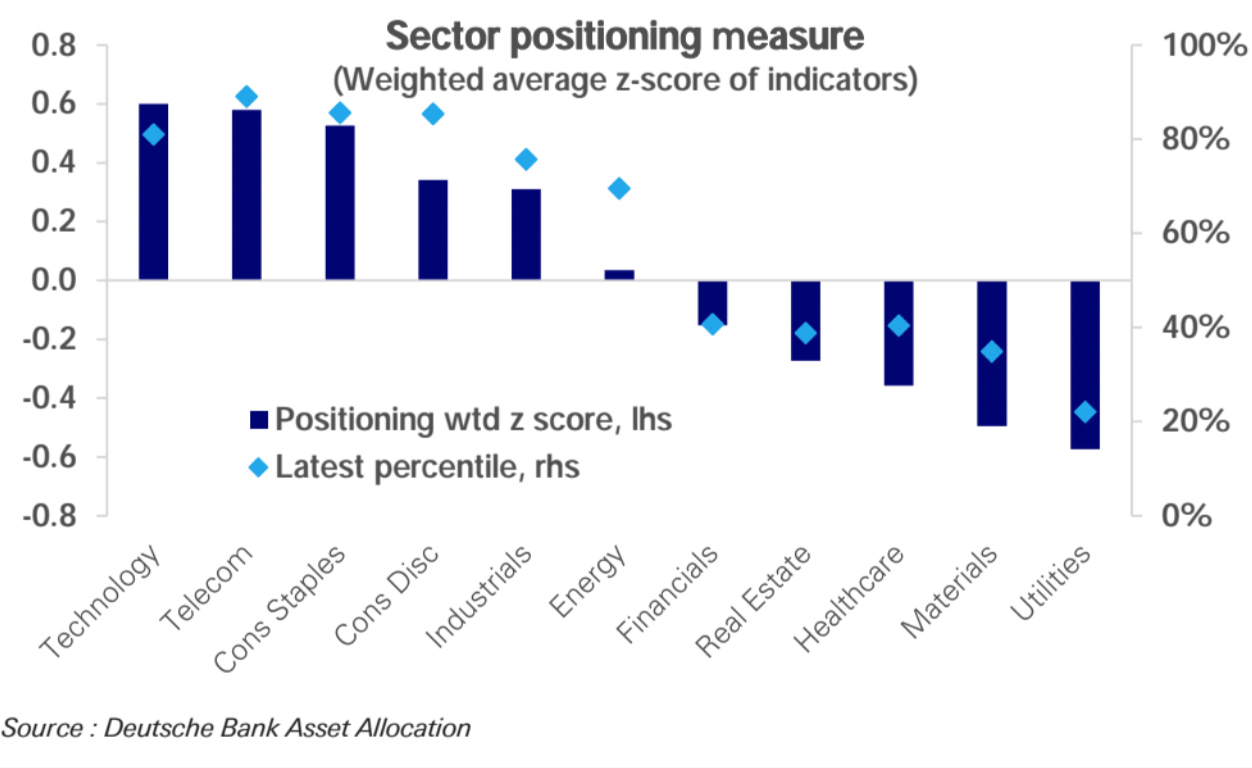
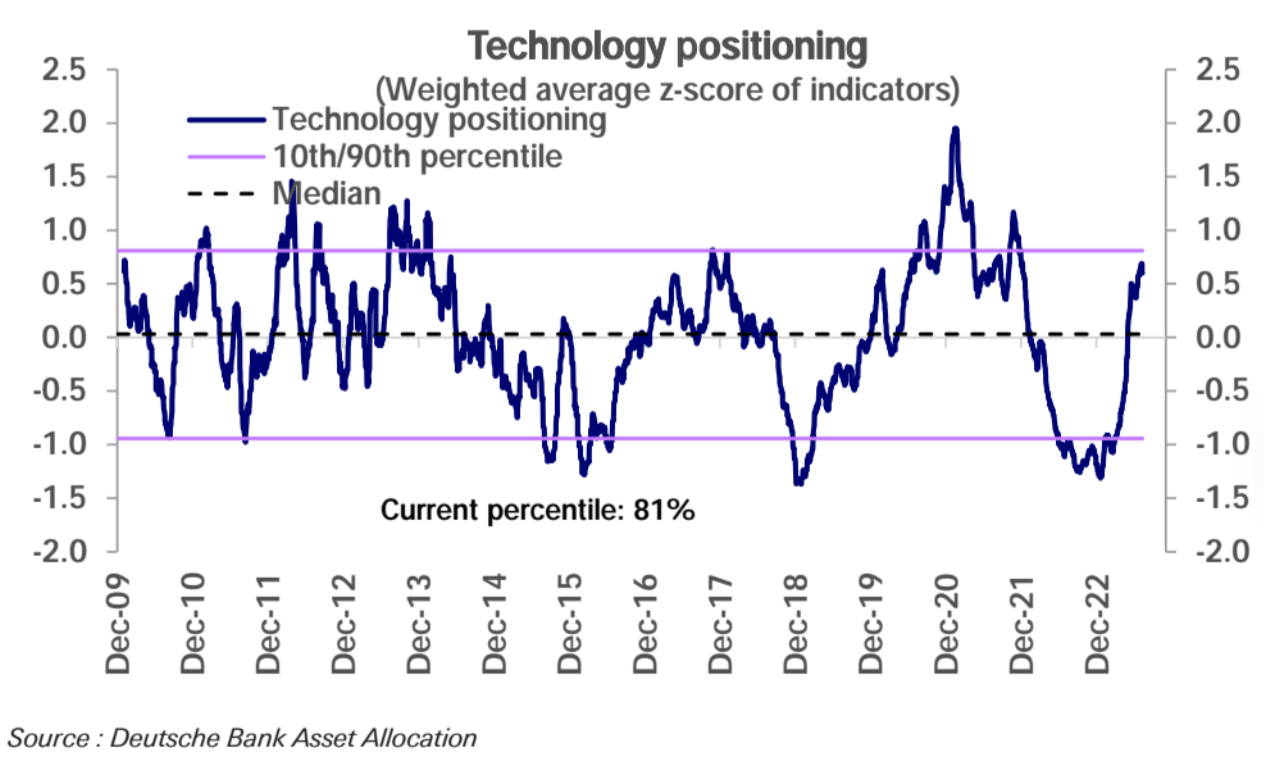
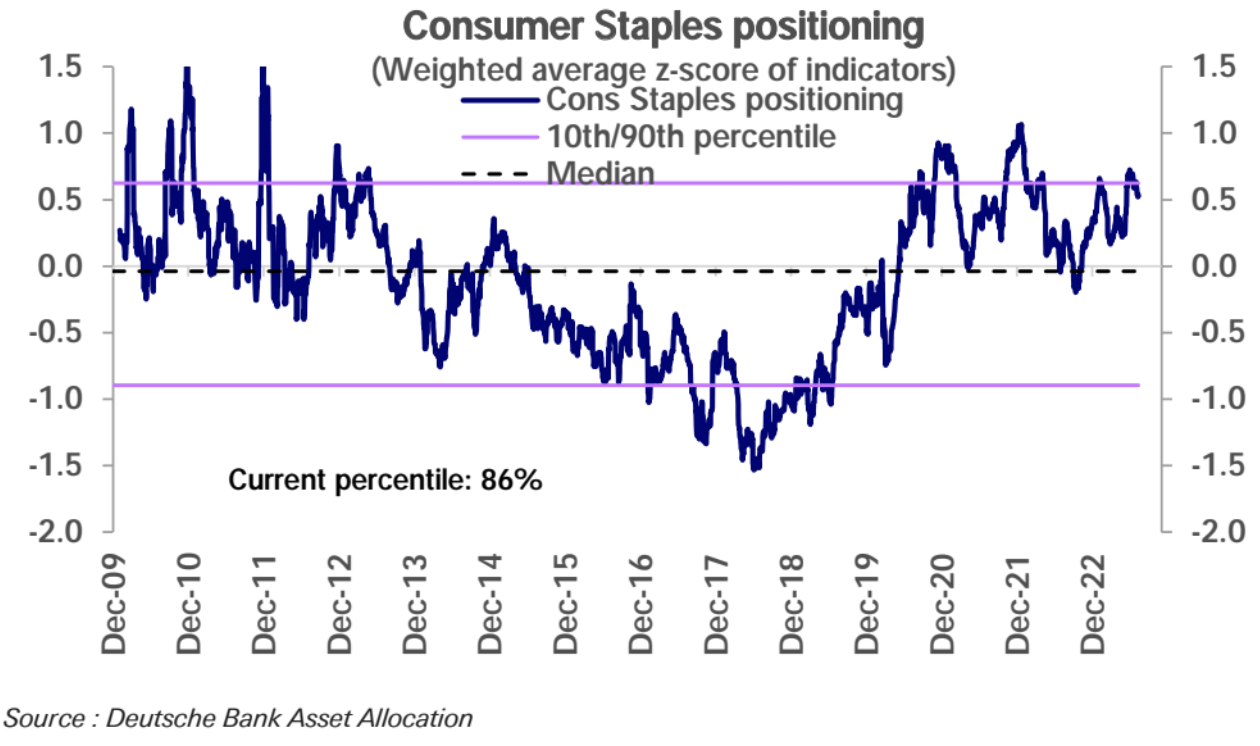
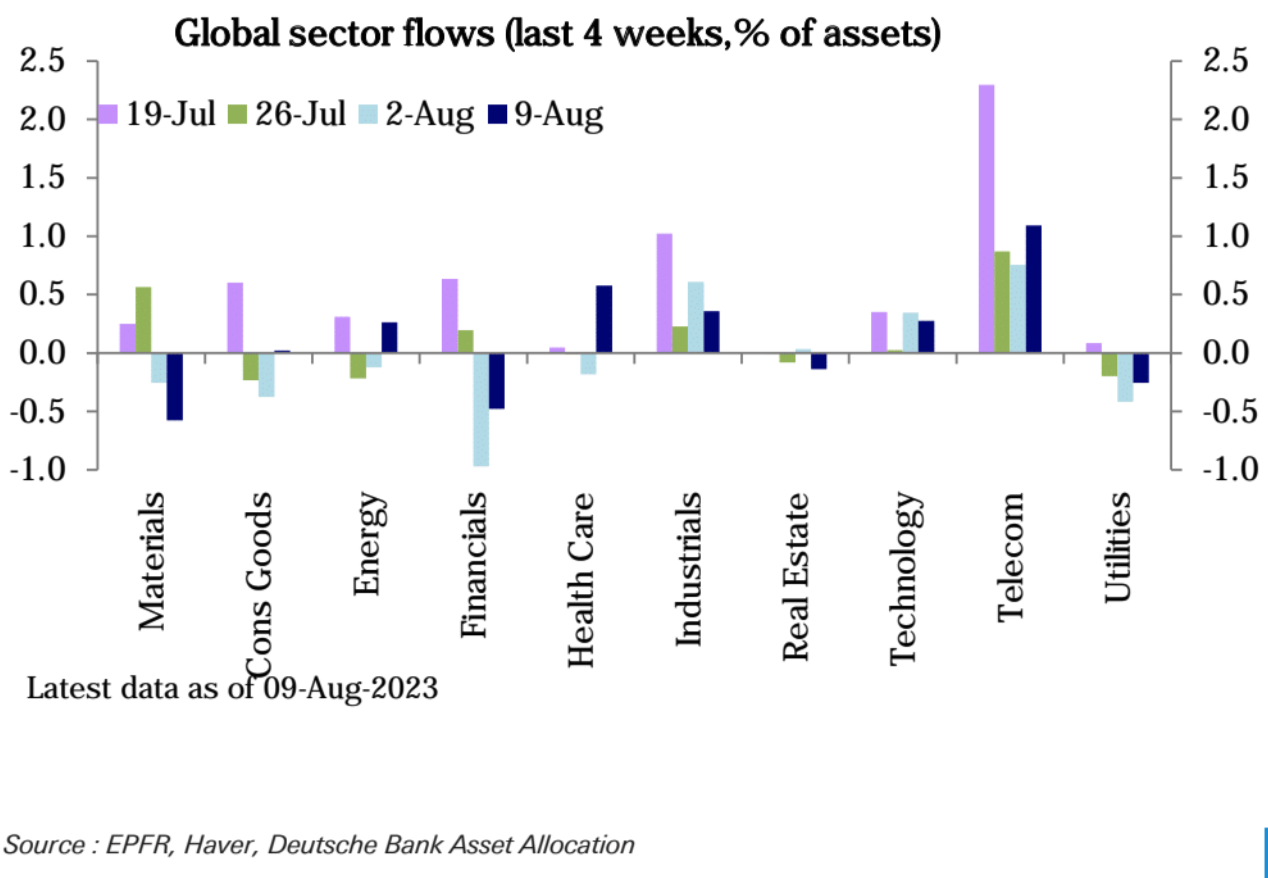
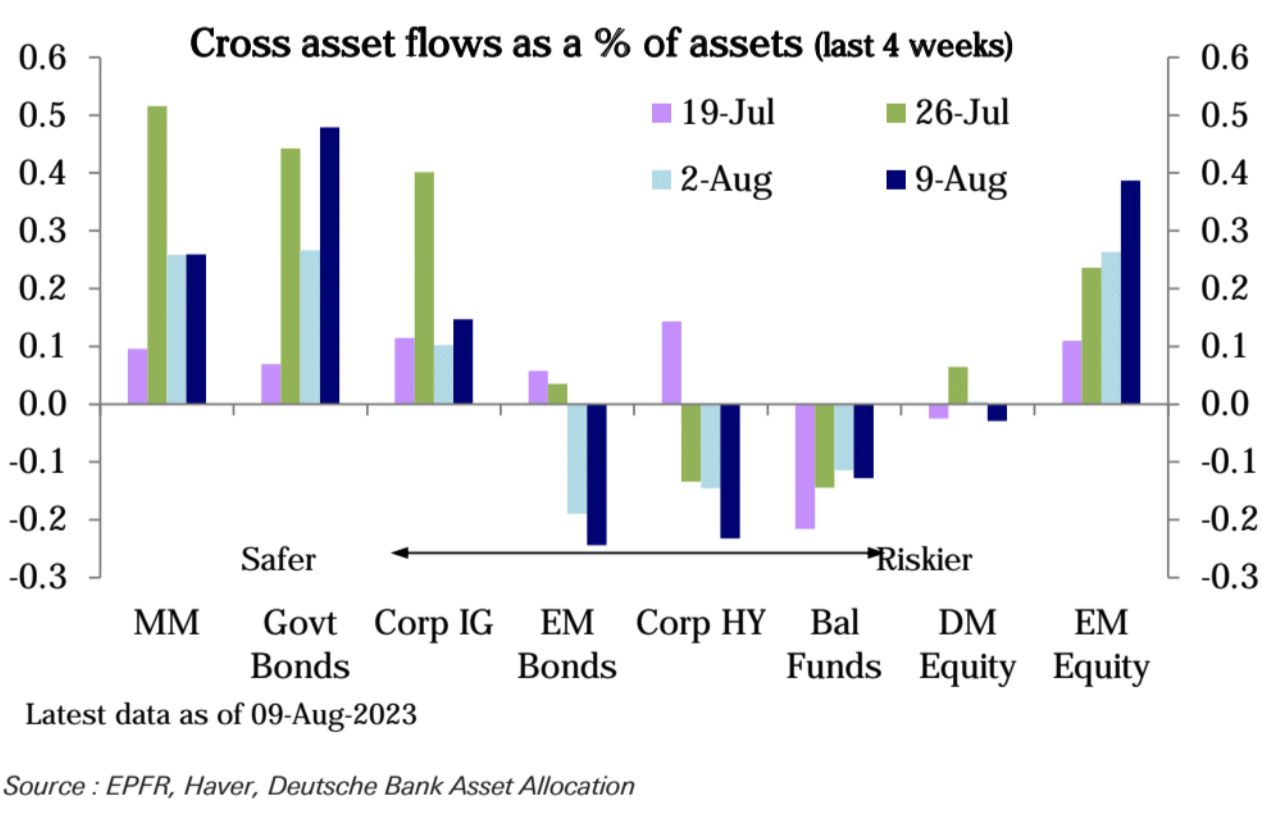
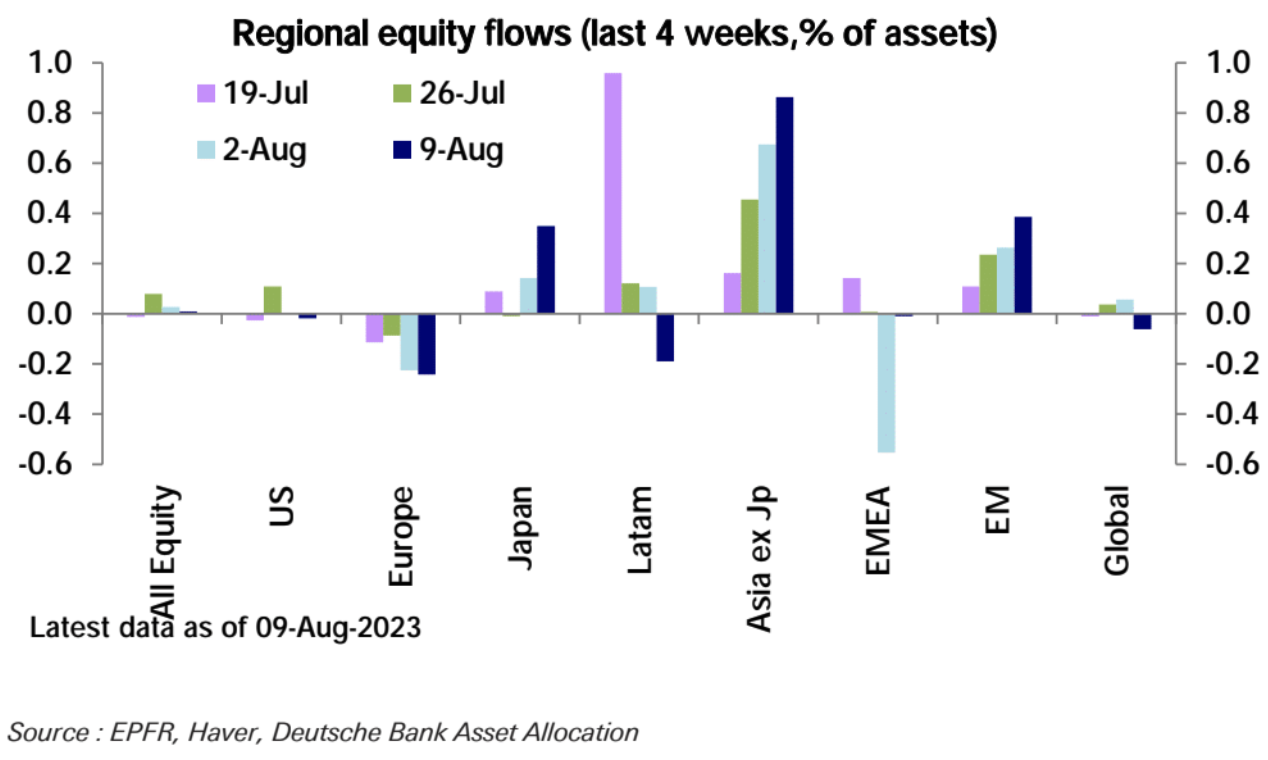
From the perspective of funds, fund inflows continued to slow down. Emerging markets and Japan attracted strong inflows, but U.S., European and global funds saw outflows. In terms of industries, technology and healthcare attracted large-scale inflows. Energy, telecoms and industrials also saw small inflows, while financials, real estate and raw materials saw more pronounced redemptions.
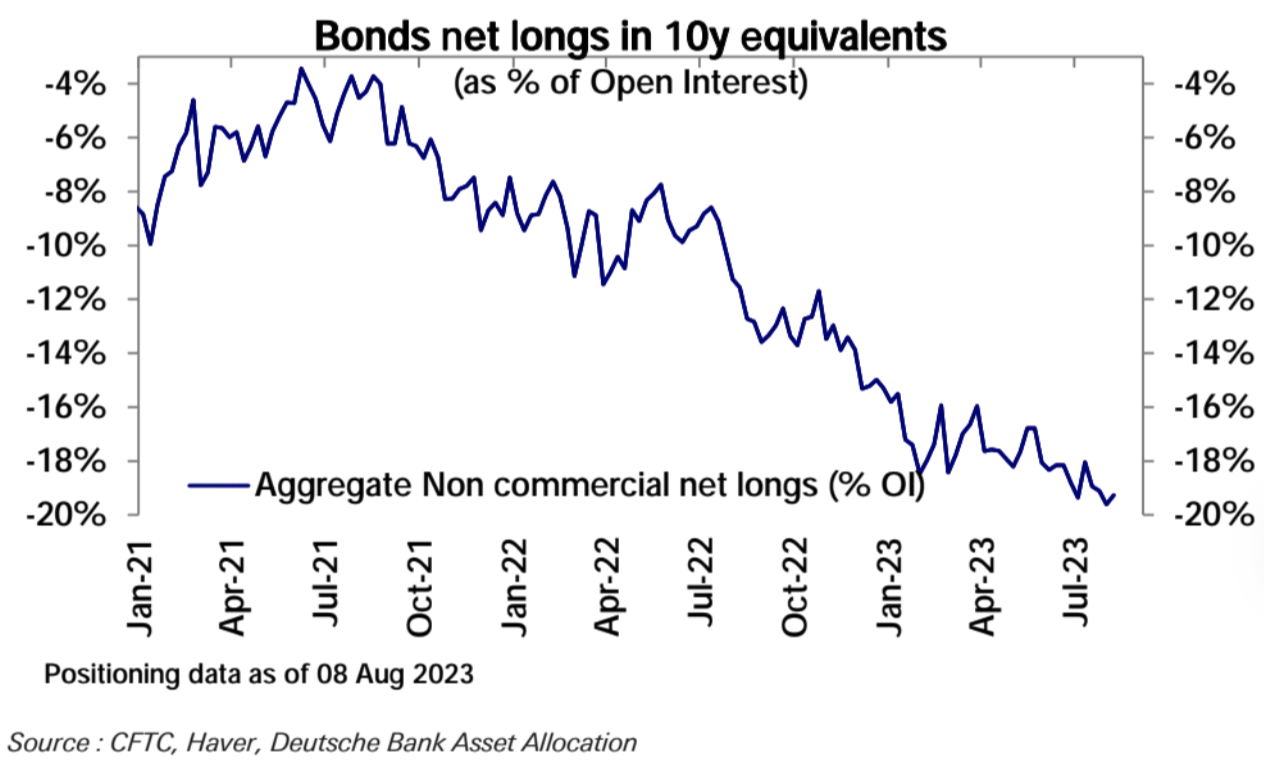
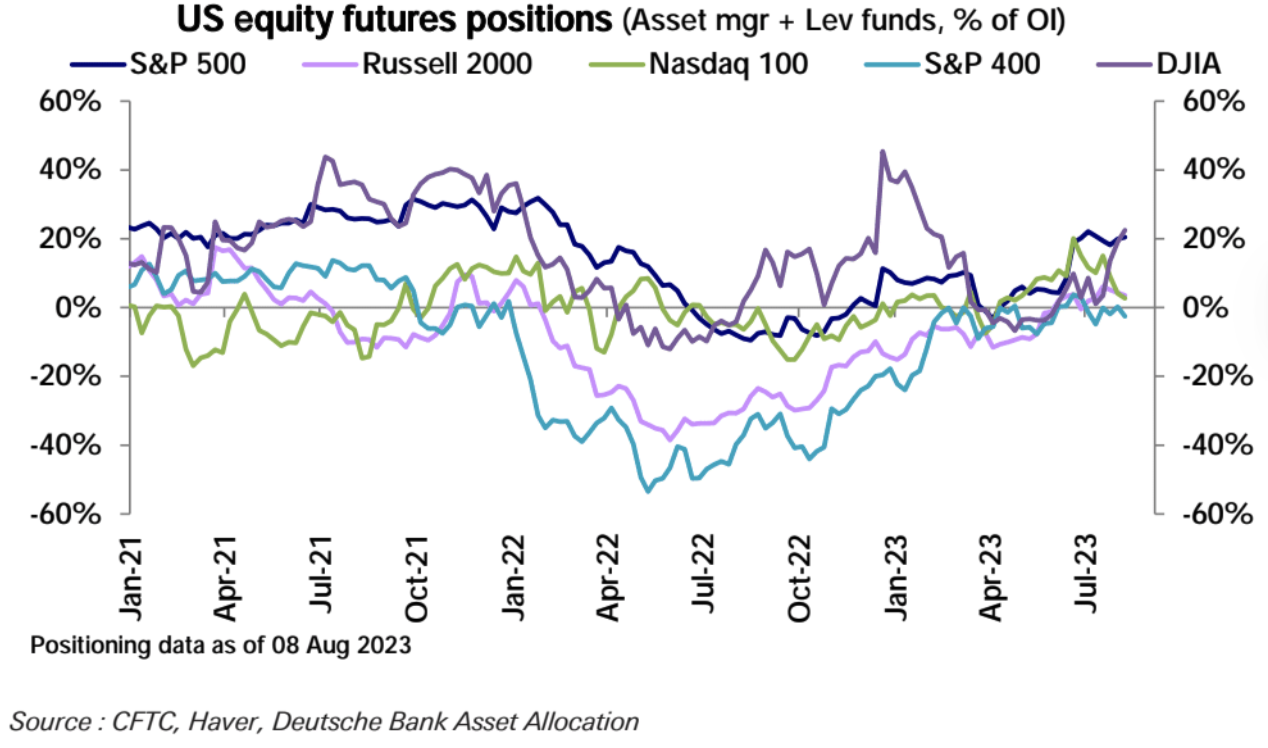
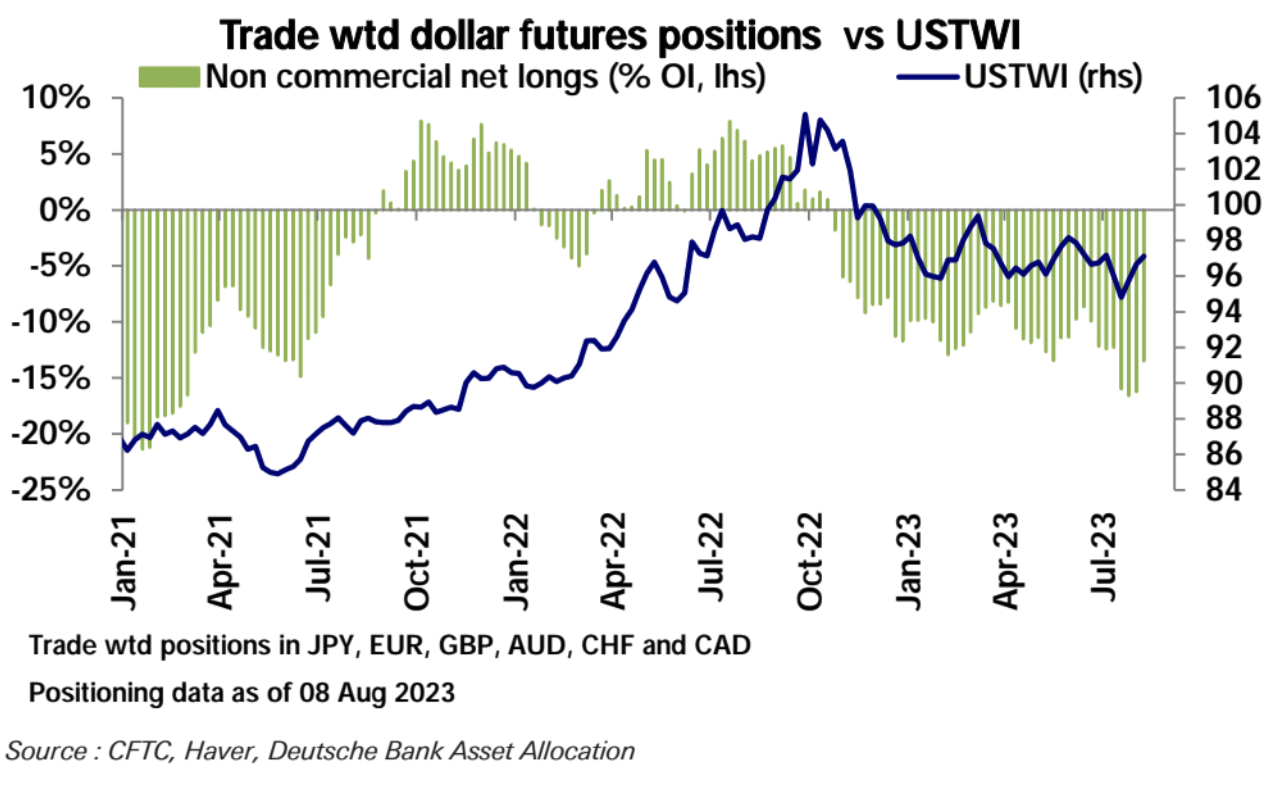
Looking at futures positions, stock index futures net longs have increased for two consecutive weeks, mainly because the increase in SP 500 net longs exceeded the decrease in the Nasdaq 100 and Russell 2000. Emerging market net longs also fell. In bonds, overall net shorts have shrunk, mainly in 5-year net shorts. In foreign exchange futures, net short positions in the US dollar continued to decrease, mainly due to reductions in net long positions in the euro and sterling.
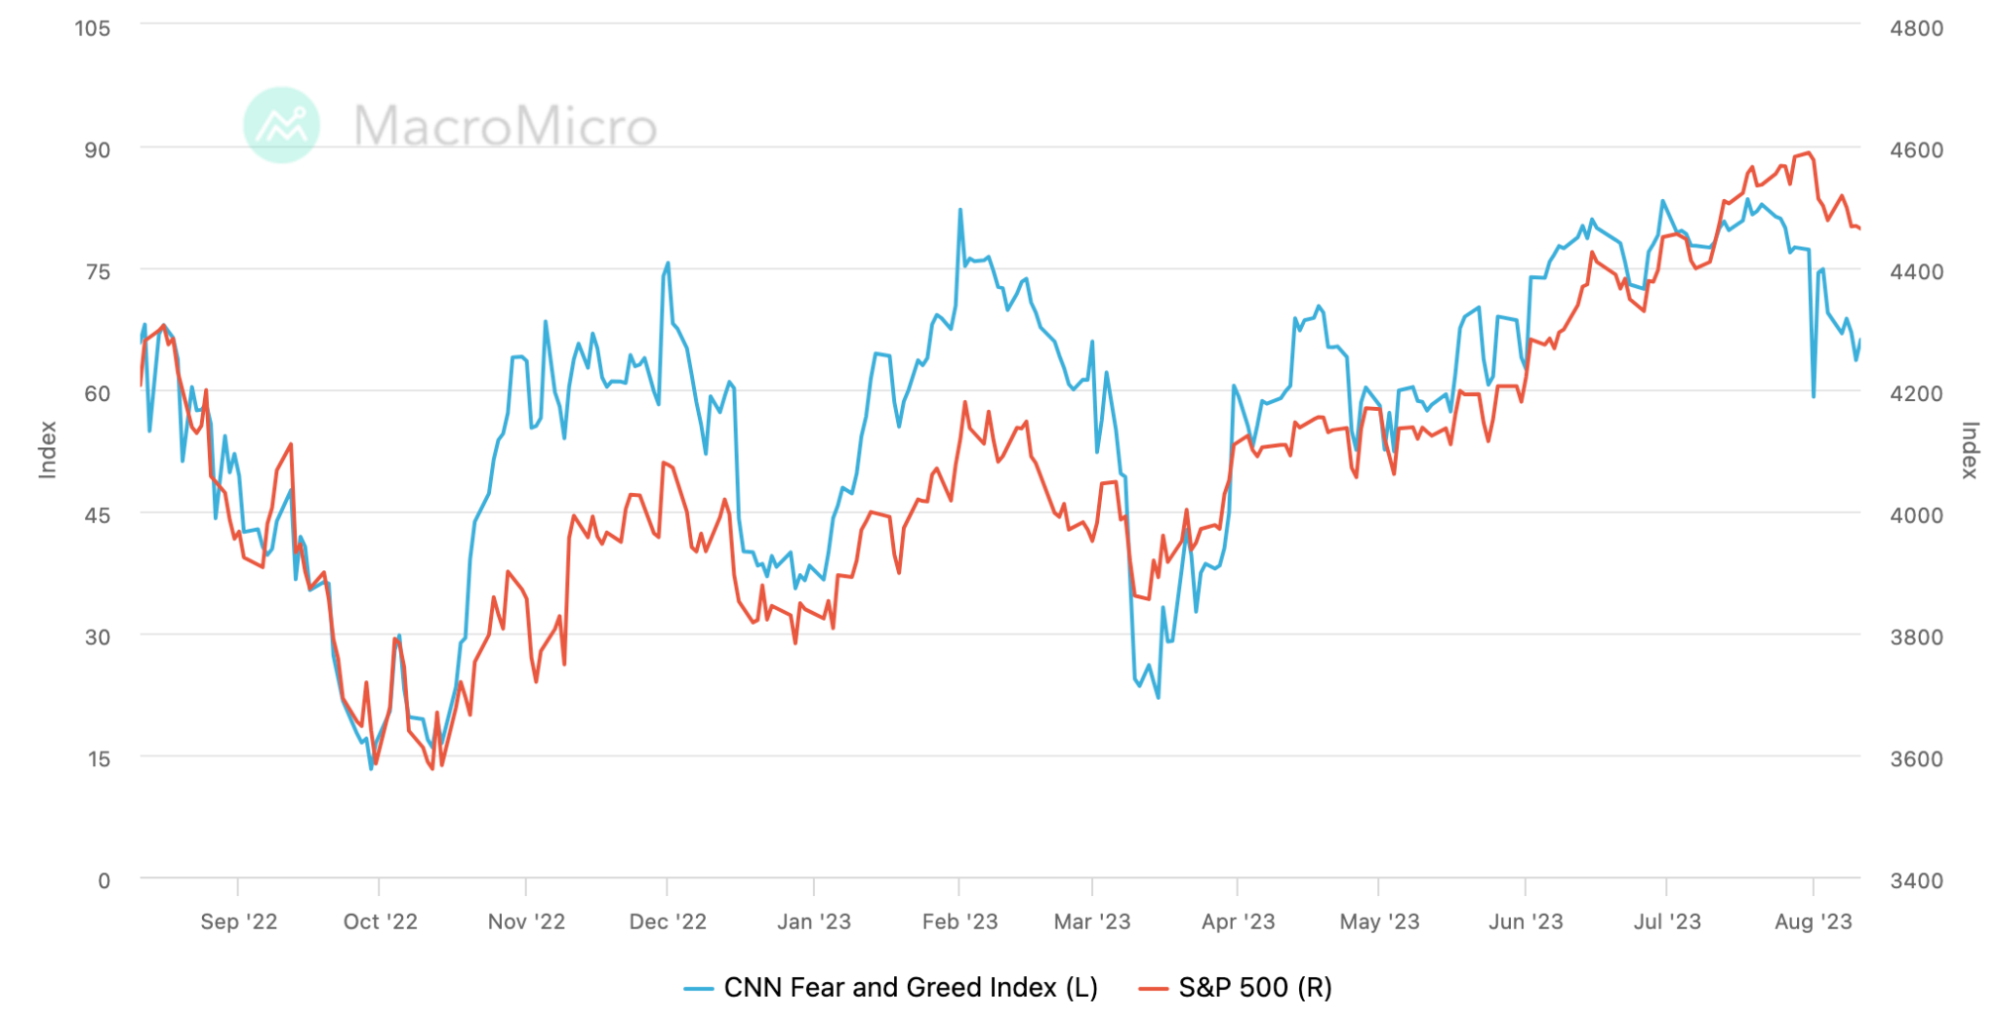
investor sentiment
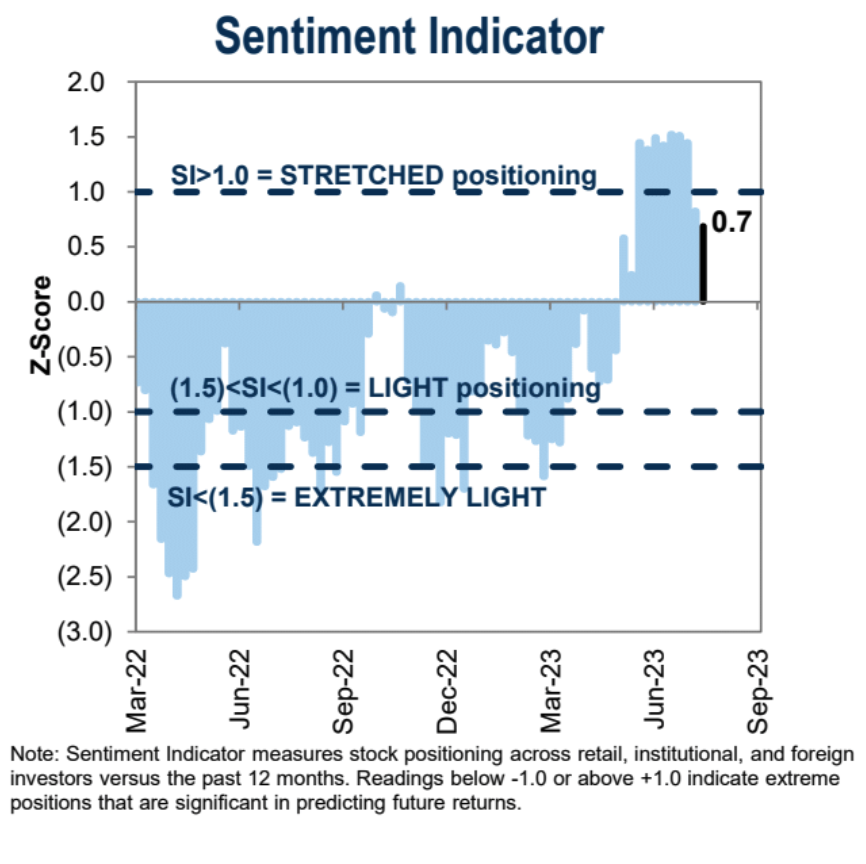
Goldman Sachs Investor Positioning Sentiment data continues to drop 0.8 ➝ 0.7:
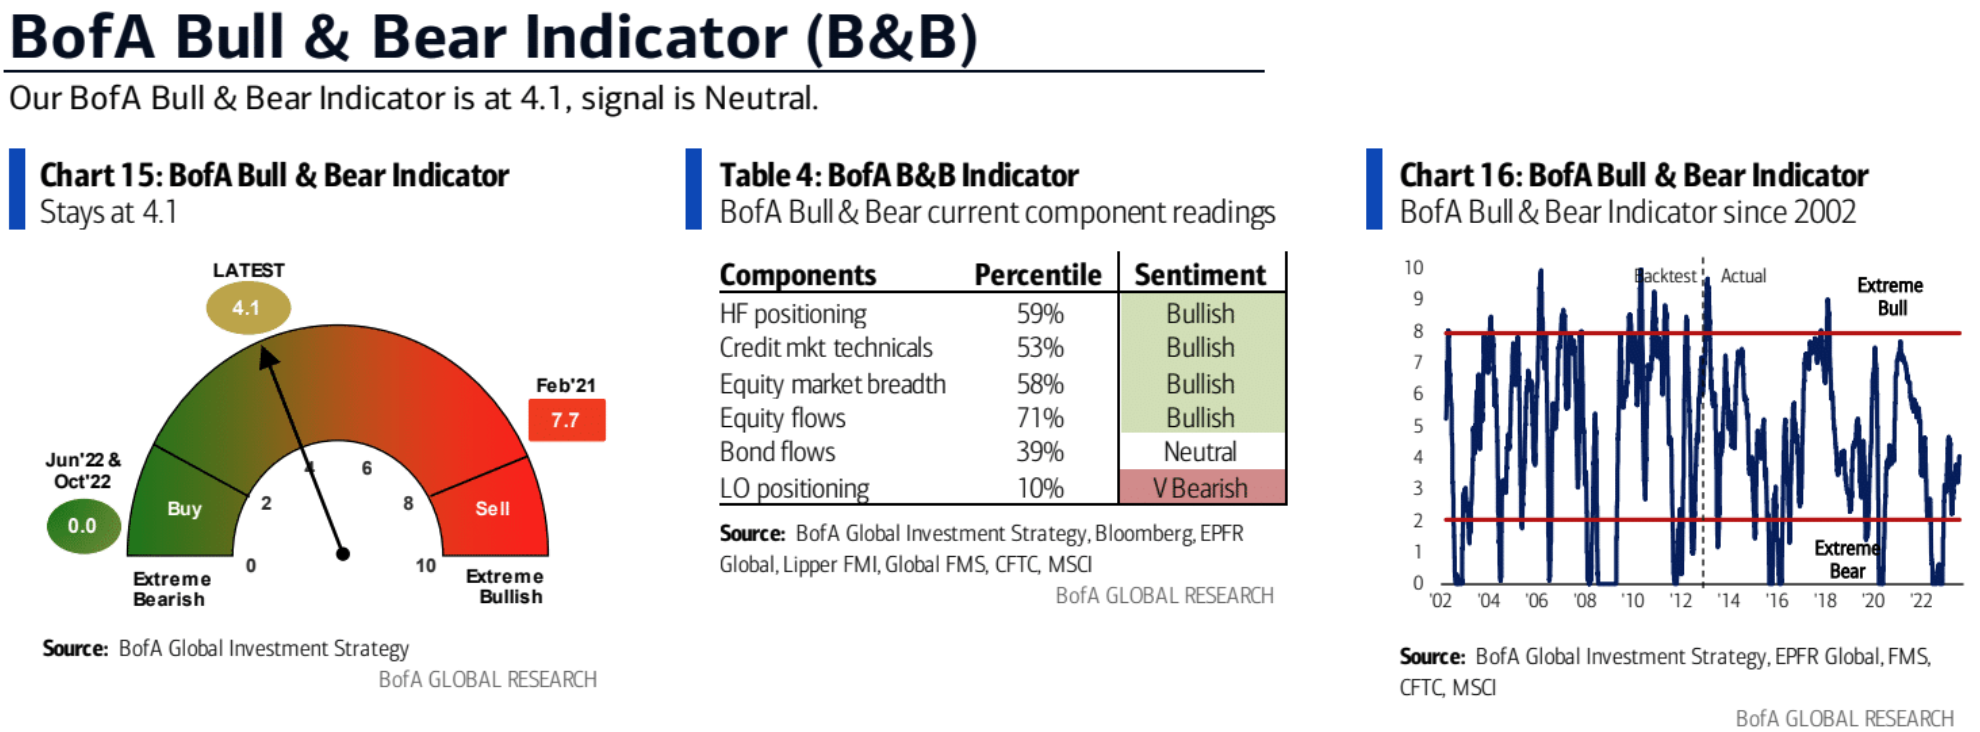
 BofAs bull-bear sentiment indicators were unchanged from the previous week:
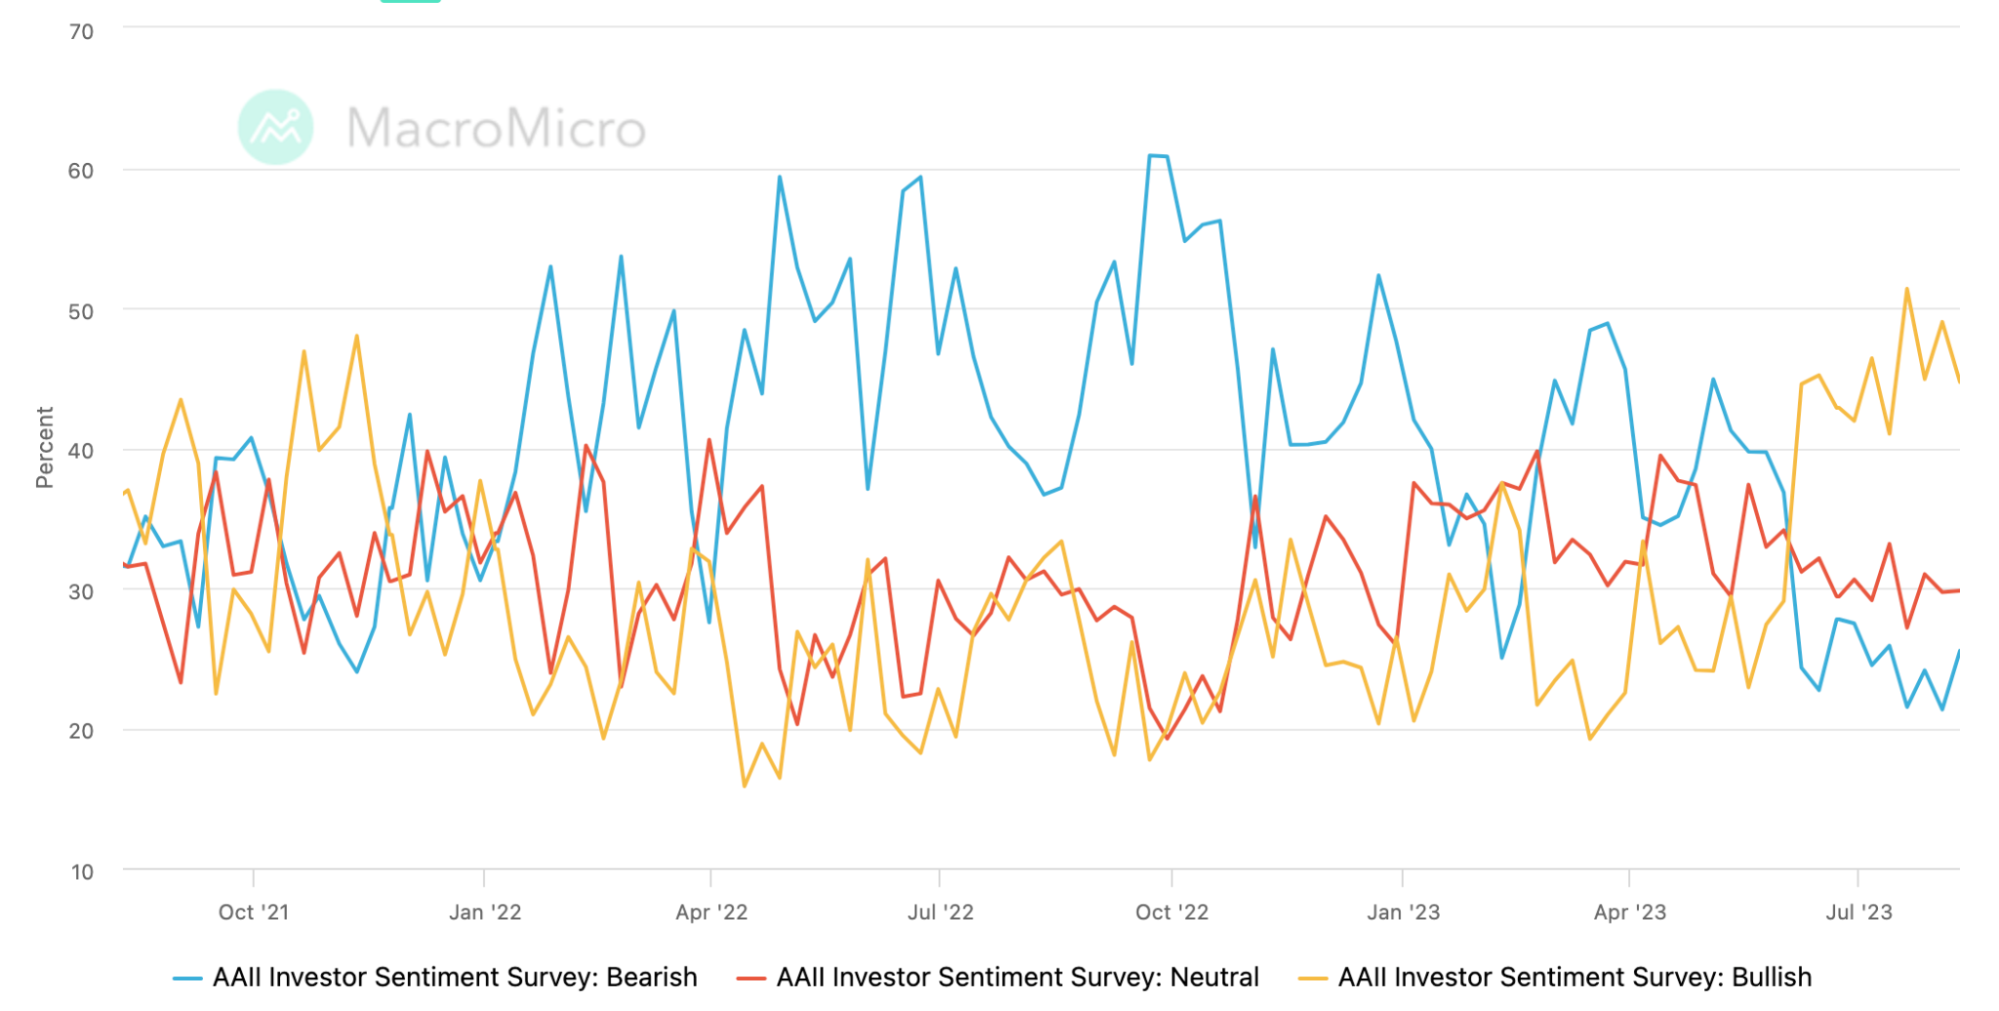
AAII Investor Survey
Bearish: 21.32 ➝ 25.50
Neutral: 29.70 ➝ 29.80
Bullish: 48.98 ➝ 44.70
digital currency market
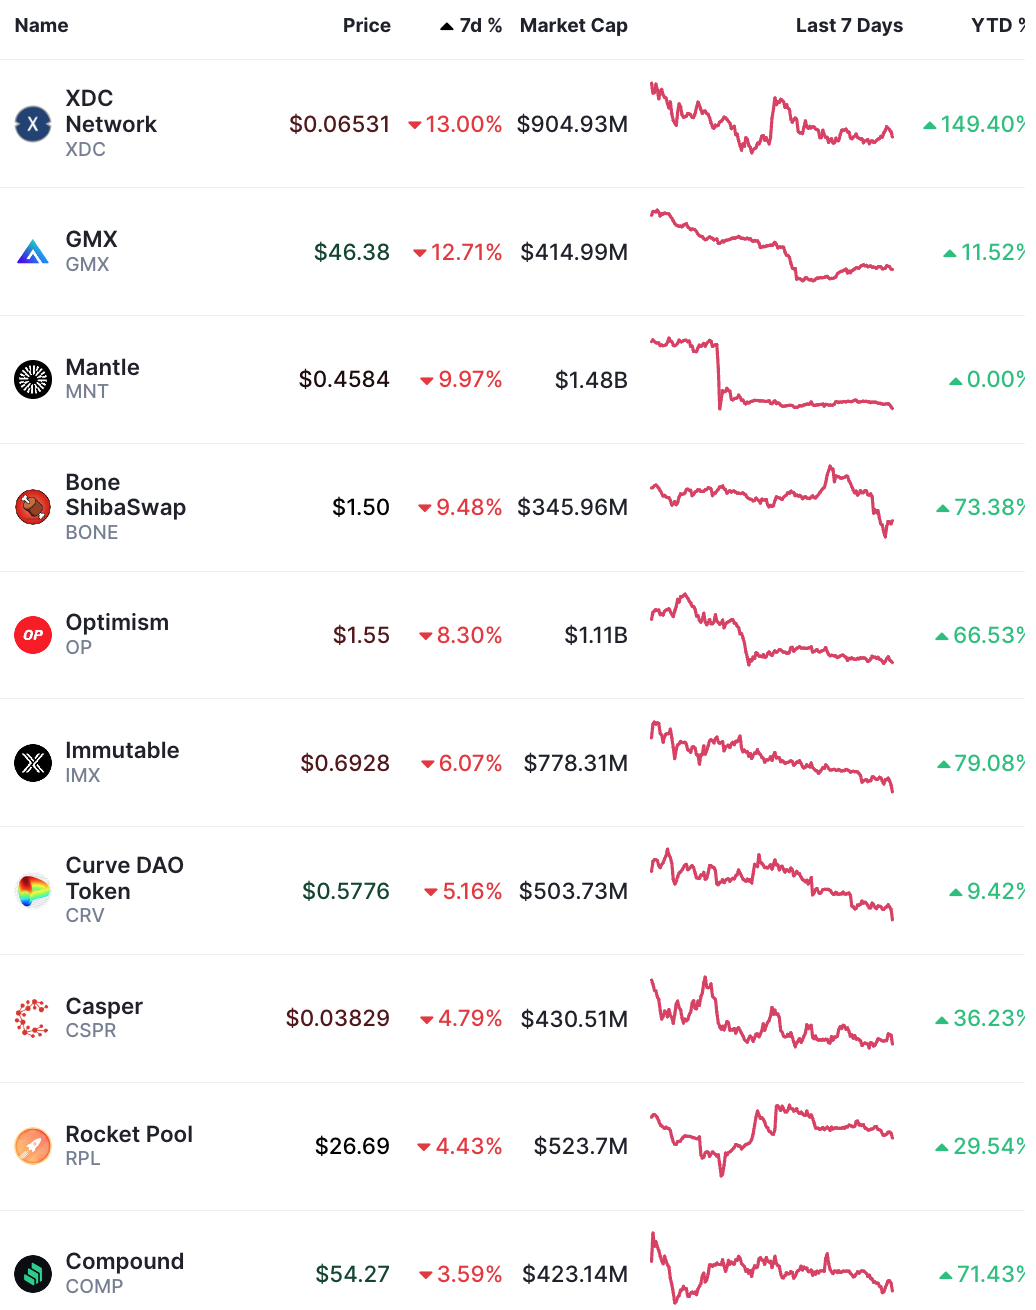
The top 100 cryptocurrencies by market capitalization in the week: RUNE price rose nearly 50% in a week, hitting the highest level since April. Probably because of the new swap released about a week ago. As far as I know, Thorchain is the only on-chain tool that allows users to exchange native BTC and native ETH; it is also worth noting that TON, Telegram crypto bots are gaining momentum in the market, according to a new report from Binance Research, Daily cryptocurrency trading volume from Telegram bots hit an all-time high of $10 million in July.
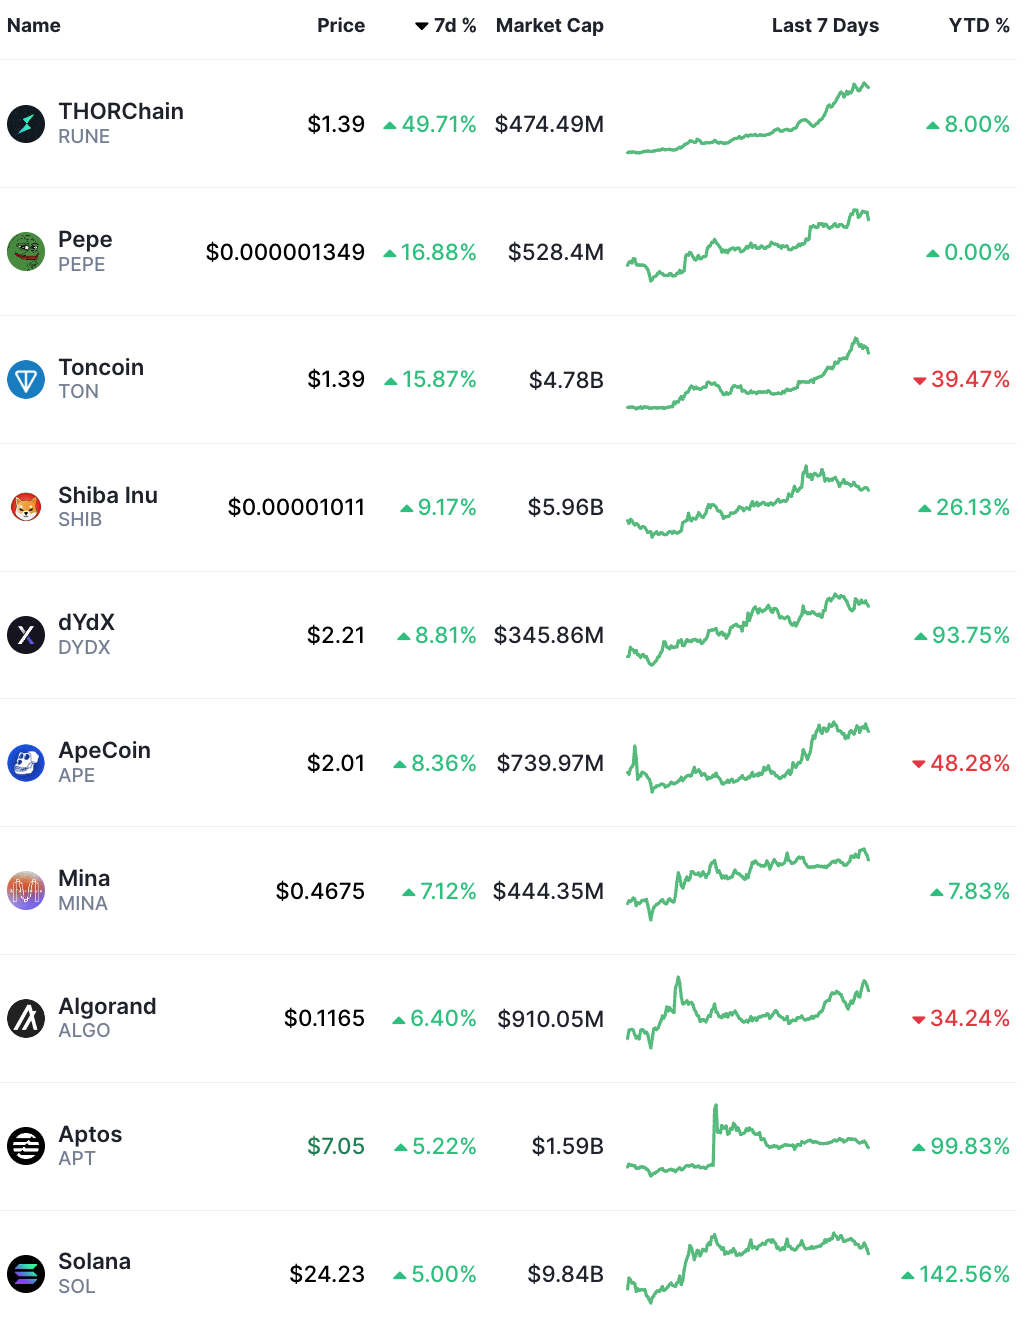
The top 100 cryptocurrencies by market capitalization for the week
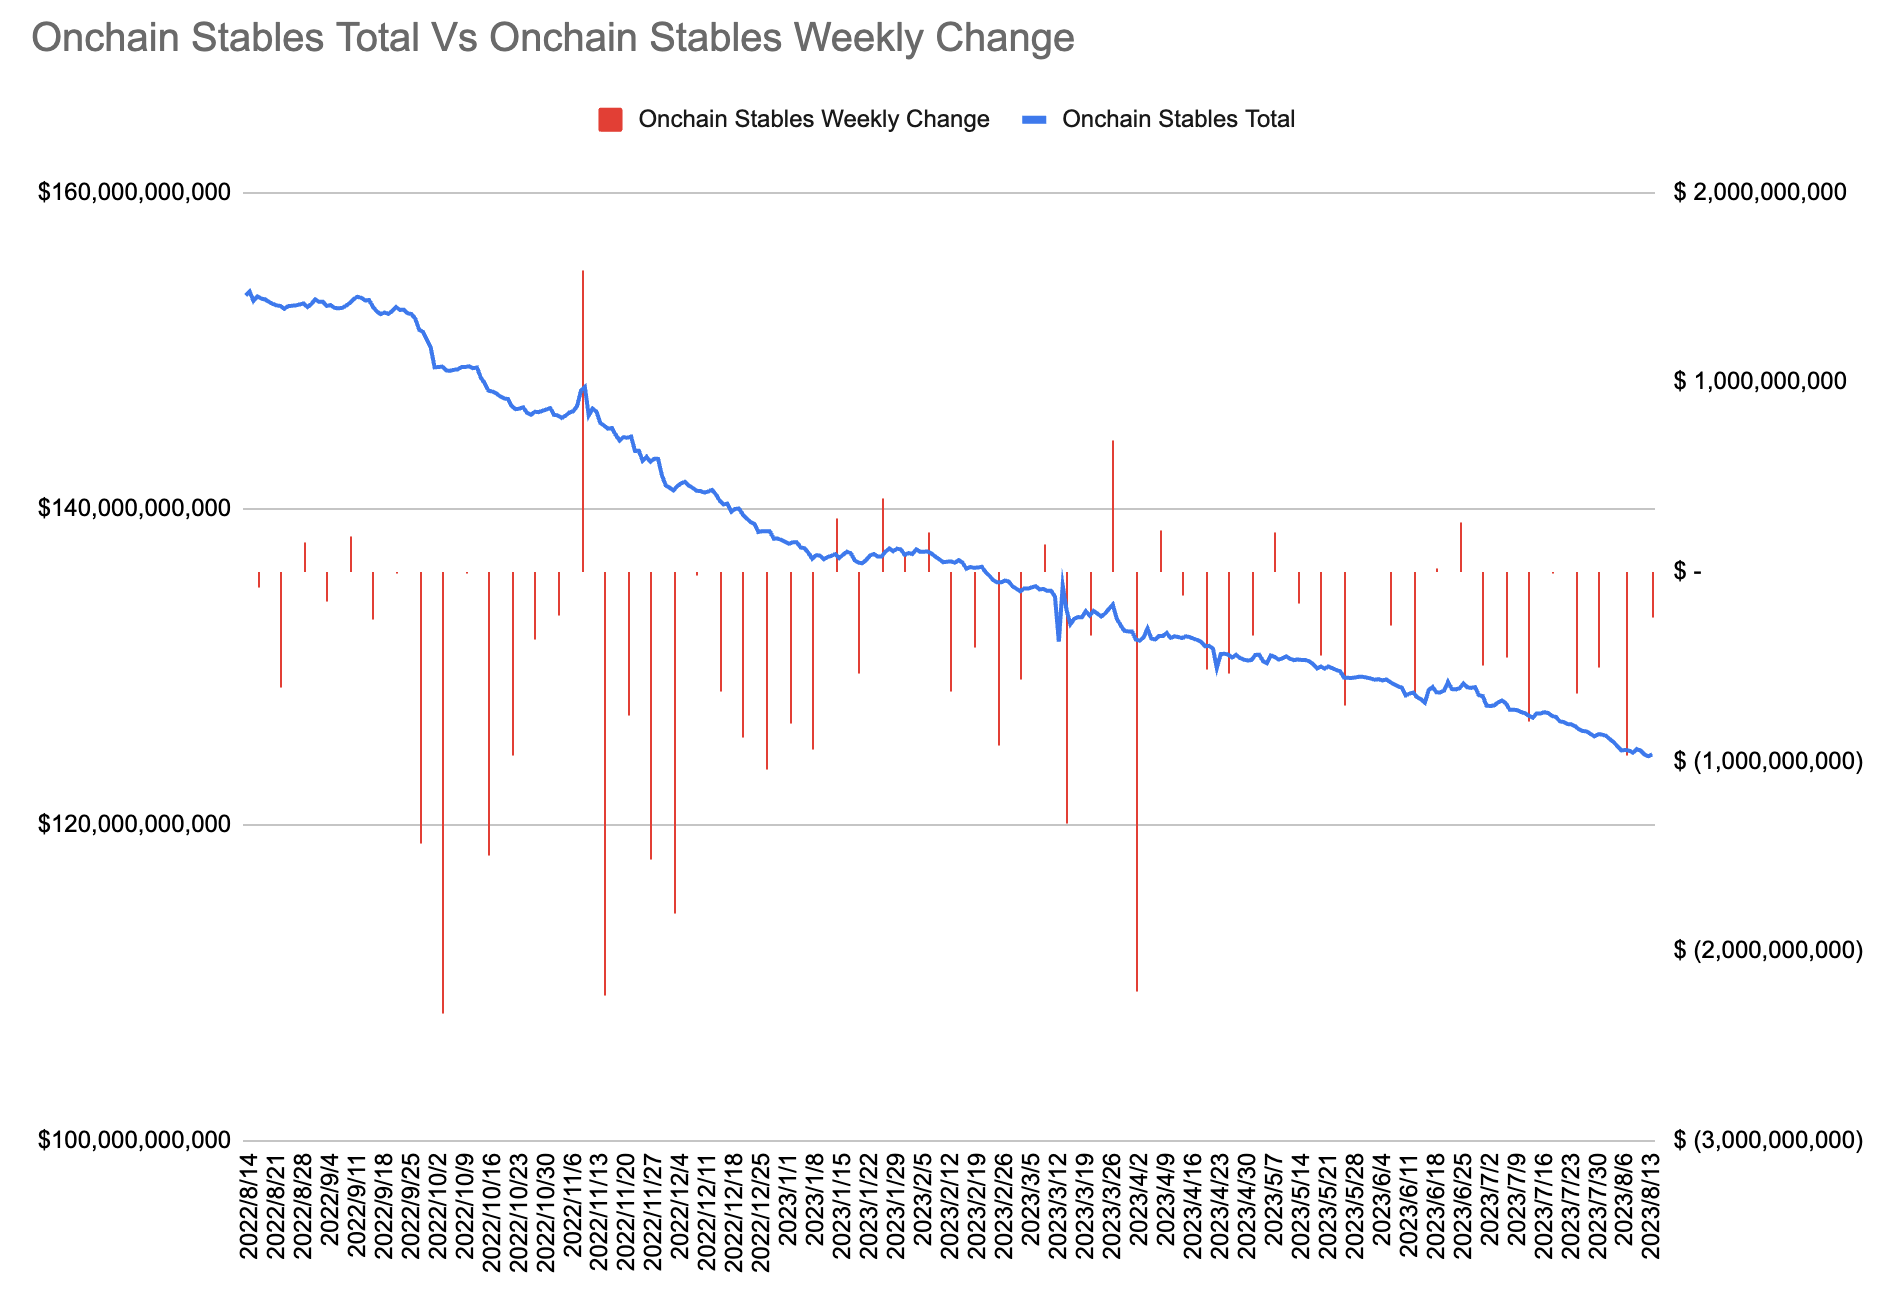
The net outflow of on-chain stablecoins (not counting Makerdao’s newly added DAI to DS financial management, + 1 billion U.S. dollars a week) has been significantly narrower for the eighth consecutive week (-246 million U.S. dollars) than the previous week’s -973 million U.S. dollars:
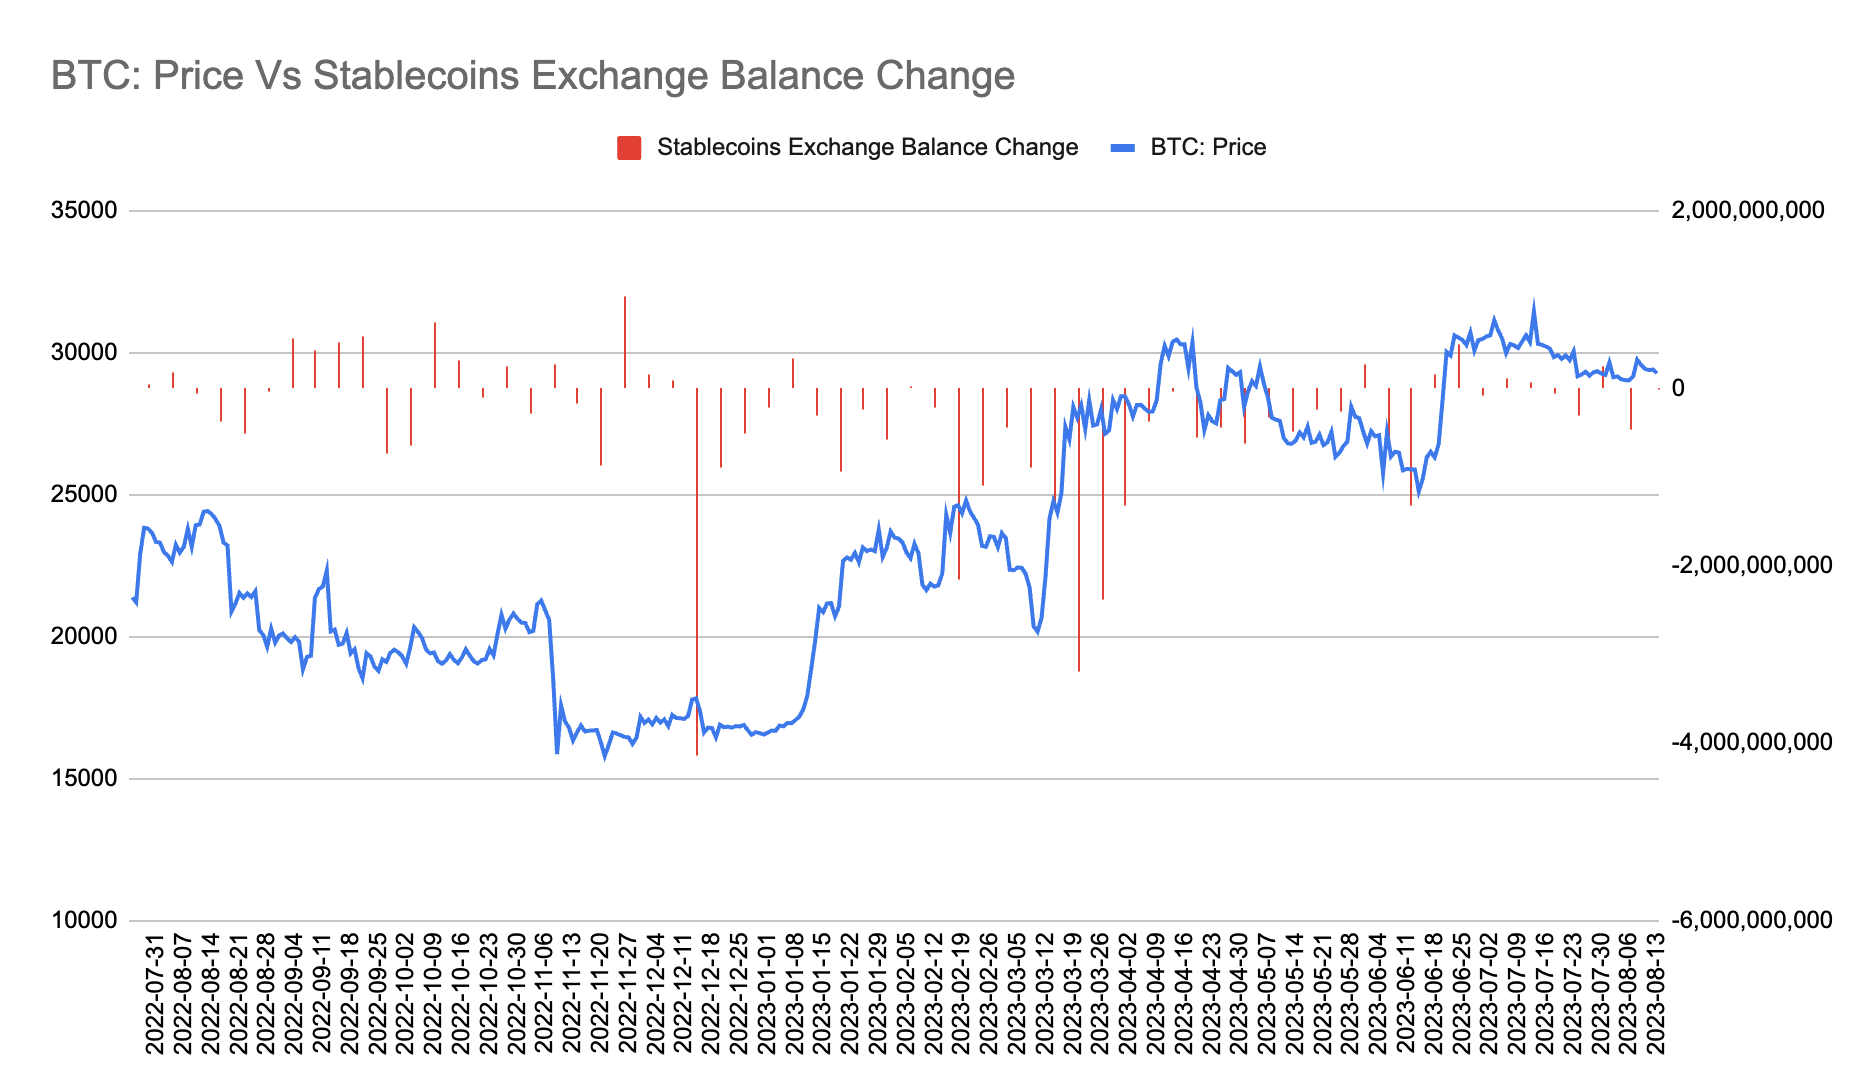
The net outflow of stablecoins on the exchange (-$12 million) narrowed sharply from the previous weeks -$476 million for the second consecutive week:
Excerpt from market commentary
Wudaokou Macro Notes: Why are we so eager for AI and room temperature superconductivity? The essence is the limit race between the innovation cycle and the debt cycle
In the past two years, the worlds desire for technological breakthroughs has reached a frenzy, such as metaverse, artificial intelligence, etc. The essential reason behind this is that we are now nearing the end of the computer/Internet innovation cycle, and there is an urgent need to start a new innovation cycle. At the same time, we are facing a critical moment when the long-term debt cycle crisis breaks out.
This round of computer/Internet innovation cycle is coming to an end, with the global debt/GDP ratio exceeding 335%, and the global market is eagerly looking for the seeds of the next innovation cycle. The next ten years may be the most critical time.
The new innovation cycle can bring excess profit margins to enterprises, high income growth rates to residents, and high return on investment to investors; while the debt cycle is actually a combination of profit margins, income growth rates, return on investment, and capital. The game of borrowing costs. Therefore, in the early and middle stages of the innovation cycle, all sectors can obtain excess rates of return, which are higher than the cost of borrowing funds, so the debt cycle can expand benignly and promote the acceleration of the innovation cycle; but in the late stage of the innovation cycle, as As the entire pie of production and demand no longer grows, the rate of return on investment will gradually decline, the marginal benefits of capital will diminish, and income expectations will gradually decline. Driven by the continuous growth of debt, funds will spawn asset bubbles and aggravate the gap between the rich and the poor in pursuit of the rate of return on investment. , and trigger a debt crisis.
[Old Debt King believes that the US debt has not yet been adjusted in place]
Bill Gross, co-founder of Pimco, said it would be a mistake to be long U.S. stocks and U.S. bonds now because both markets are overvalued. He believes the fair value of the 10-year Treasury yield is about 4.5%, compared with the current level of about 4.16%. Inflation in the U.S. is likely to remain stuck at around 3%, according to Bill Gross. He noted that the 10-year Treasury yield has historically traded about 135 basis points above the Feds policy rate. So even if the Fed cut rates down to around 3%, current 10-year Treasury yields are still too low historically.


