Bloomberg Analyst: Under the expansion of Layer 2, the extent to which Ethereum is being eroded is much lower than expected.


Original author: Jamie Coutts CMT, Bloomberg Intelligence cryptocurrency analyst
Translation: Luffy, Foresight News
I am increasingly convinced that Ethereum has the potential to create more value than alternative L1 solutions, for two main reasons:
L2 adoption is growing rapidly
L1 erosion is lower than expected
In this tweet thread, I will briefly analyze the dynamic changes in the fundamentals of the Ethereum network.
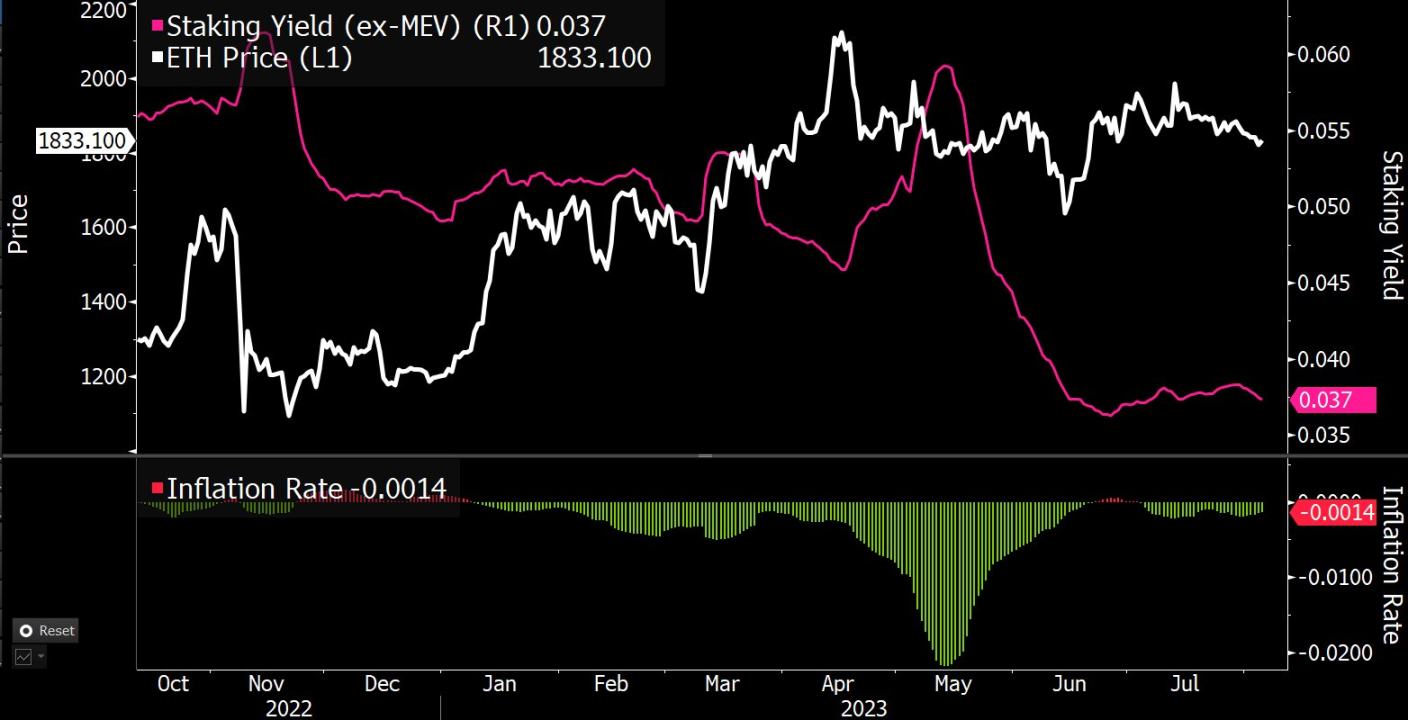
The smooth price fluctuations of ETH conceal its value accumulation.
Driven by L2 growth and slight monetary tightening, the Ethereum price is back on a growth track
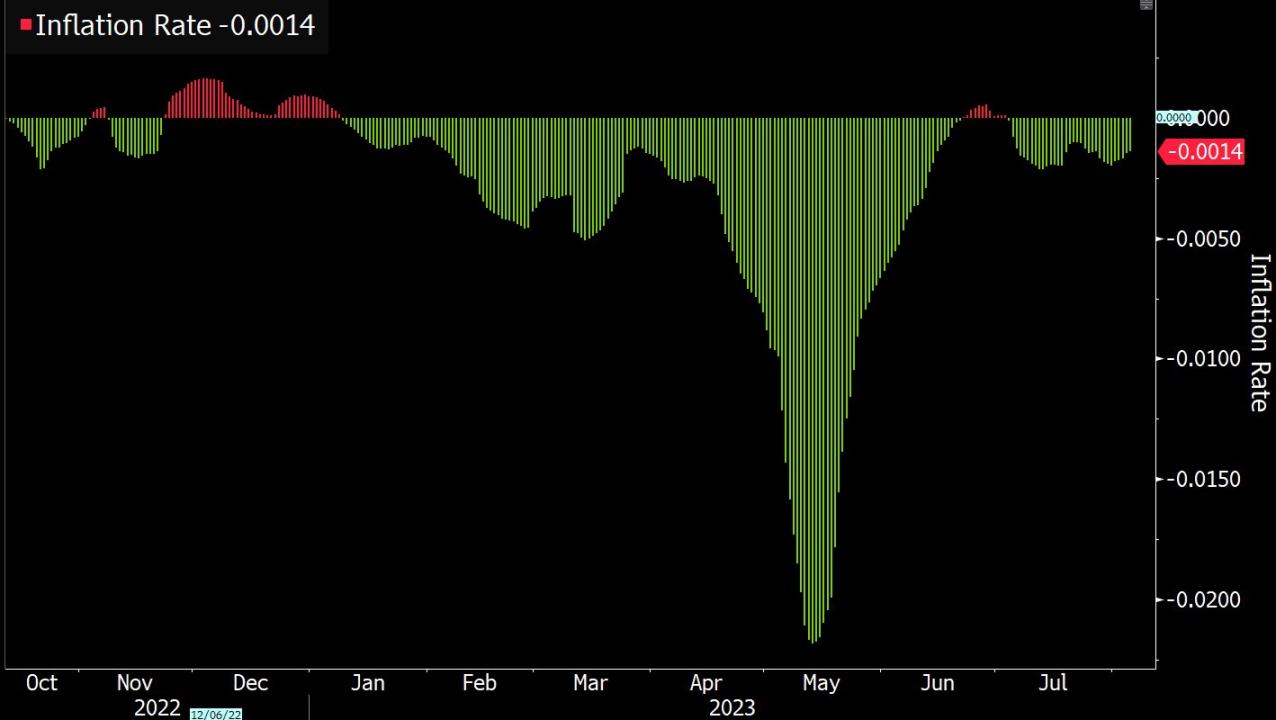
Despite being in a bear market, ETH has entered a deflationary phase (pre-merger inflation rate above 4%)
Despite cooling network activity, ETH staking volume has increased by 38% in the past 3 months
L1 Network Adoption
Ethereum's ambition to extend its network through L2 Rollup is clearly reflected in on-chain data, despite the decline in L1 activity last year. ETH utilization has increased, and the network's financial condition is thriving.
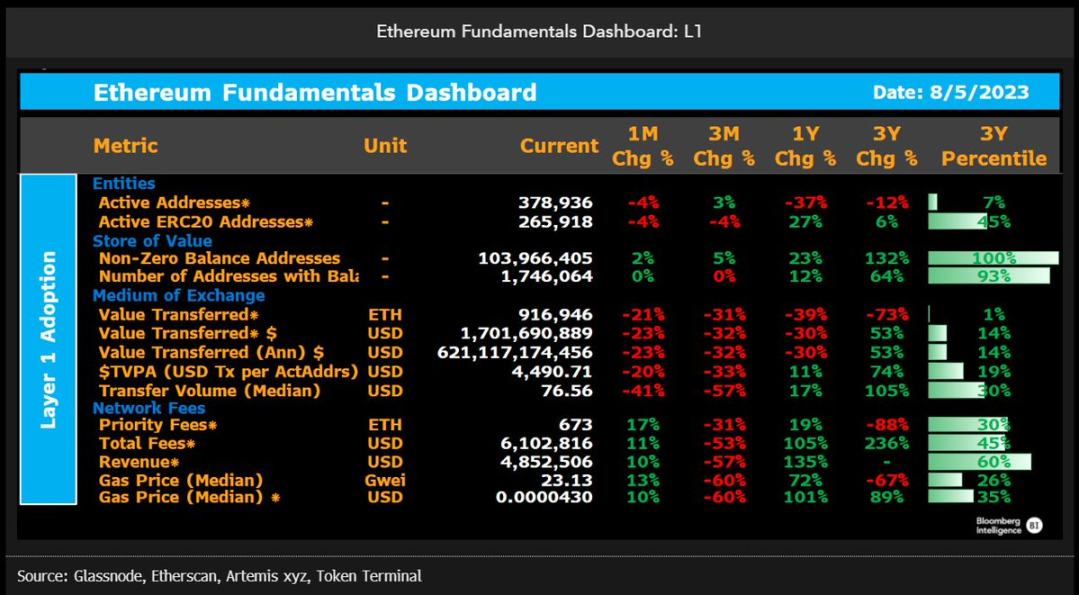
Compared to a year ago, the number of active L1 addresses has decreased by 37% to 379,000, but the number of active ERC-20 addresses has increased by 27%. Smart contracts lock up 31% of the total ETH supply (mostly from staking), and the overall ETH utilization has improved.
The value of on-chain transactions has decreased by 30% in USD compared to a year ago, while the price of ETH has risen by 8%. Given that on-chain transfers are now cheaper and faster on L2, this decline is not surprising.
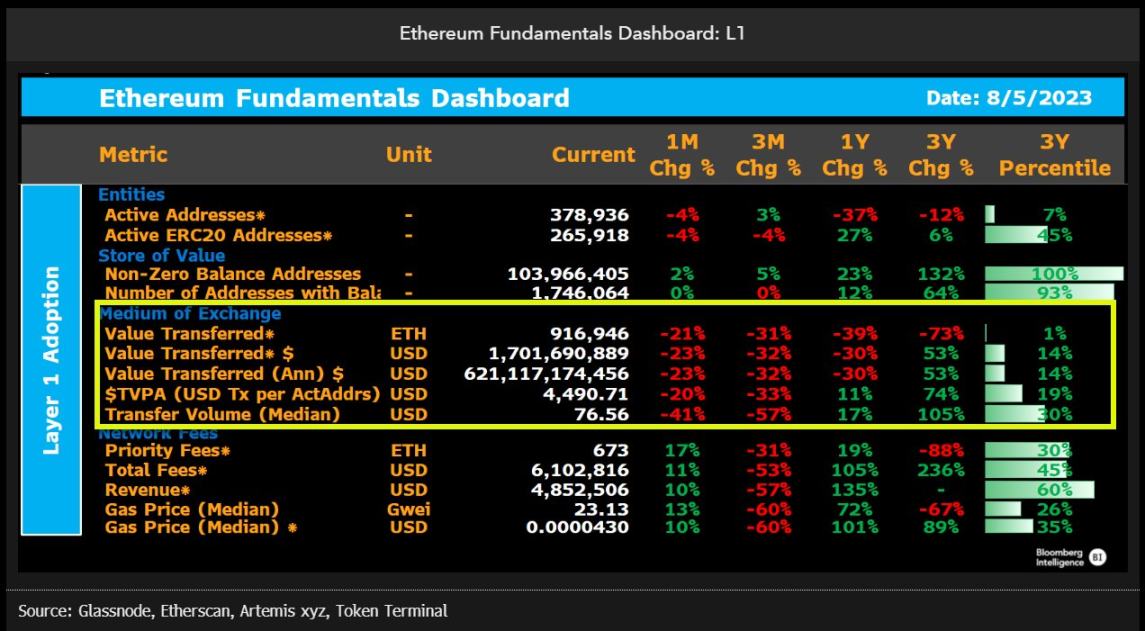
Despite the decrease in network activity, investors continue to exhibit a positive behavior of hodling cryptocurrency. The number of non-zero balance addresses exceeds 100 million, with over 1.7 million wallet addresses containing at least 1 ETH.
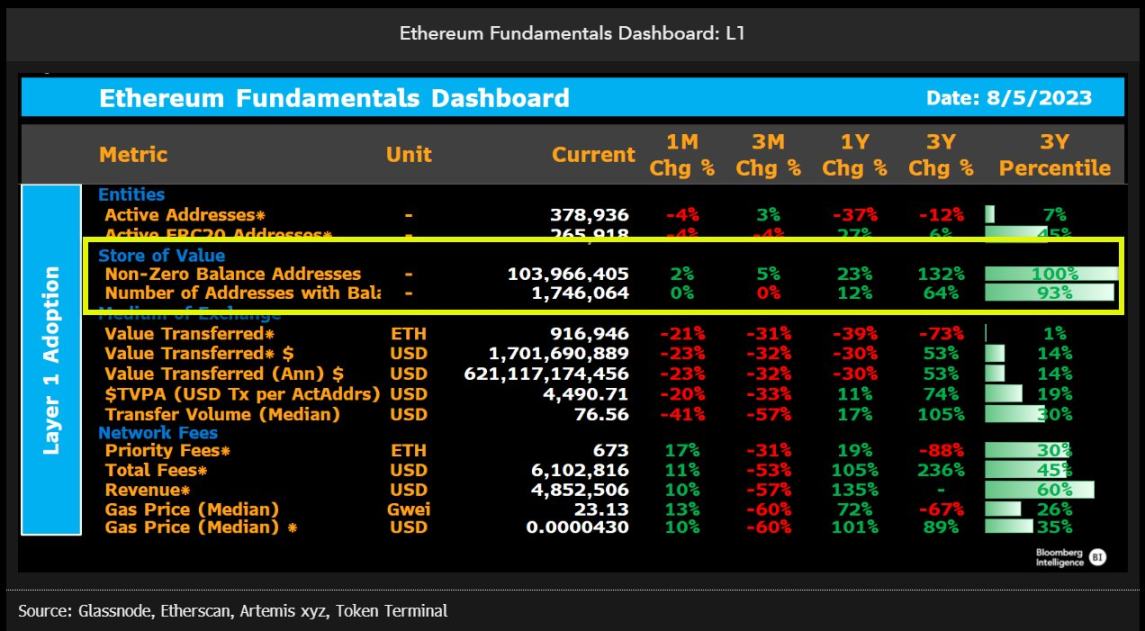
The increase in fee revenue surpasses the price increase
Looking at a two-year cycle, Ethereum network activity has decreased, reaching a bottom in the fourth quarter of 2022, and the speed of recovery is in line with the start of a new bull market cycle. As expected, the rapid growth of L2 has chipped away at L1's network activity but has not had as much impact on the network's finances as anticipated.
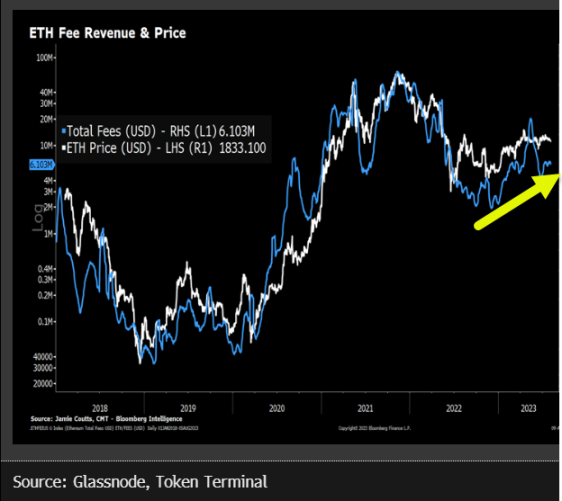
Despite the noticeable decrease in network fee revenue in USD compared to 2021, it has tripled from the low point of the fourth quarter of 2022. L1 generates approximately $6 million in daily fee revenue, with 80% being burned and the remaining paid to validators.
Since the beginning of this year, Ethereum L1's daily fee revenue in USD has increased by 176%, while the price of ETH has only risen by 53%. The relationship between the two is inspiring, as during the previous bull market, fees surpassed prices after experiencing a two-year decline in 2020.
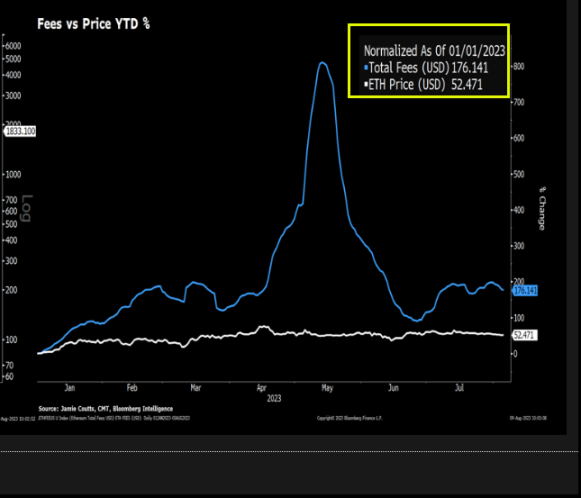
Analogous to a nation-state, L1 provides infrastructure (roads, communication) and security (property rights) to economic zones or city-states (L2) to establish and compete for commercial capital (decentralized applications).
In these places, operating means lower taxes (fees) and less bureaucracy from national institutions (ETH validators), reducing friction for applications and providing cheaper and faster customer service.
L2 Network Adoption Metrics
It has been proven that Ethereum's migration to L2 was a huge success last year. In the past 12 months, hundreds of thousands of new users have joined Web3, and L2 active addresses have increased by 245%.
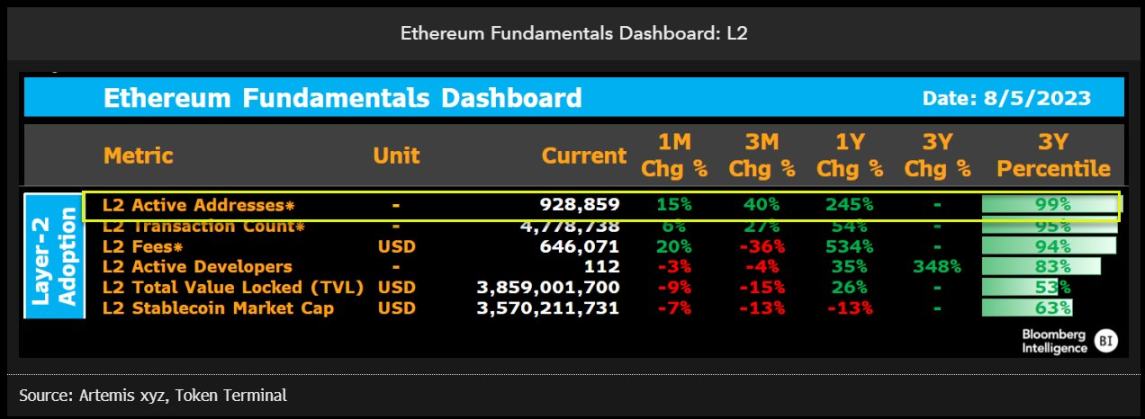
The growth of L2 fees (an average of $600,000 per day) helps to slow down the erosion of L1 revenues, but more importantly, L2 is amplifying network effects.
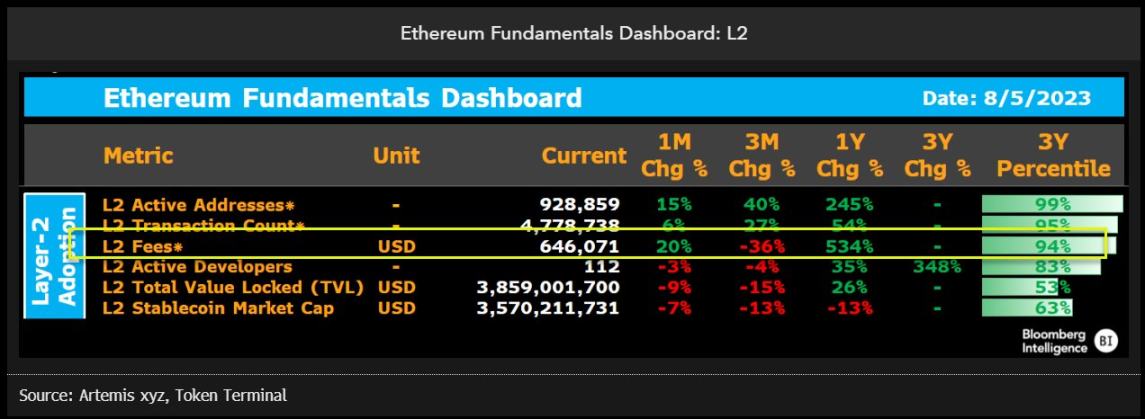
Given the rapid rise in L2 adoption rates, by the end of the year, fees paid through Rollup on L1 could account for 20% of total fees and reach 50% within 3 years. In classified data, the proportion of fees paid to L1 through Rollup this year has increased 2.8 times, slightly below 14%.
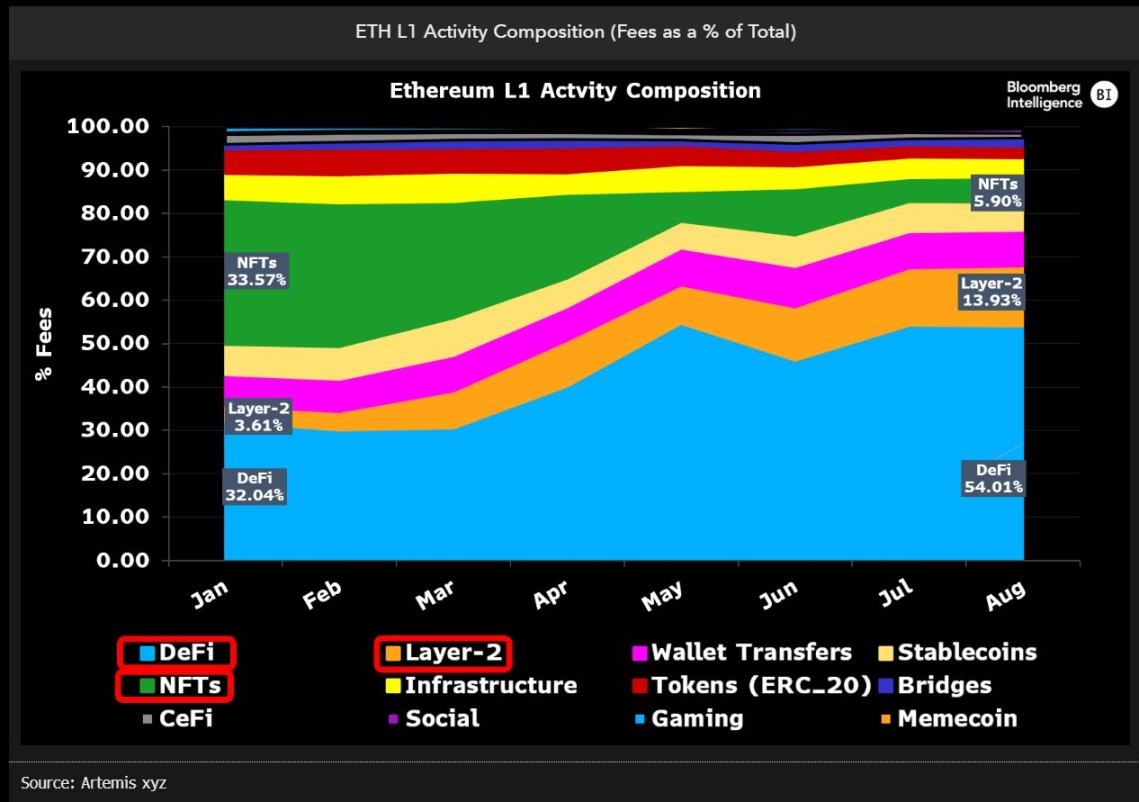
One consequence of L2 growth is a significant decline in NFT activity on L1, as the lower friction costs of L2 NFT markets attract users. The proportion of fees paid for NFTs has dropped by 80%, currently slightly below 6%.
Conclusion
As the leading L1, Ethereum has performed very strongly. Despite the rapid expansion of L2, Ethereum is being eroded to a much lesser extent than our previous expectations, and its moat is constantly deepening and widening.