first level titlePrinciples of Index Enhancement Fund Strategy
secondary title
Basic concepts and ideas related to the enhancement of the ETHE index
An index enhancement strategy is a portfolio management approach that attempts to amplify the returns of an underlying portfolio or index and outperform the index on yield or risk metrics.
This strategy needs to use ETHE as the cornerstone position, allocate no less than 60% of the funds in ETHE spot, and allocate the rest of the funds in cash, fixed income products, US stock blockchain and cryptocurrency-related concept stocks, and option derivatives of these stocks product tools.
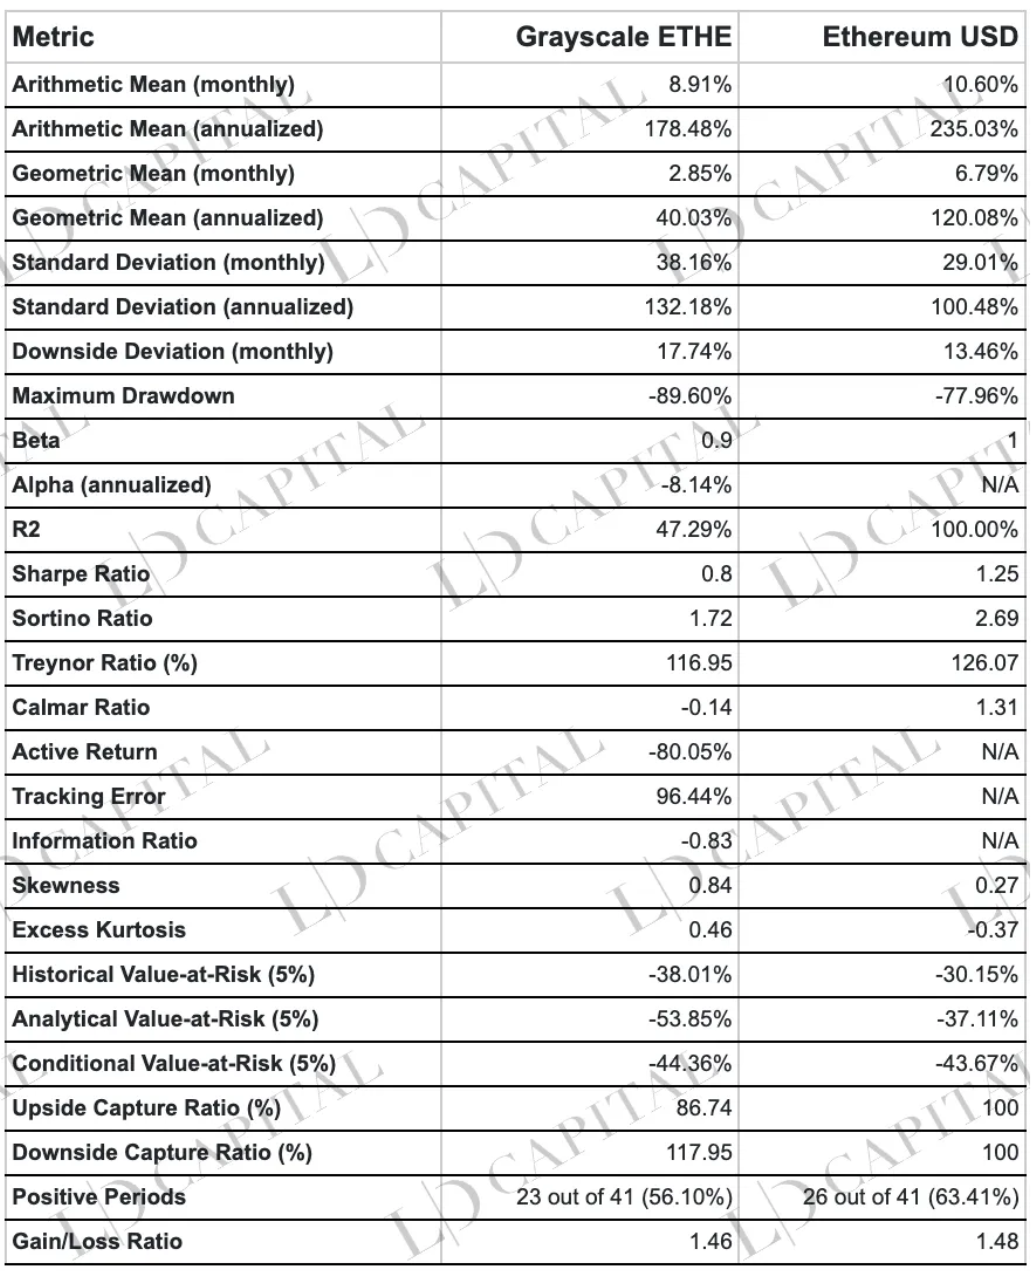
Index enhancement combines elements of active and passive management. Due to the factors of active management, investment introduces the risk of subjective judgment of strategic managers. In contrast, passive index funds only need to worry about market risks.The core source of excess returns for establishing a portfolio based on ETHE is to bet on the narrowing of ETHE’s secondary market price and NAV. However, given the poor historical return statistics of ETHE, in order to improve the holding experience during the holding process, we need:
Diversified configuration.Add some assets with not particularly high correlation, stable income, and low volatility to the investment portfolio, and correct the poor risk-reward ratio, such as cash, fixed-income products, US stock blockchain and cryptocurrency-related concept stocks, and Options derivative instruments on these stocks.
High position.It can be seen from the previous data that ETHE may have a higher earning potential in terms of positive fluctuations. Therefore, in order to avoid missing the extreme rising market, ETHE’s overall position needs to be maintained at a high level. Grayscale major financial crisis), should not be lower than 80% configuration.
Derivatives are enhanced.In the part of stock selection enhancement, adopting option strategy at the same time has more advantages than simply holding the target. The source of excess returns is mainly to obtain the volatility premium of option pricing, supplemented by the construction of complex option strategies to form a more targeted investment strategy.
Margin financing and securities lending.Play new.
With the improvement of the regulatory environment, more and more traditional brokerages are entering into the encrypted asset trading business. In the future, it is not ruled out that the initial offering of encrypted assets will be carried out on the regulated brokerage platform. Historically, the returns of the so-called ICO and IDO are very impressive. You can use our position as a new position with a small amount of cash to participate.
secondary title
Since 4 and 5 are temporarily difficult to carry out, so to expand the operation of 1 ~ 3, we need:
The ETHE single asset is used as the main tracking index, supplemented by ETH/USD as the reference index. Since the single asset is not the enhancement of the traditional broad-based index, in the face of the "narrow-based" index with a high degree of risk concentration, controlling volatility and controlling retracement are the goals that require more efforts when active management provides additional value.
In order for the performance of the investment portfolio not to deviate significantly from the benchmark index, it is necessary to maintain at least 60% of the capital ratio in ETHE. Under normal circumstances, it should maintain a weight of 80-90%, and the weight of income-enhanced funds should have an inflation rate of 10-20%.
Since ETHE shares are currently traded in the OTCQX market, which is the so-called over-the-counter securities market (OTC), the securities here usually have limited trading activity and there is no standard option market, so it is impossible to use the balance of the brokerage platform as collateral for covered options Selling strategy, or margin trading operation. Then the primary focus of the enhancement is to optimize the allocation of concept stocks related to blockchain and cryptocurrency.
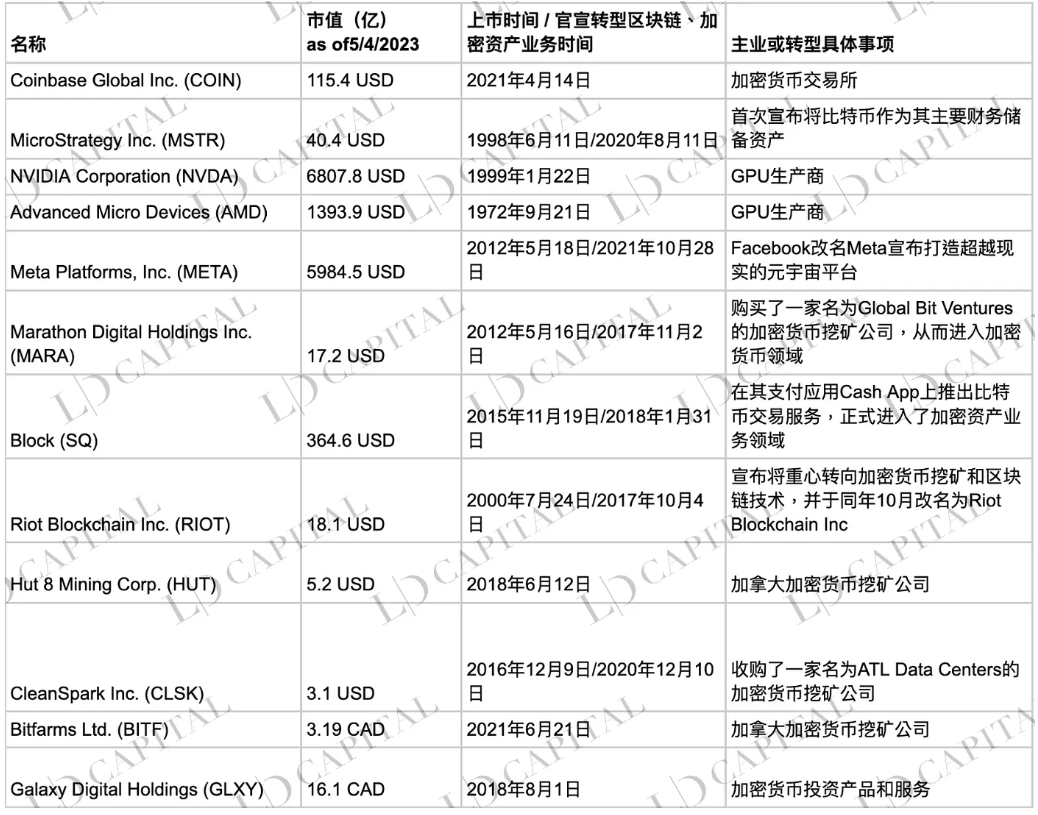
Table 1: Main blockchain or cryptocurrency concept stocks listed in the US and Canada
text
Table 2: Major blockchain or cryptocurrency concept ETFs listed in the US and Canada
The criteria for selecting investment targets are:
Business plans with a clear crypto ecosystem or companies that indirectly benefit from the development of the cryptocurrency industry, including crypto mining companies, mining equipment/chip suppliers, crypto financial services companies, or other financial institutions that primarily serve crypto-related clients , Metaverse Business Company, etc.;
Or the main investment strategy is to focus on digital currency spot or its derivatives fund products;
Or invest in the fund product shares of the above two.
Why choose crypto stocks:
Based on the moderate correlation between encrypted stocks and encrypted assets, establish encrypted market exposure in a safe, convenient and compliant manner.
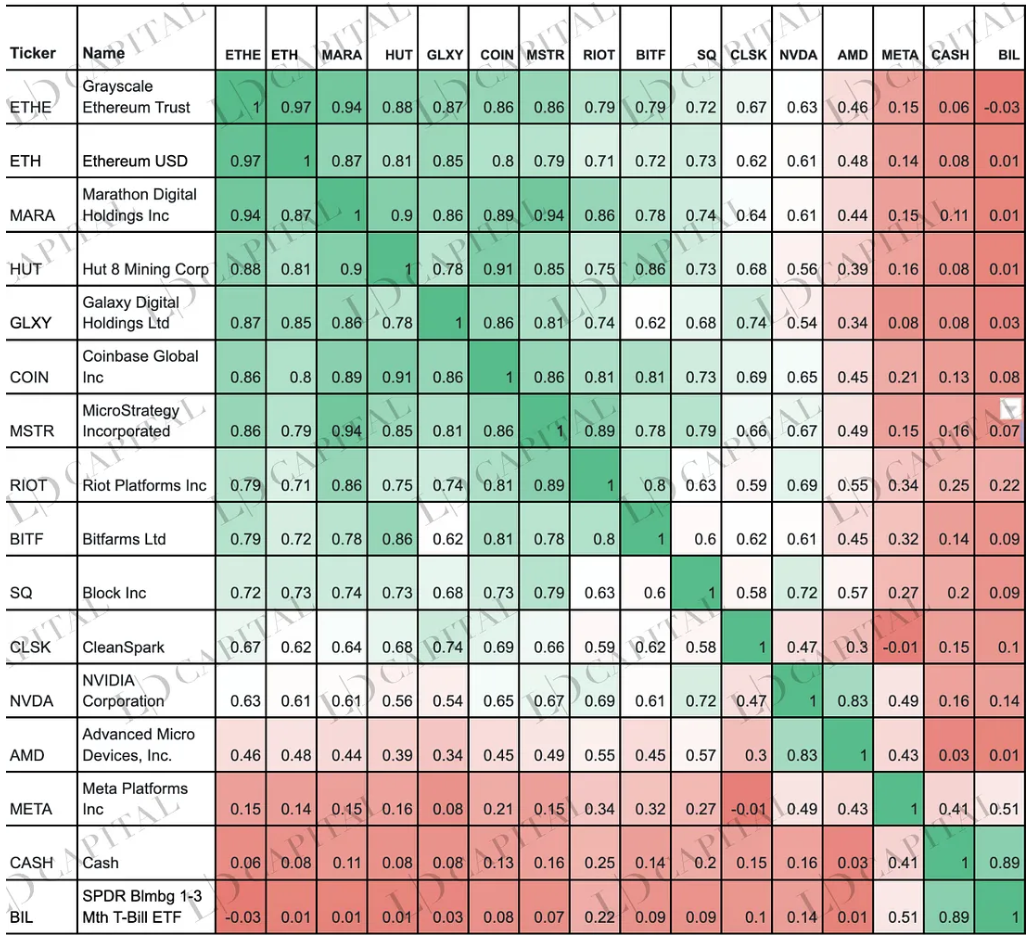
Correlations between crypto stocks and crypto assets typically range between moderate (0.40) and significant (0.90). Additionally, many crypto companies and cryptocurrencies have historically had a beta greater than 1. This amplified exposure can make crypto stocks an effective vehicle for gaining exposure to price volatility in the crypto market. In addition, not only ETHE, some encryption funds (such as BITW) have a market value lower than NAV due to similar structural problems, and they can also bet on the return of the discount.
Table: Monthly Return Correlations of Major Crypto Stocks and ETH, ETHE (5/01/2021 – 05/04/2023):
Note: The statistical period is subject to COIN stock trading in May 2021; CASH stands for cash
Derivatives Enhanced
Option enhancement is mainly based on the stock/ETF spot position of the owned stock/ETF to carry out the covered opening strategy, that is, selling the same number of Calls with a certain degree of out-of-value, can obtain excess returns relative to the spot when the market falls or rises steadily.
At the same time, after judging from the macro, technical and industry fundamental factors, the cover strategy can be adjusted. For example, use ratio call spread. Do calendar spread when the deadline structure is appropriate.

When it is necessary to protect the portfolio, the option structure can be formulated according to the level of implied volatility. For example, when the implied volatility is high and the wings are relatively high compared to atm, you can choose the put spread collar structure
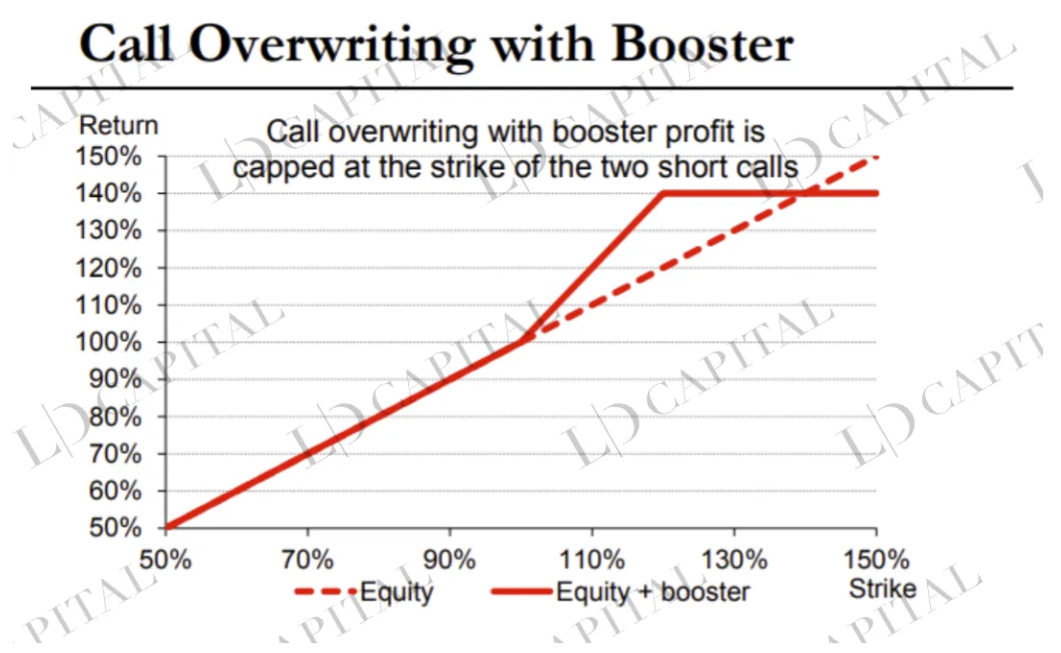
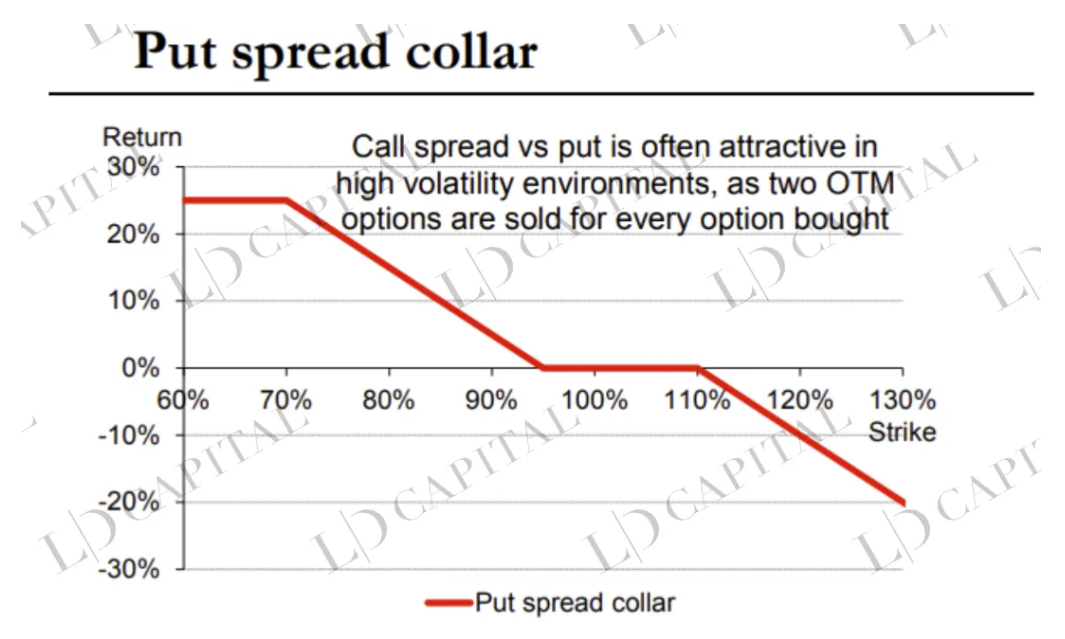
Option Enhancement Strategies Examples
It should be noted that the details of volatility changes, such as skew and term structure, will affect the specific option structure. These metrics require systematic real-time tracking. Below are some sample diagrams of option structures:
subjective timing
The analysis of macro + technical + industry fundamentals is also a source of excess returns for some spot position timing operations, but in general, as an ETHE enhancement strategy, position timing should be downplayed.
Specifically:
Macro timing: Comprehensively judge the overall future trend of the digital currency market through analysis at the macro, policy, and economic cycle levels.
Industry timing: enterprise/project research, event-driven, multi-factor stock selection, etc.
Technical timing: use graphic technical analysis to study and judge the continuity of the trend, and make appropriate adjustments before and after the key resistance and support levels.
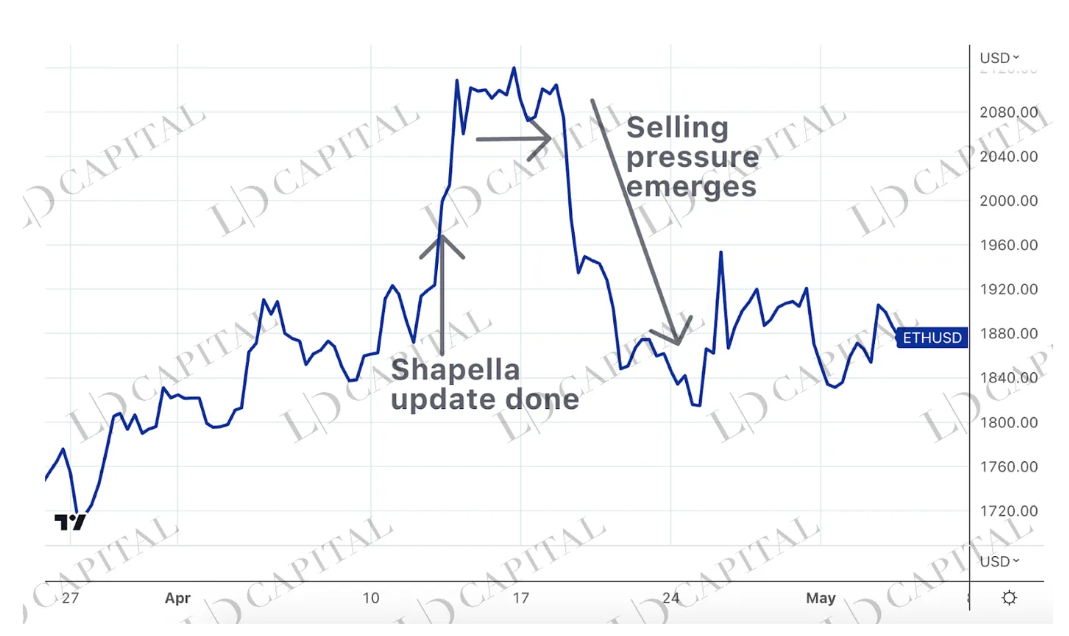
Among them, the unquantifiable macro research and judgment and event-driven part are the core that reflects the difference in the level of strategic managers. For example, the Ethereum 2.0 upgrade (Shapella) will end on April 13, 2023. However, what many people overlook is that a large number of ETH withdrawals will not appear immediately, and may take more than five days to arrive. If the price rises within a few days after completion, you can consider reducing the position appropriately, or take the operation of selling some call options to harvest the fluctuating value. The picture below shows the spot price of ETH. It can be seen that it soared around April 13, and then fell rapidly after five days of consolidation.
The purpose of the above strategy is mainly to:
Long-term holding of core assets in the encrypted market —— ETH is the core infrastructure of mainstream Web 3 applications. In addition to being able to undertake the liquidity spillover of legal currency wealth and diversify requirements like BTC, it will also have additional α brought by Web 3 ecological applications ;
Focus on the alpha of the stock - select more excellent companies to obtain excess returns higher than the market average return in the long run.
Capturing Volatility Returns – Converting black swan risk, long-short conversion volatility into index long-term “alpha” through options
first level title
Empirical Study
Next, we will conduct an empirical analysis of the proposed Grayscale ETHE-based index-enhanced fund strategy based on historical data to evaluate the effectiveness and feasibility of the strategy.
Based on the historical market from January 2020 to April 2023, as well as the following alternative targets (where OPRE is used to simulate the partial return of options), the monthly return statistics are carried out, and then the maximum and minimum allocation ratios of each asset are conditionally constrained, and based on The three methods to obtain the optimal combination configuration are:
Maximum Sharpe Ratio Optimization - Finding Optimal Risk-Adjusted Portfolios Lying on the Efficiency Frontier Based on Mean-Variance
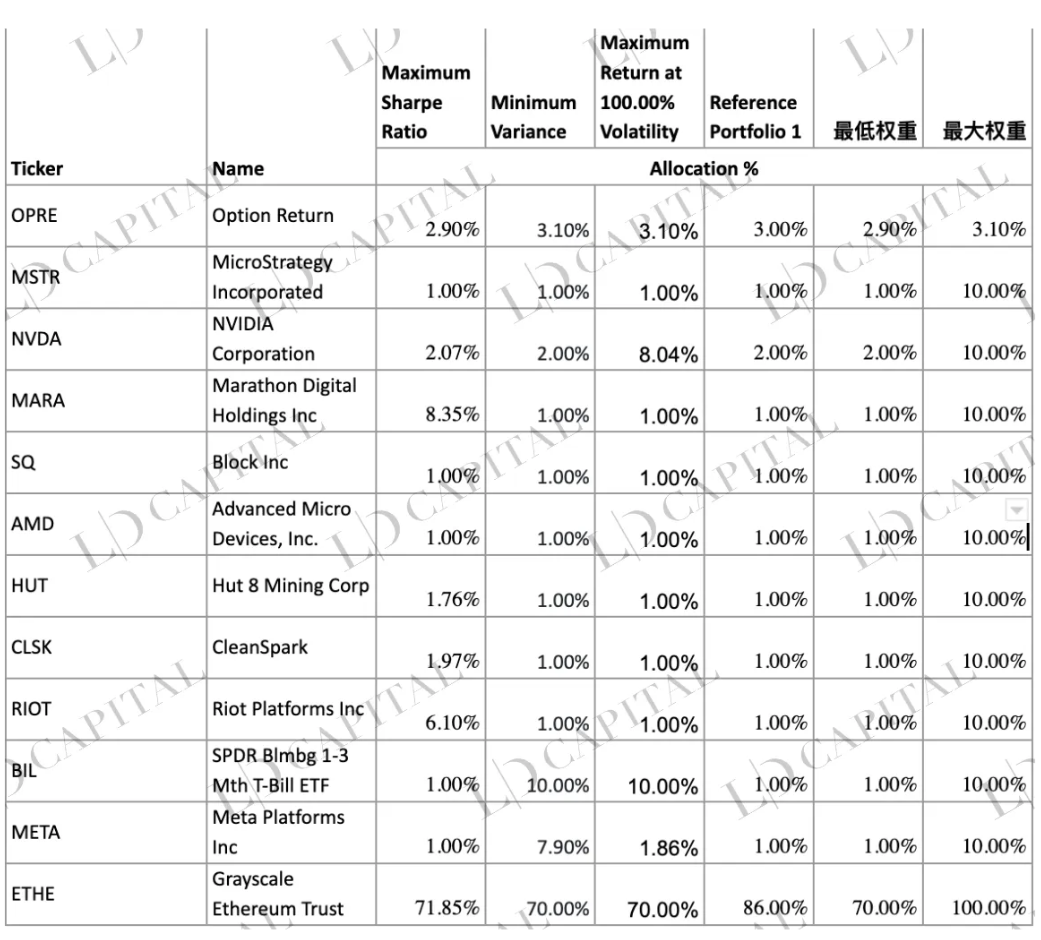
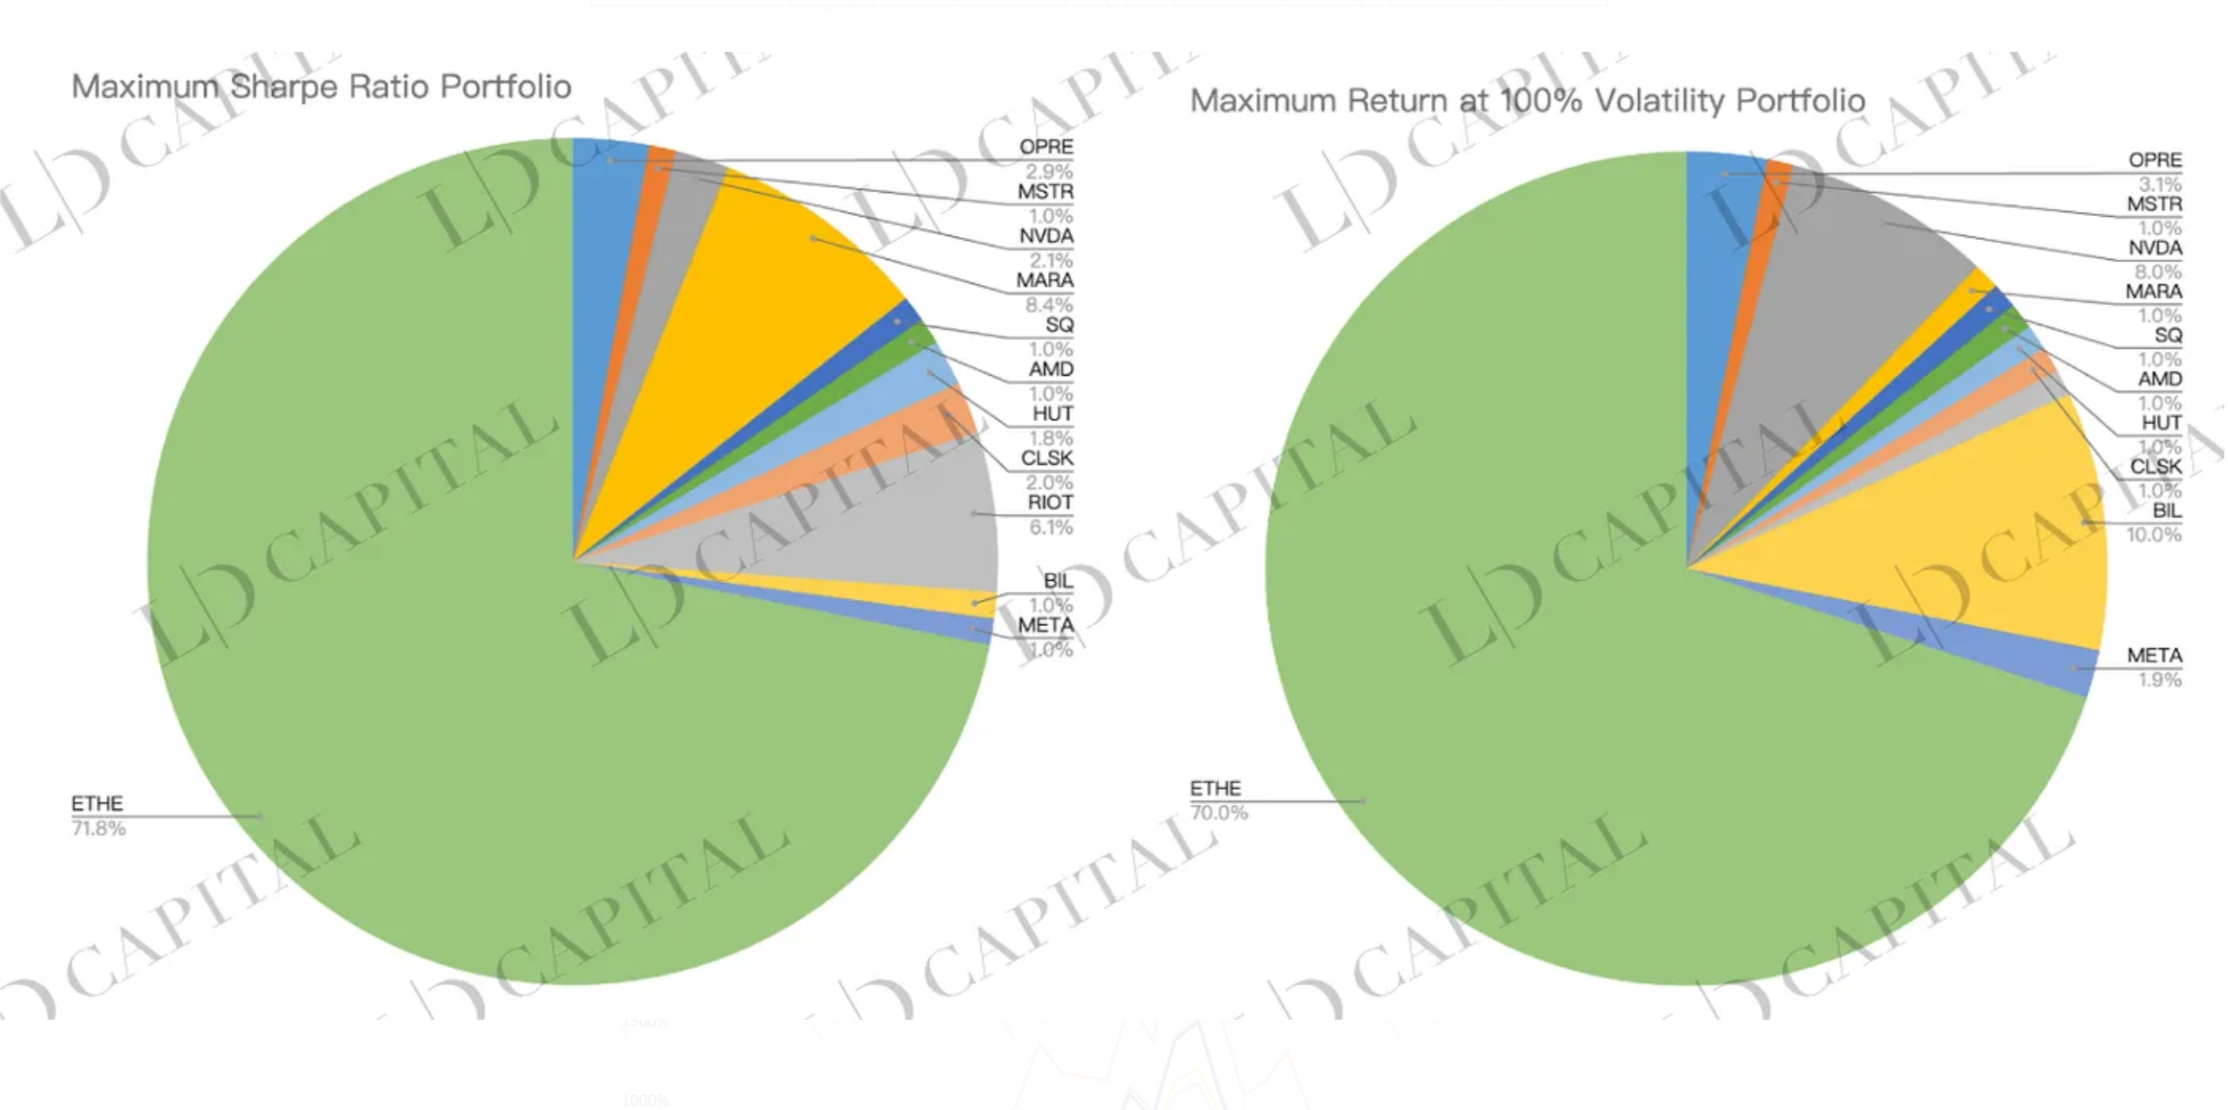
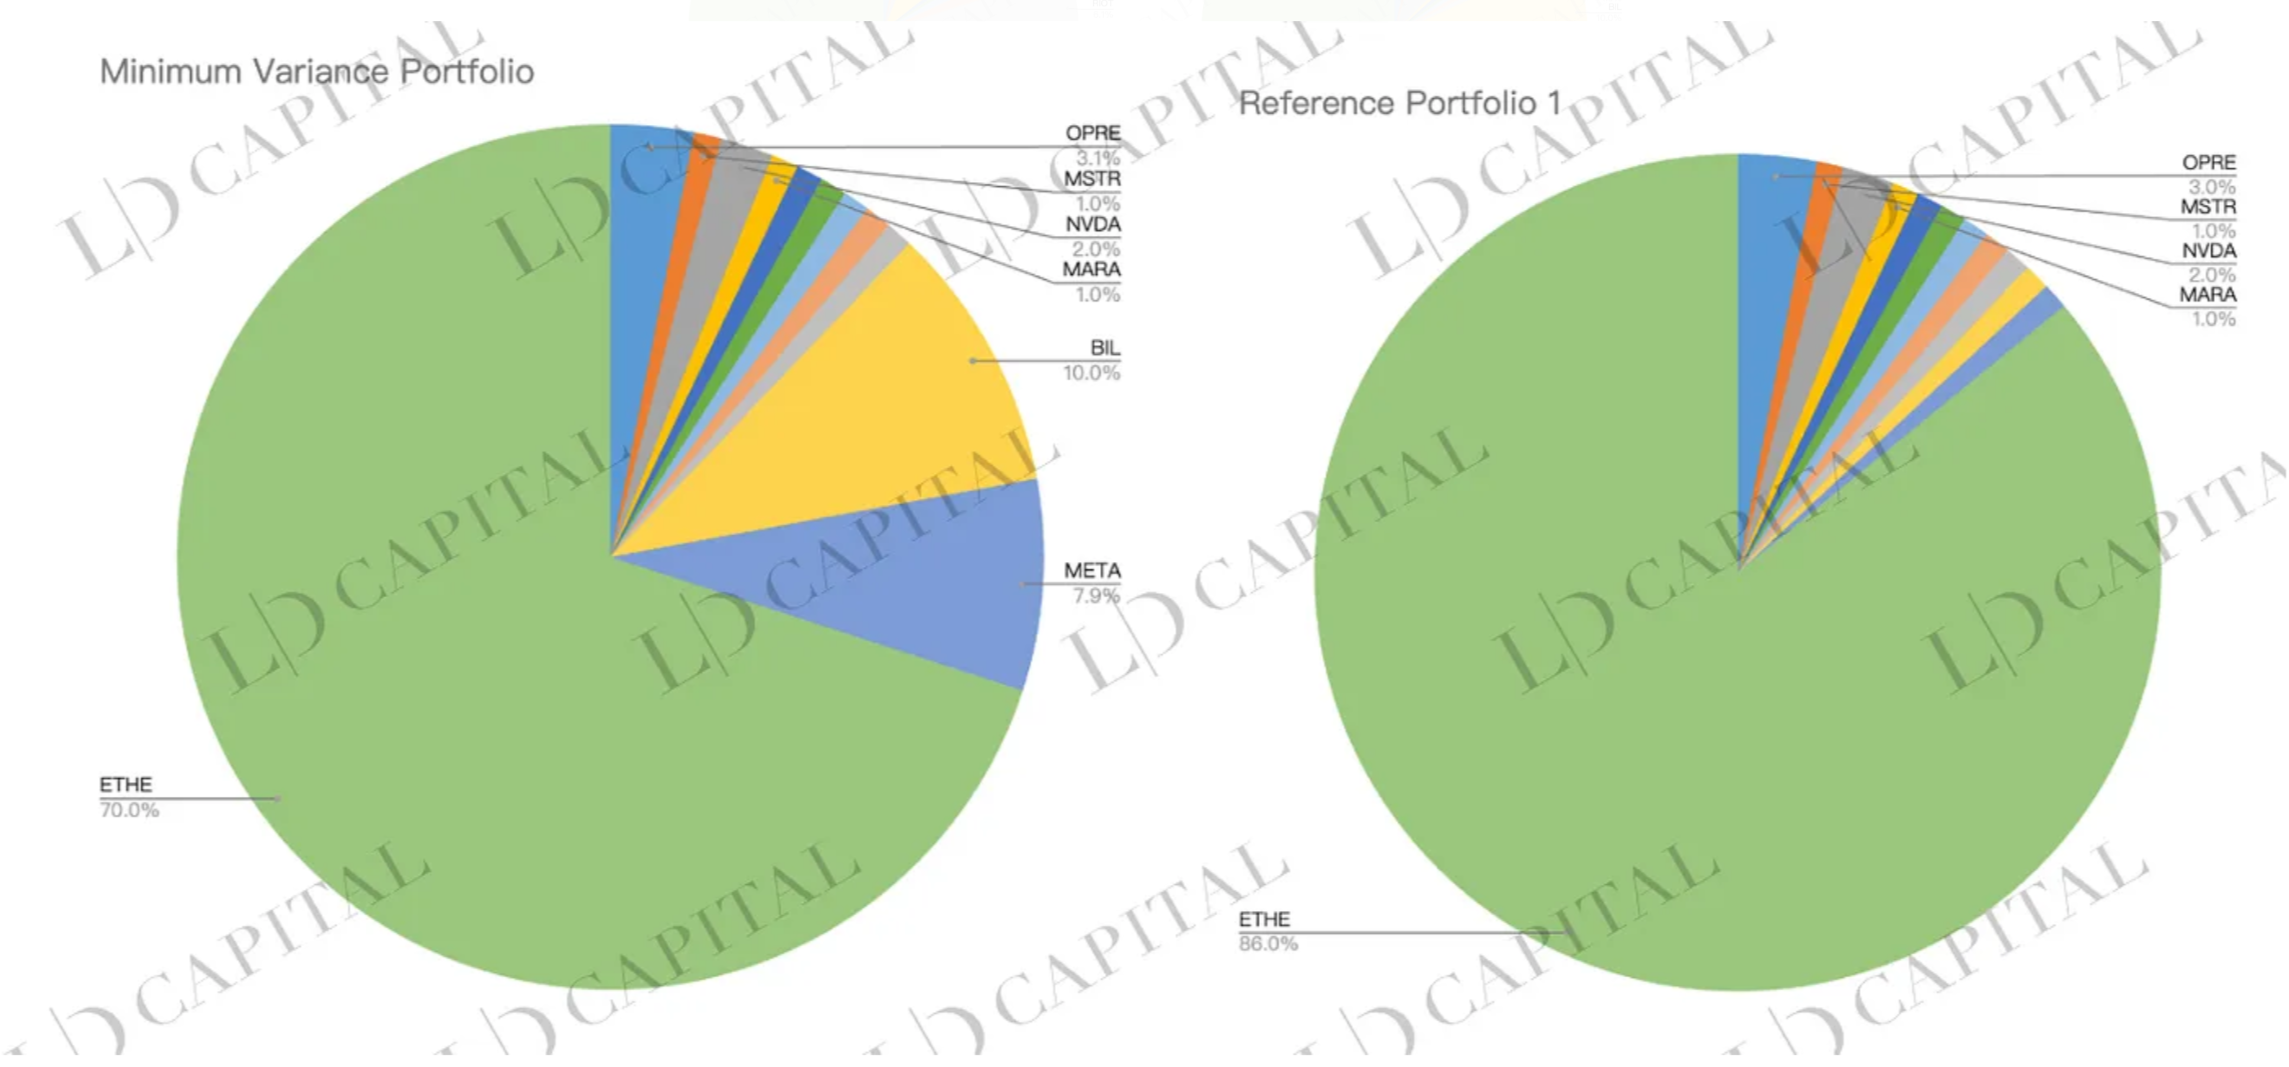
Minimum Variance - Among a group of assets, its portfolio risk (measured by variance or standard deviation) is the smallest
Maximize Return Given Annual Volatility Target 100% – seeks to maximize the expected return of a portfolio for a given level of risk
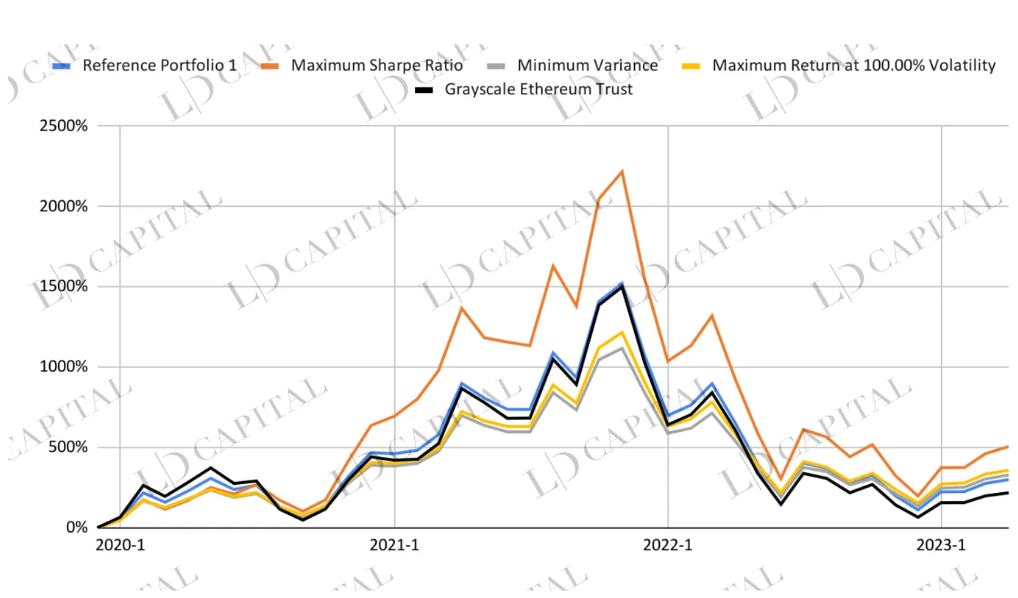
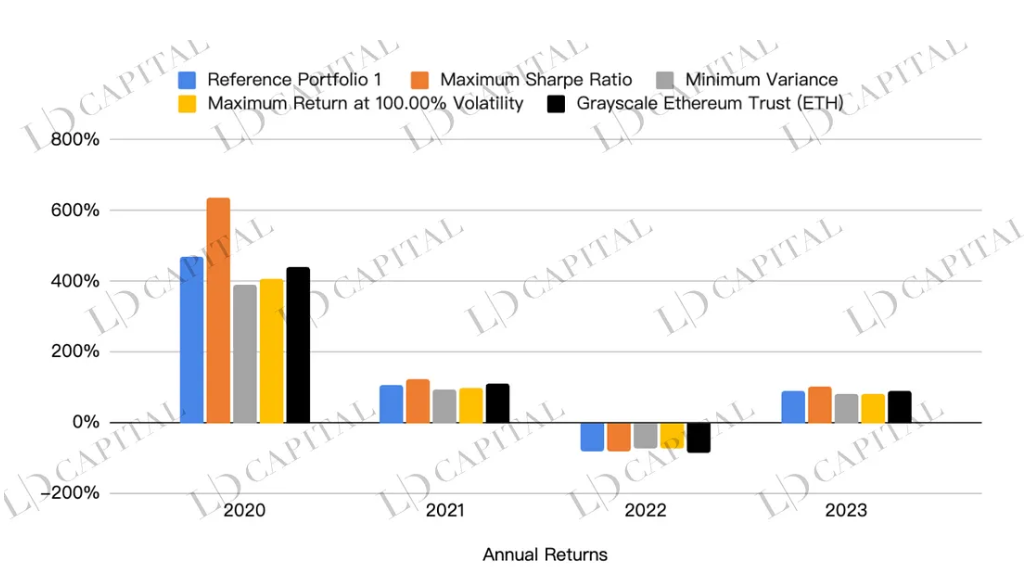
The income performance of each combination obtained from the test is as follows, where the ETHE performance of the black line and the blue line of the unoptimized reference combination 1 can be used as a reference comparison:
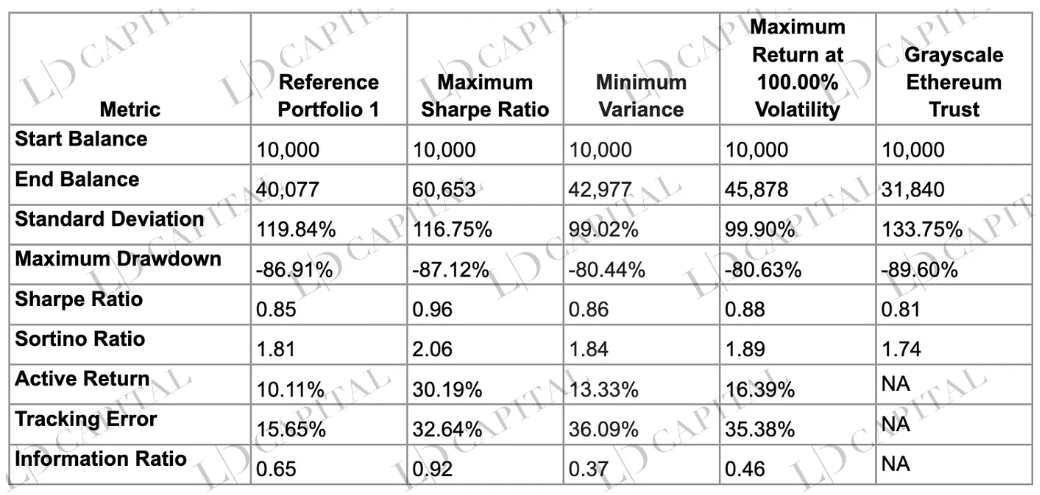
The following table shows the performance of four optimized portfolios, including the maximum Sharpe ratio, minimum variance, and maximum return at 100% volatility, compared with the single asset Grayscale Ethereum Trust (as a benchmark). It can be seen that the optimized The combination beats simply holding ETHE in almost all risk-return indicators, and the largest Sharpe ratio combination is superior to other combinations in terms of income, risk control and risk-adjusted returns:income:
risk:With a final balance of 60,653, the largest Sharpe ratio portfolio performed best for the given period, significantly outperforming the other portfolios and the benchmark asset. The minimum variance portfolio and the maximum return portfolio at 100% volatility have terminal values of 42,977 and 45,878, respectively, which are also higher than the benchmark asset's 31,840. This shows that the optimized investment portfolio is better than a single asset in terms of returns.
risk:From the perspective of standard deviation, the minimum variance portfolio has the lowest risk level (99.02%), while the benchmark asset has the highest risk level (133.75%). In terms of maximum drawdown, the minimum variance portfolio and the maximum return portfolio at 100% volatility have lower maximum drawdowns (-80.44% and -80.63%, respectively), while the benchmark asset has the highest maximum drawdown (-89.60% ). This suggests that the optimized portfolio also performs better in terms of risk control.
Risk-adjusted return:The Sharpe and Sortino ratios measure expected return per unit of risk and expected return per unit of downside risk, respectively. Looking at both metrics, the portfolio with the largest Sharpe ratio performed the best (0.96 for Sharpe ratio and 2.06 for Sortino ratio), which means that this portfolio outperforms other portfolios and benchmark assets in terms of risk-adjusted returns .
Active return, tracking error, and information ratio measure the excess return, risk, and risk-adjusted excess return of the optimized portfolio relative to the benchmark asset, respectively. From these three metrics, the maximum Sharpe ratio portfolio performed the best: an active return of 30.19% and an information ratio of 0.92 (the ratio of active return to tracking error). This shows that the maximum Sharpe ratio portfolio also has an advantage in terms of performance relative to the benchmark assets, and the portfolio can achieve certain excess returns under the condition of taking moderate risks.
Note: Optimization is based on monthly return statistics for selected portfolio assets over a given time period. Optimization results do not predict that allocations will perform best outside of a given time period, and the actual performance of a portfolio constructed using optimized asset weights may differ from a given performance target.
first level title