Glassnode: On-chain data review the "historical events" of Ethereum's merger


Original Author: Glassnode
A grand blockchain project has been successfully deployed: the merger of Ethereum. In Ethereum’s roadmap, converting the consensus mechanism from Proof-of-Work (PoW) to Proof-of-Stake (PoS) has always been an important content. The team has been actively working on this work since its creation, and now it has successfully deployed and completed an important milestone .
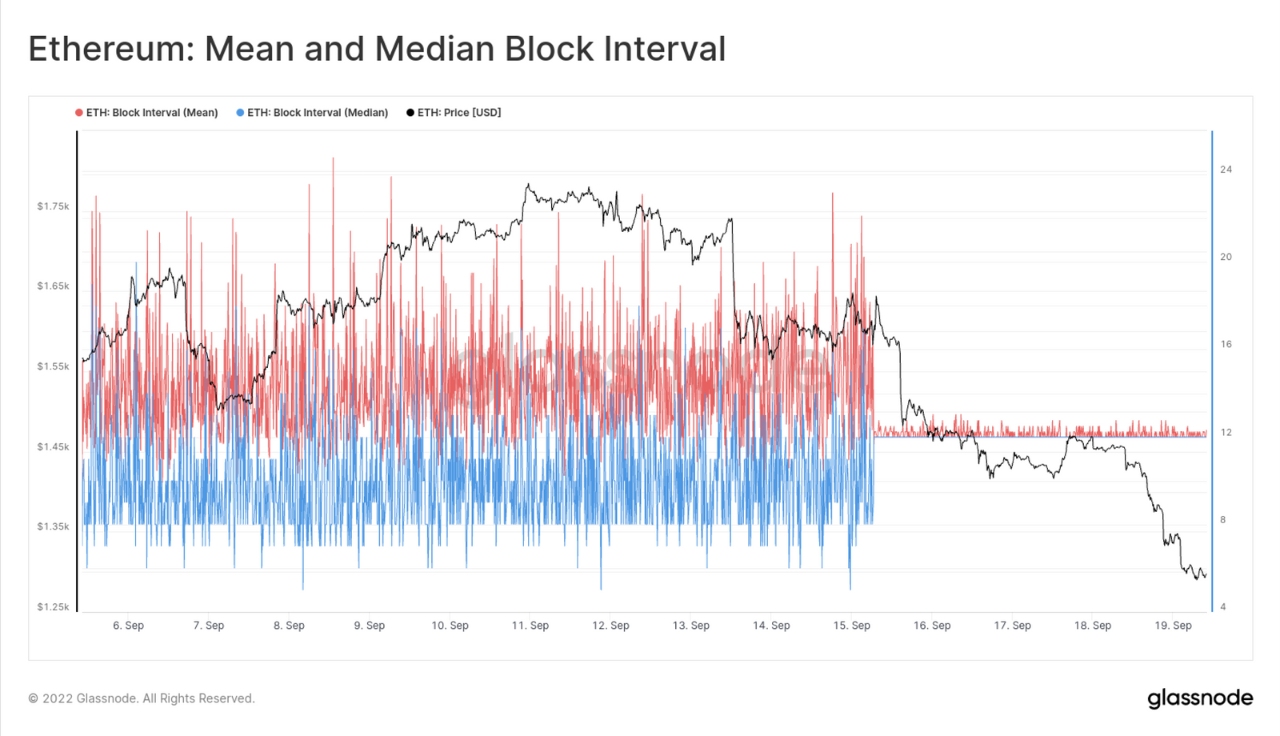
As of 06:46:46 UTC on September 15th, after the last PoW block was mined at the Ethereum block height of 15,537,393, the PoS beacon chain managed the consensus on the chain. The Ethereum merger was a success.
There’s no better graph to demonstrate the significance of this shift than looking at Ethereum’s average and median block times. We can clearly see the end of probabilistic, naturally variable PoW mining, and the engineering precision transition to PoS, enabling consistent 12 second block times.
In this report, we explore this historical event from both the exchange market and on-chain blockchain metrics. We will analyze the merger event from the following angles:
Positions of leveraged traders in the futures and options markets.
Effects of merge transitions on consensus parameters.
The total amount of ETH currently staked and the distribution of stakers.
image description

Source: Ethereum Foundation
As the Ethereum merger progresses, we are pleased to introduce a new set of Ethereum Proof of Acquisition metrics, workbench presets, and dashboards.
New PoS metrics:
Block production: slot height, epoch height, lost blocks, orphaned blocks
Network Stability: Participation Rate, Number of Authentications
Validator movement: number of voluntary exits, active validators, number of slashing events
Validator balances: total valid balance, stake validity, average validator balance, stake deposits.
Validator Economics: Estimated Annual Issuance ROI per Validator, Estimated Annual Issuance.
New Dashboards: Staking Consensus and Staking Supply Dynamics.
first level title
Rumors in, news out
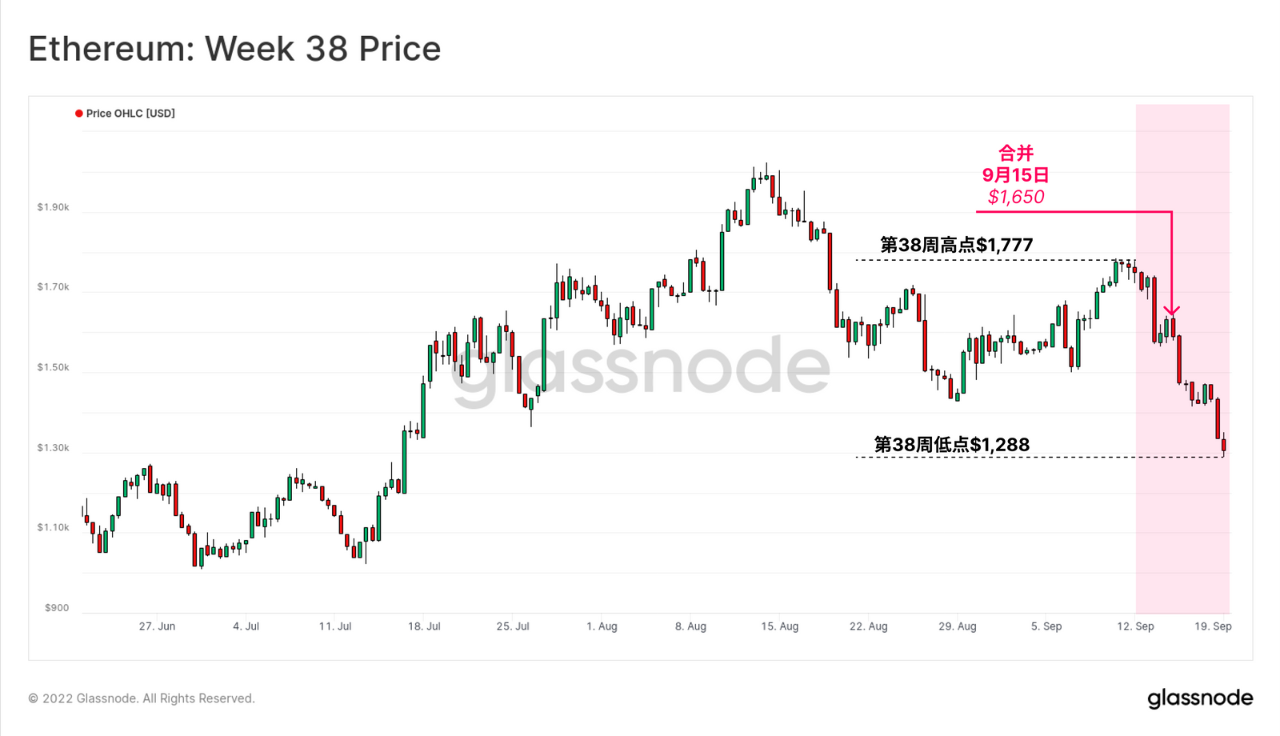
In our Week 32 Chain Report, we described how positions across the futures and options markets are well-hedged for a news event. In fact, investors have already started selling ether, from a high of $1,777 this week, to around $1,650 at the time of consolidation, before crashing down to a low of $1,288 on Sunday.
The market has given back virtually all of its gains since mid-July. Such a sell-off is due to a variety of factors, not the least of which is traders taking profits after seeing Ethereum’s recent underperformance. As one of the small group of assets that has performed well under prevailing macroeconomic conditions in recent months, it's perfectly normal for traders to sell after taking profits.
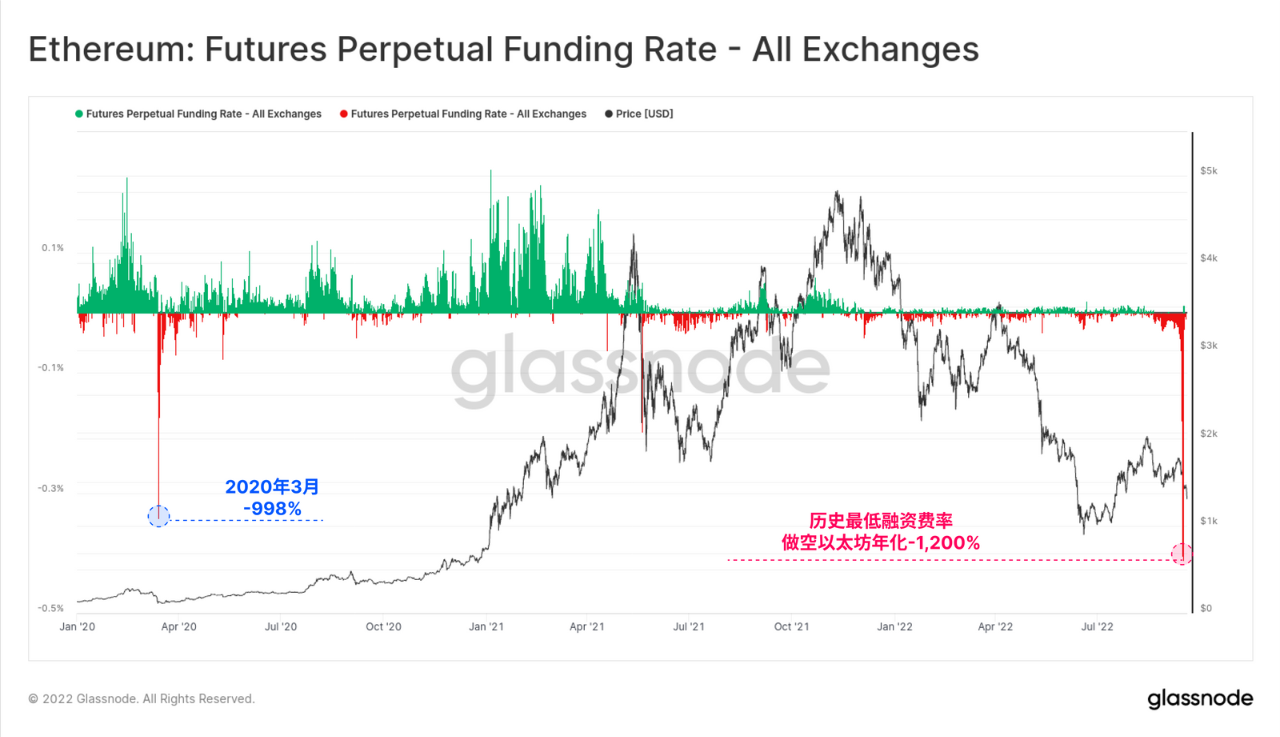
Until the merger, traders in the perpetual futures market were paying a staggering 1,200% annualized funding rate to maintain their short ETH positions. This is a new all-time low negative funds rate, surpassing the peak of -998% set during the March 2020 sell-off.
Funding rates have since returned fully to neutral, suggesting that most of the short-term speculative premium has dissipated.
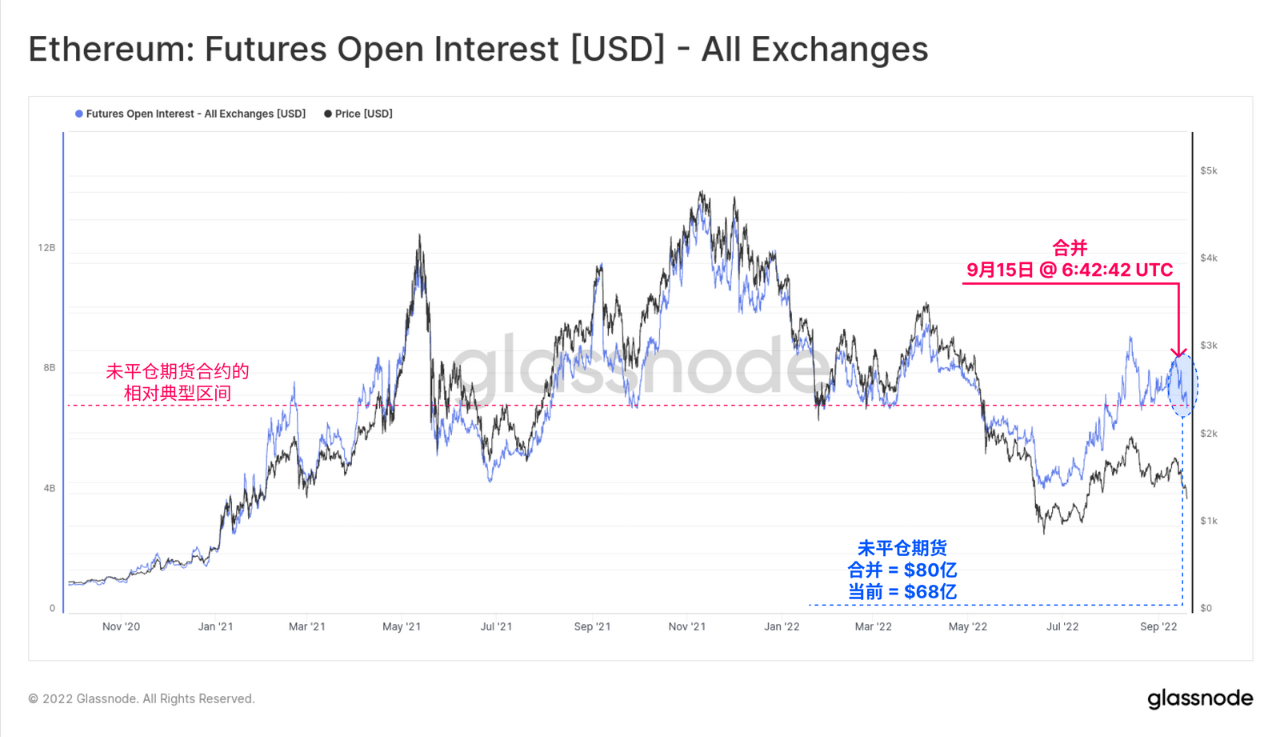
Post-merger, total futures open interest fell 15% from $8 billion to $6.8 billion, both extremes fairly typical of the 2021-22 market backdrop. However, to keep this change in context, we have to take into account the impact of changes in the Ethereum coin price, which affect the USD value of the Ethereum-denominated futures position size.
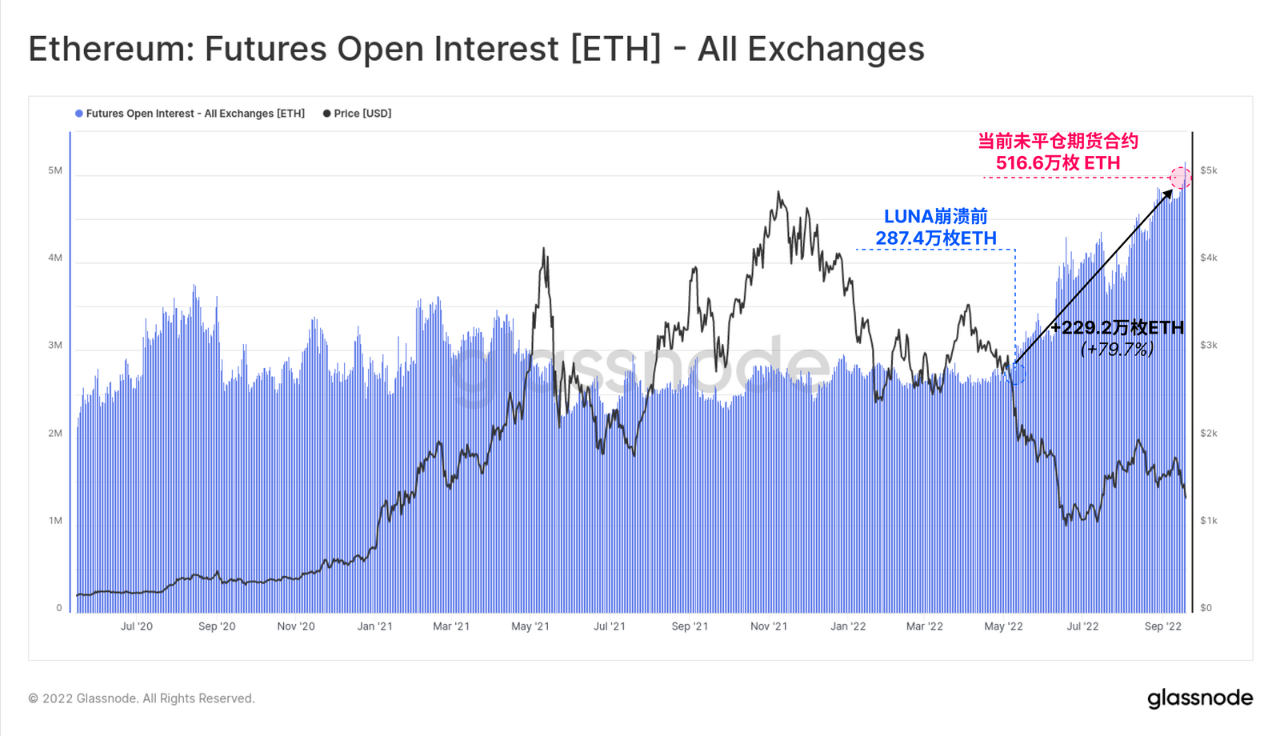
If we examine the Ethereum-denominated open interest, we can see that the futures open interest is actually at an all-time high, having increased by almost 80% since the beginning of May. Over the past week, futures leverage appears to have actually increased rather than decreased, suggesting that many risk-hedged positions have not been closed.
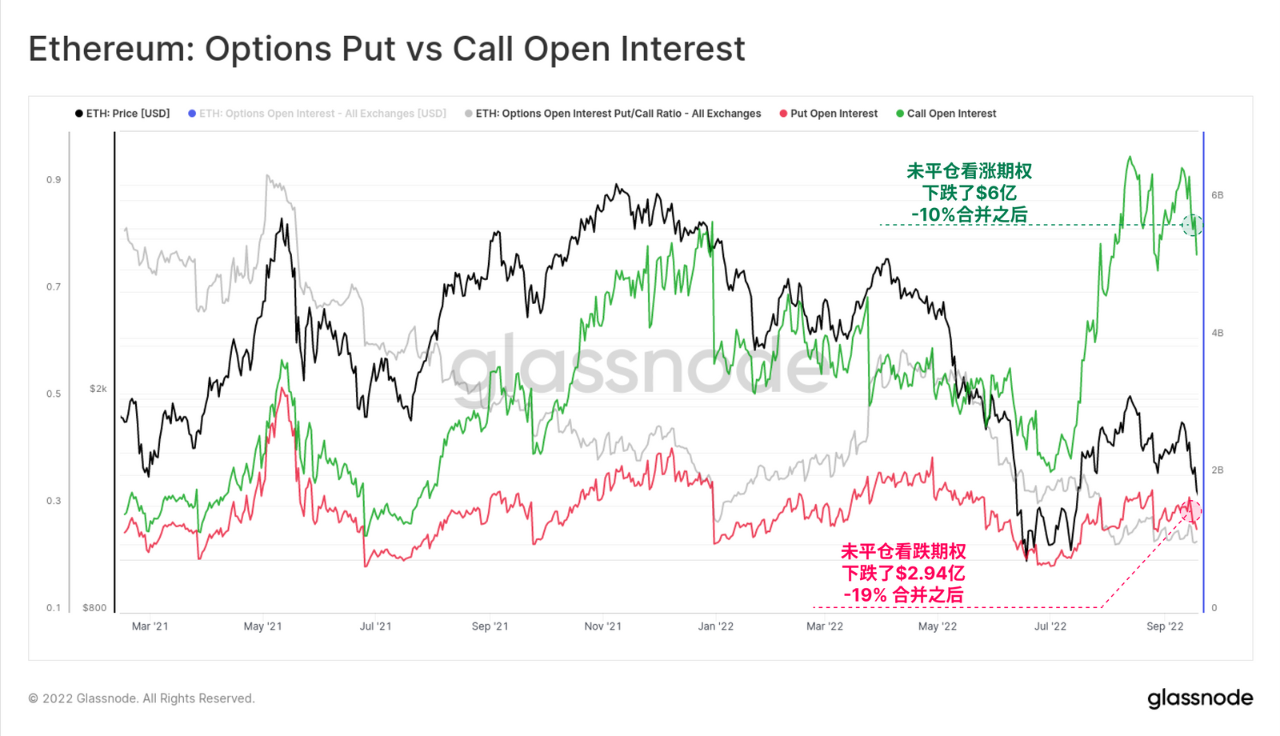
In the options market, there has been a lot of Ethereum speculation recently, with combined call options open interest down $600 million (down 10%). There is still a total of $5.2 billion in call option position value outstanding, which is still well above 2021 norms. The put option market has experienced a more pronounced relative decline of 19%, but this is still a much smaller net position value of $294 million.
first level title
Merge on chain
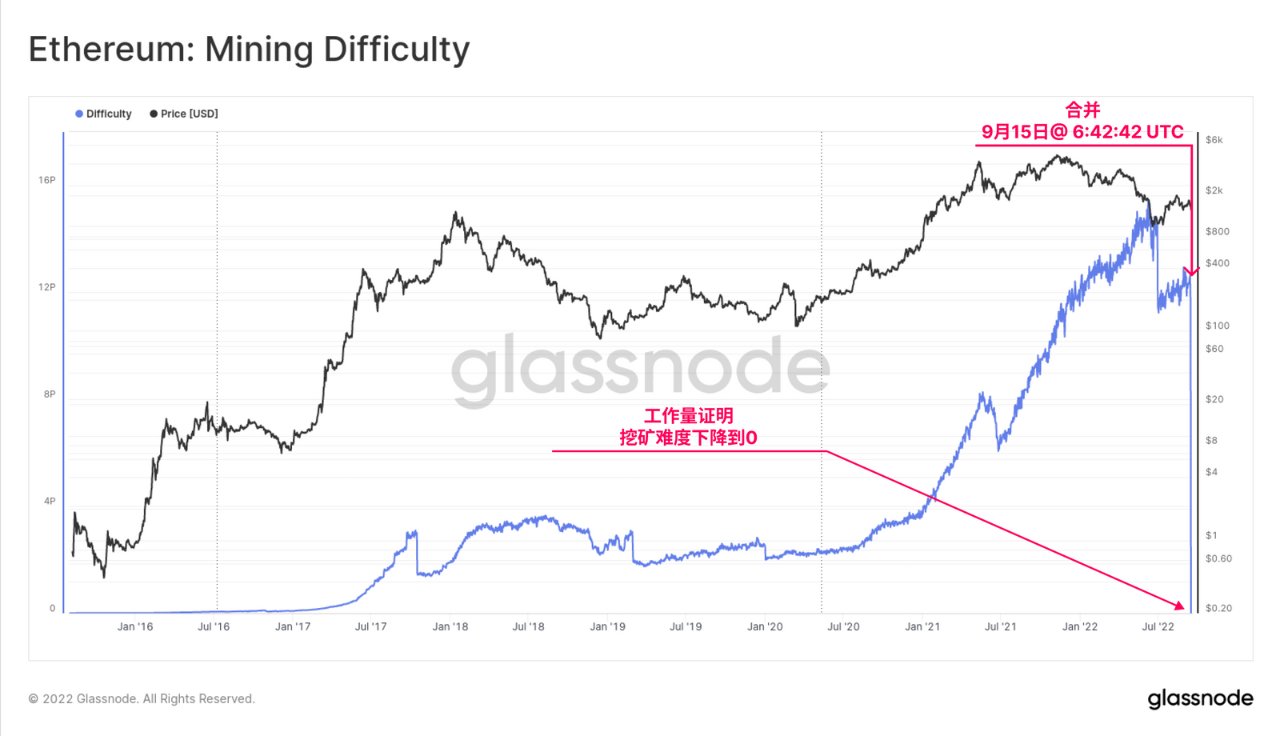
The end of the proof-of-work era for Ethereum marks the immediate drop in mining difficulty to zero following the merger. This process is instantaneous, there is no liquidation period, and no difficulty adjustments have occurred. The income of PoW miners has effectively evaporated, leaving a bunch of GPU and ASIC mining machines looking for new uses.
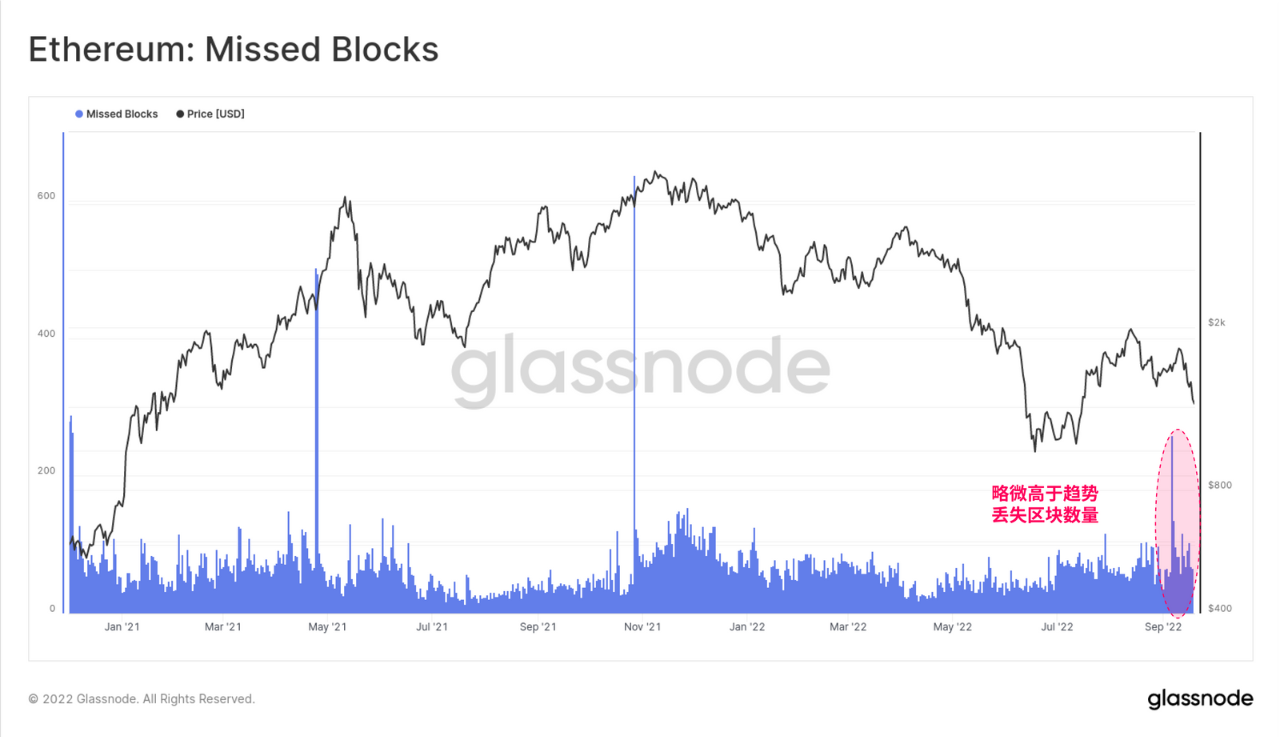
As an alternative to miners, PoS utilizes a pool of validators that are programmatically organized into committees and provide block proposers for every 32-slot epoch. Each 12-second slot has a validator assigned to the role of a block producer. However, in some cases, this validator may be offline or unreachable at the time, resulting in lost blocks.
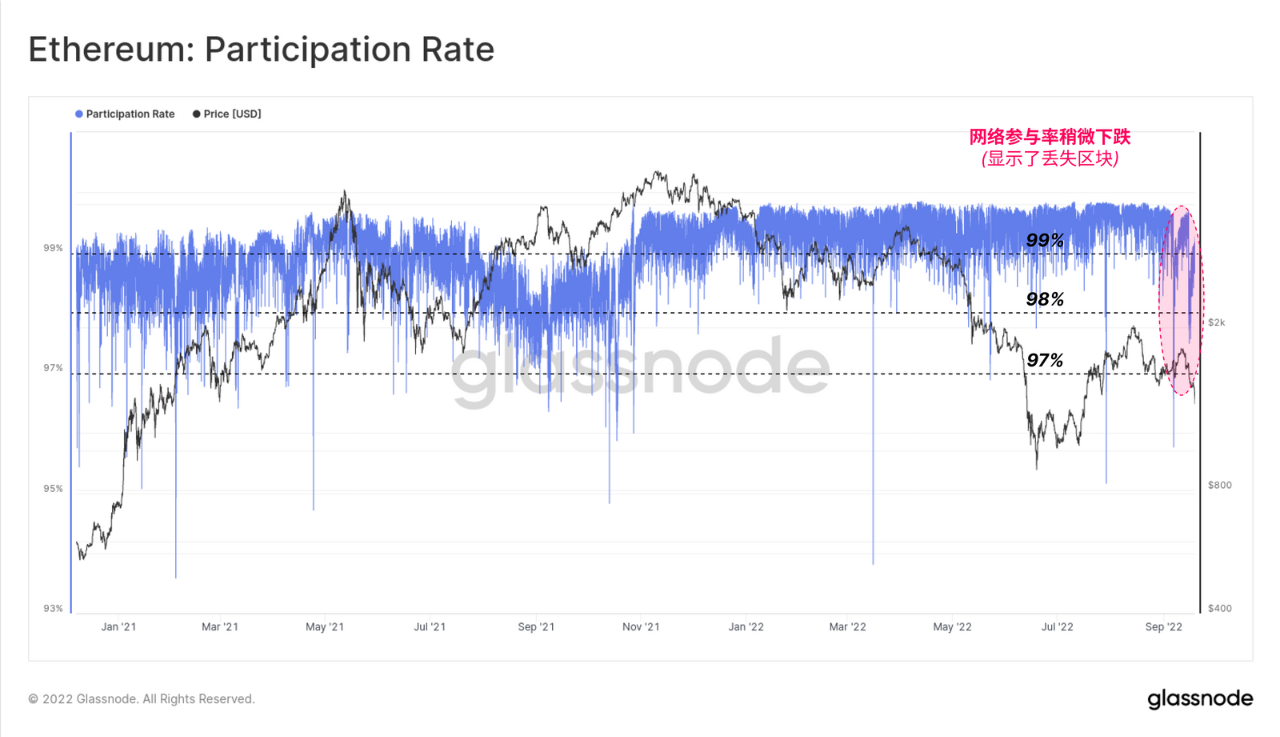
We measure this total validator network uptime using the participation rate metric, which is the ratio between the number of successfully produced blocks (i.e. not lost) and the total available slots. As the graph below shows, the participation rate is well over 99%, which has been the norm for most of the time on the Beacon Chain so far. This will be an interesting performance indicator, as more load is imposed on the chain and more validators enter the ranks.
In the weeks leading up to the merger, participation rates can be seen dipping slightly below the typical 99% level, at around 97.5%. After the merger, participation returned to levels above 99%, suggesting only a brief disruption to some subset of validators.
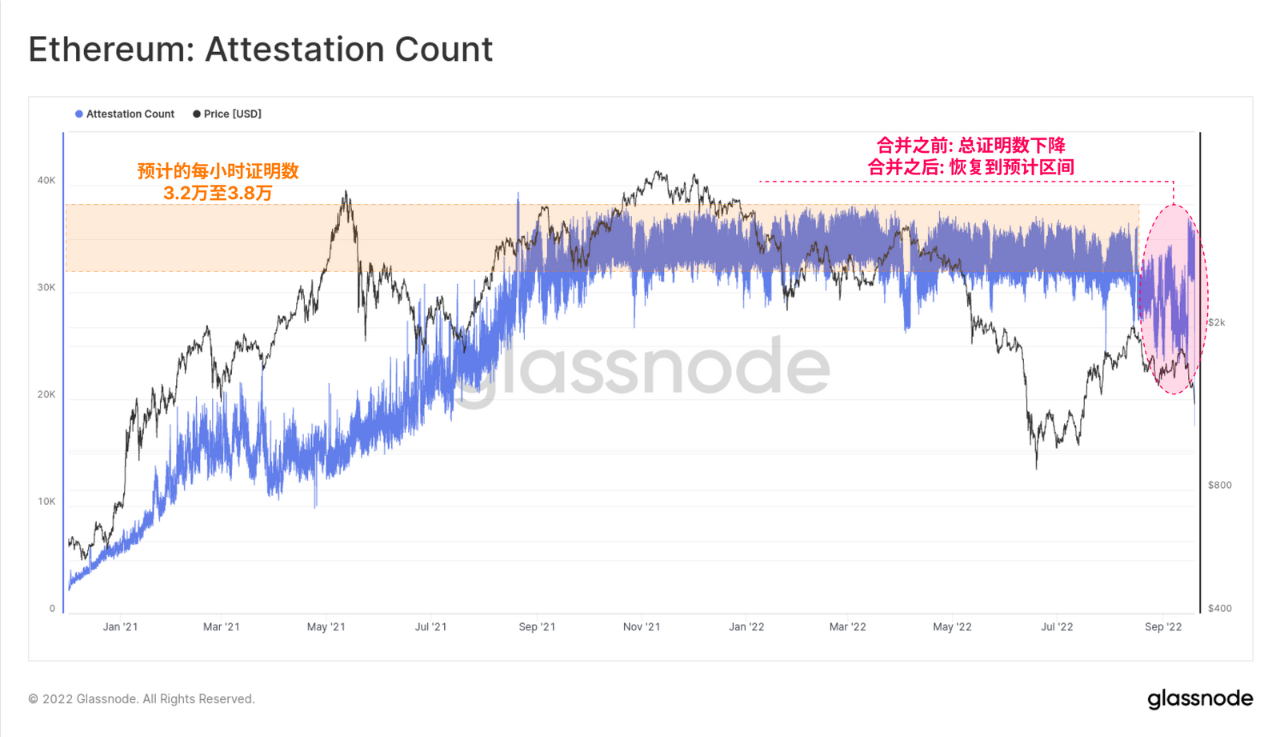
The number of verifications on Chain-tip also experienced a brief drop before the merger, but also recovered to the expected range of 32,000 to 38,000 verifications/hour. This could reflect a node issue with a larger staking operator, or it could be a software client bug that affected numerous validators in a short period of time.
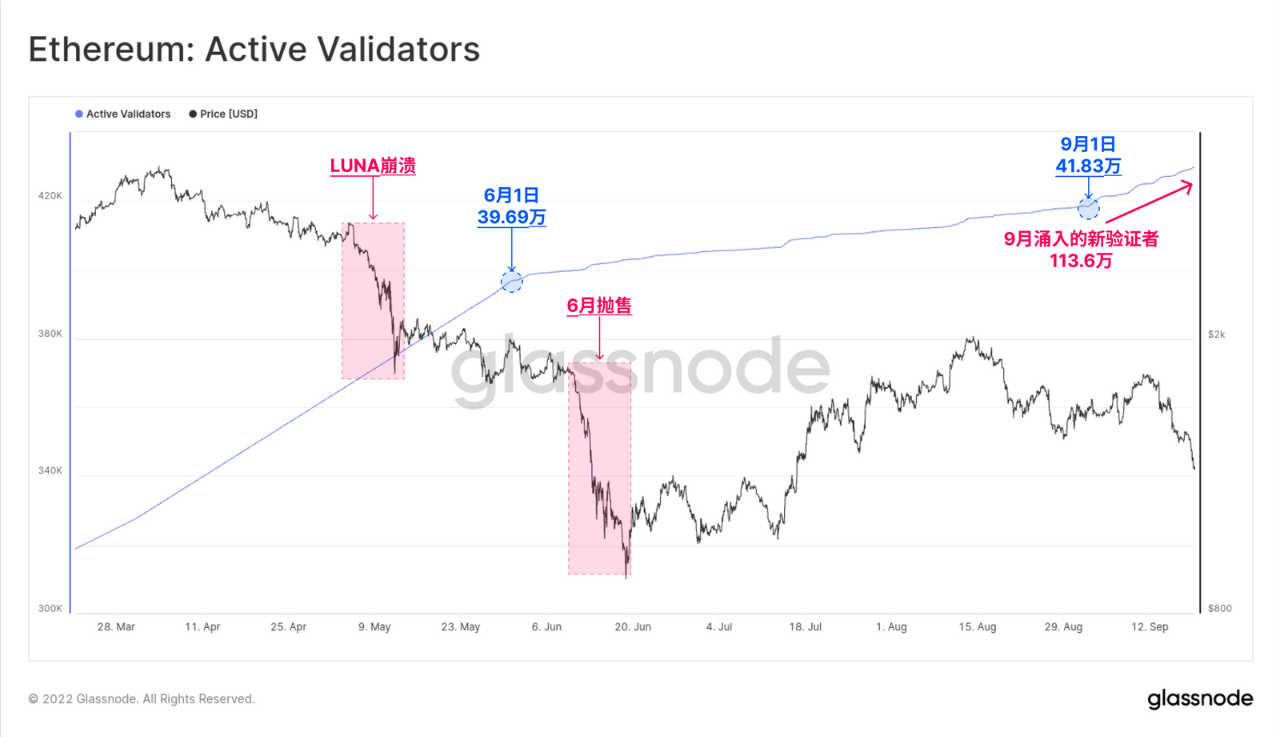
Ethereum currently has over 429,600 active validators on the network. The graph below shows the past 6 months, before and after the merge, you can see a clear increase in the gradient of new validators. More than 11,360 validators came online in September alone, a sign of growing investor confidence as the technical challenges of merging have been ironed out.
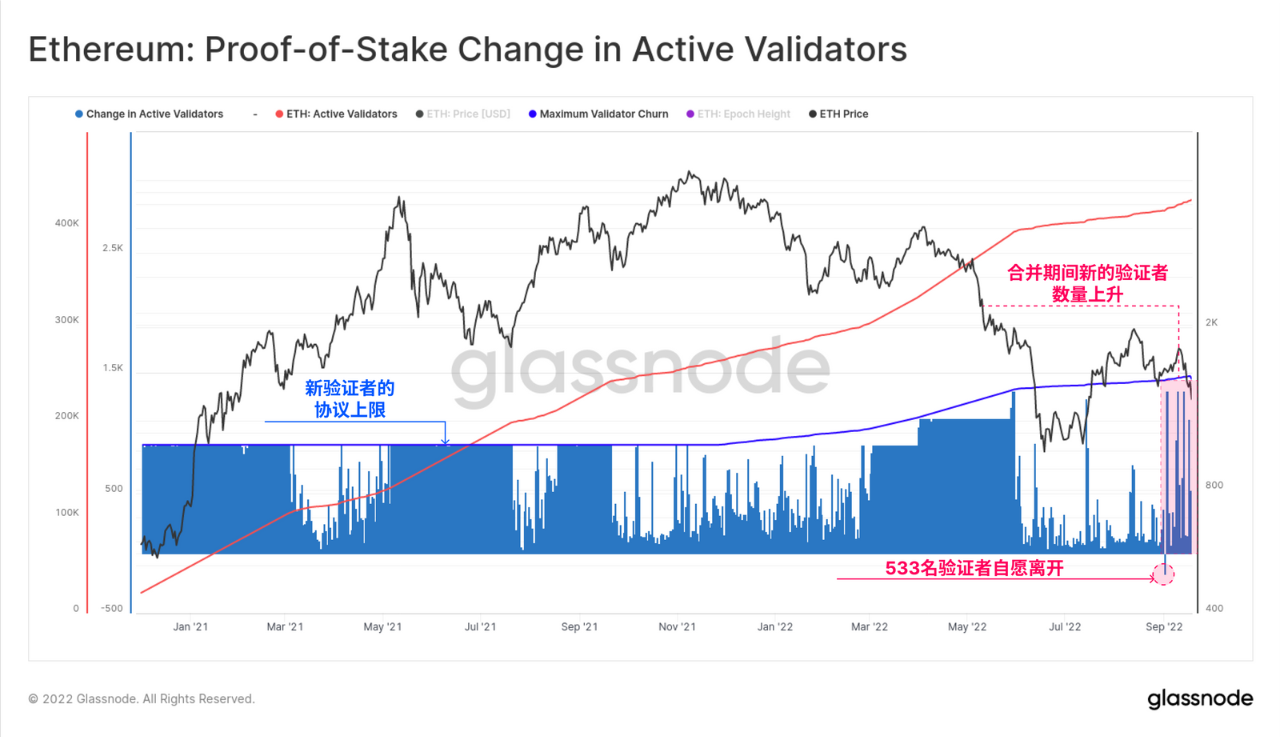
When validators choose to enter or exit the staking pool, they are limited by the total churn of validators per epoch set by the protocol. The chart below shows this cap (blue trace) and a somewhat barcode-style graph showing the daily change in active validators. We can see that there have been several periods in the past when the influx of validators hit the capped limit.
The recent burst of new validator activity in September was visible to the naked eye, although relative to the more period seen in 2021, this burst is still fairly mild.
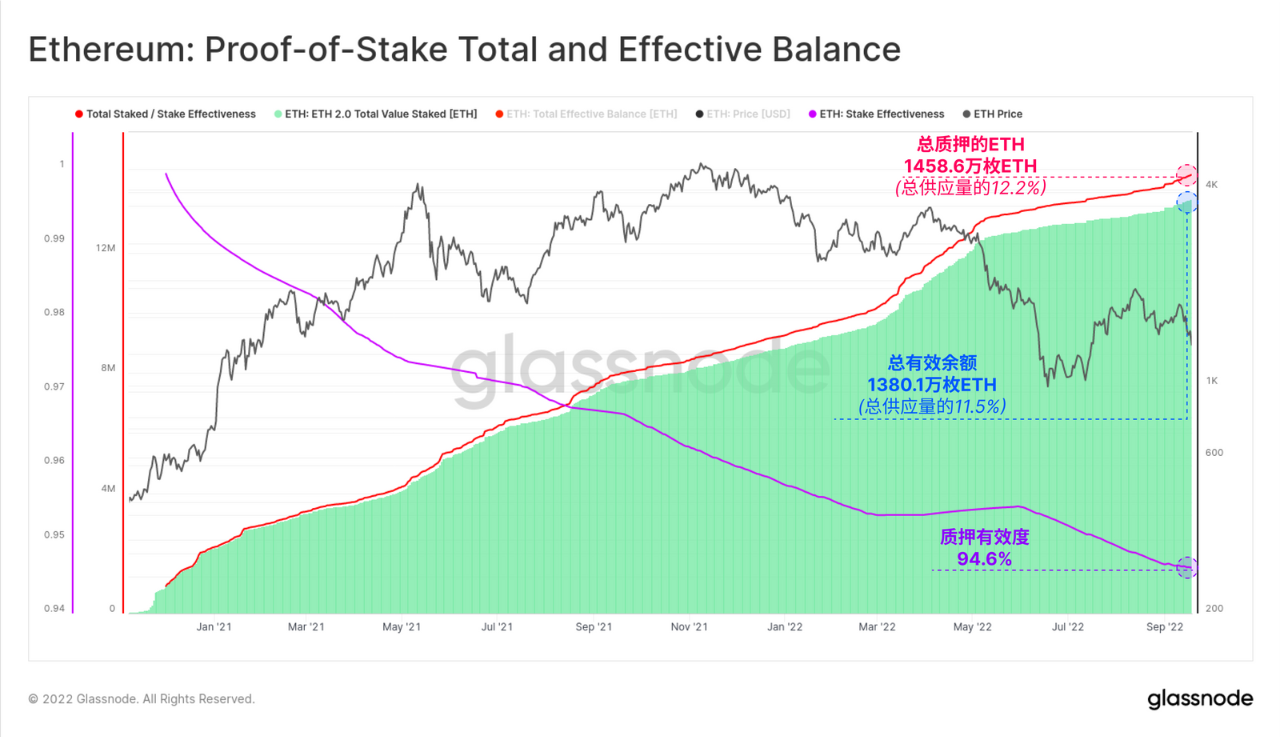
There are currently 429,600 active validators, and more than 14.586 million ETH is pledged, accounting for 12.2% of the total supply of ETH. The total amount of Ethereum will change over time because:
New deposits, and eventual withdrawals (after the Shanghai fork).
Income (increased balance) from block production and fees.
Inactivity leaks if validators frequently miss blocks or validations (decreasing balances).
Slash in case of malicious behavior (balance reduction).
The total staked balance differs from a new metric, the effective balance, which is the portion of Bitcoin actively participating in consensus. Each validator's valid stake is capped at 32ETH, and in the event of a leak or slash, the valid stake will be reduced to 1ETH increments below this value.
At present, the total effective balance is 13.801 million Ethereum, and the effective rate of pledge is 94.6%.
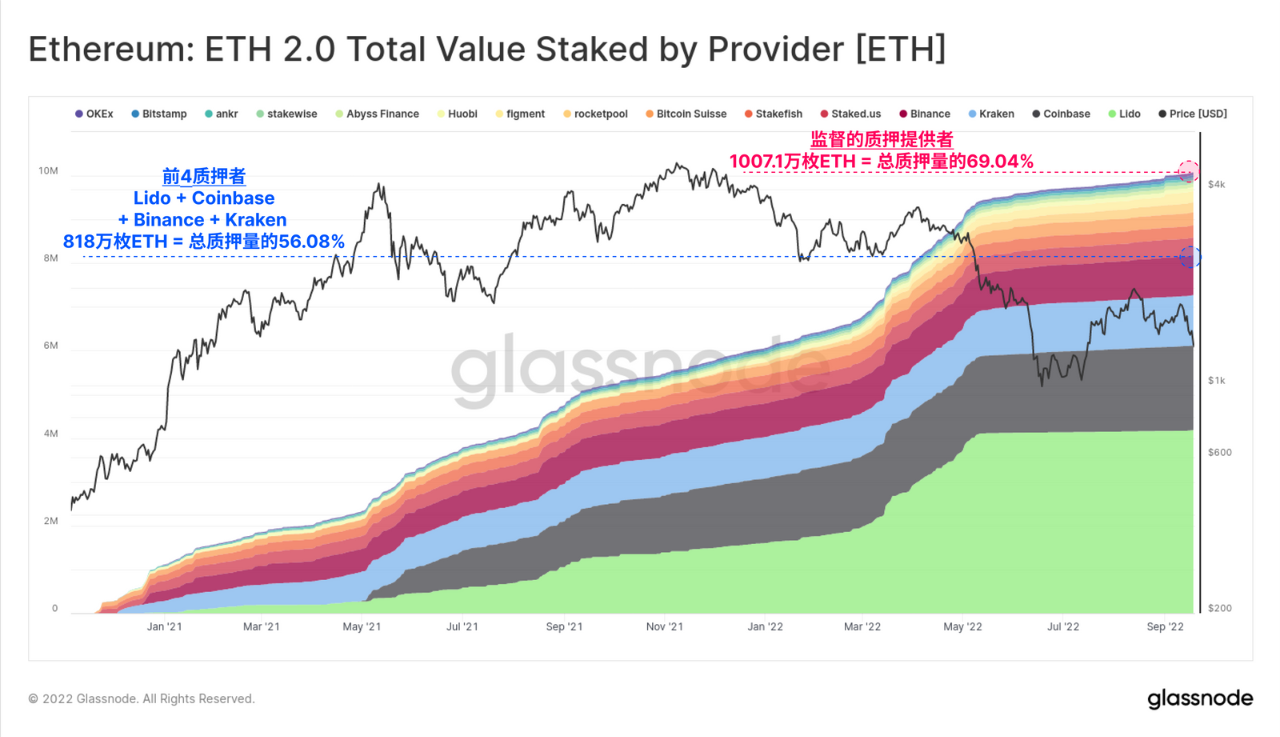
The vast majority of pledged ETH is hosted by multiple pledge service providers, and we have monitored these service providers, a total of 100.71 million ETH (accounting for 69.04% of the total). The top four service providers are Lido, Coinbase, Kraken, and Binance, and they manage a total of 8.18 million ETH, accounting for 56.08% of the total pledged volume.
first level title
supply reality
One of the most talked about parts of the merger is the massive drop in supply which, combined with the burn of EIP1559, is expected to cause some degree of ETH supply deflation.
Since the birth of the beacon chain on December 1, 2020, Ethereum actually has two sources of net supply, the PoW chain and the PoS chain. In August 2021, Ethereum implemented the EIP1559 protocol, which created a burn function on the PoW chain, which has now been transferred to the PoS chain.
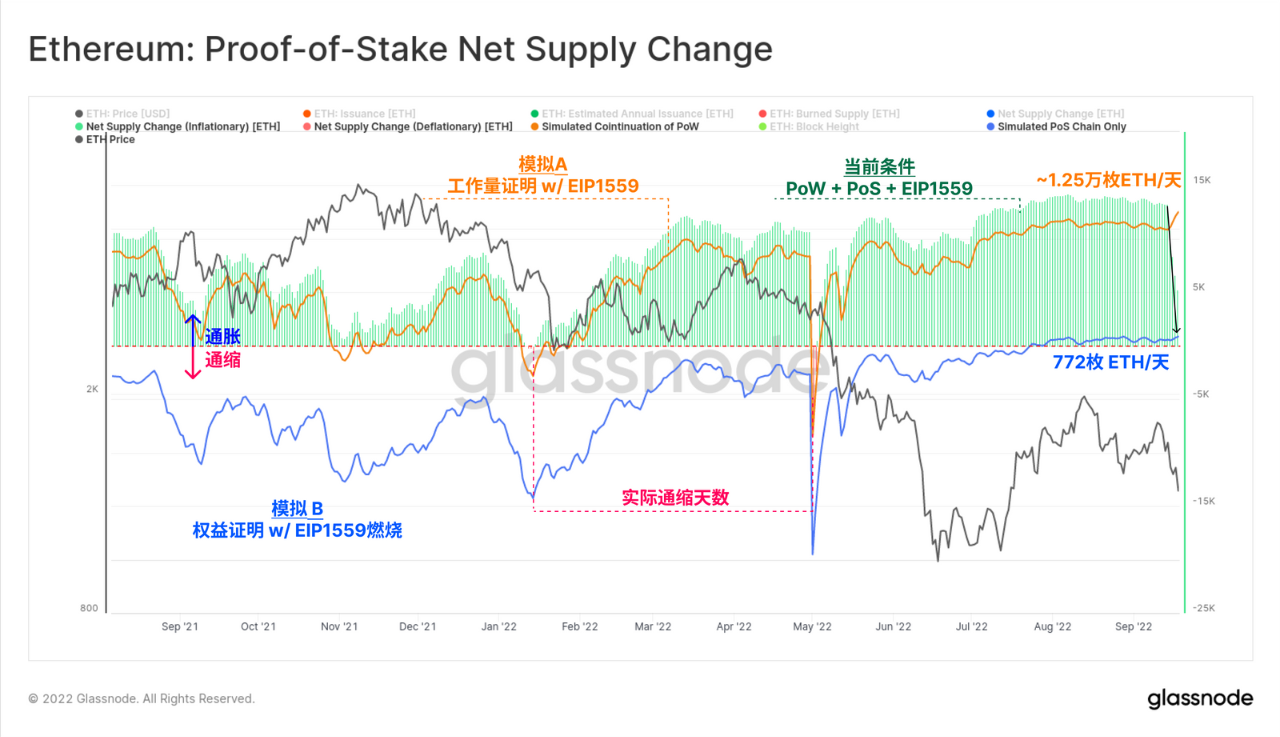
The chart below is a set of traces showing the daily net issuance of Ethereum under various simulated and real-world scenarios. This graph attempts to model and visualize the net daily change in Ethereum supply since the implementation of EIP1559.
The area chart shows the actual situation, which includes the issuance of PoW and PoS, and the burning of EIP1559, and illustrates the devaluation of PoW. A positive value 🟢 represents a period of net inflation (typical case), and a negative value 🔴 represents a net supply contraction (ETH supply contraction).
Simulate the continuation of the PoW blockchain 🟠, assuming that the PoS merge never happens, and assuming that 2 ETH are issued per block (for simplicity, uncle block rewards are ignored).
Simulating a PoS-only chain 🔵 , assuming the merge happens around the same time EIP1559 is released in August 2021, thus ignoring all PoW block rewards after that date 🟠. This trace is now consistent with the merged area chart.
It can be seen that the issuance rate drawn by the PoS model 🔵 is greatly reduced, which is ~772 ETH/day, while the PoW model is ~12,500 ETH. However, we note that the current net issuance of Ethereum is still inflationary. This is mainly due to the extremely low level of blockchain congestion and low network utilization at the moment.
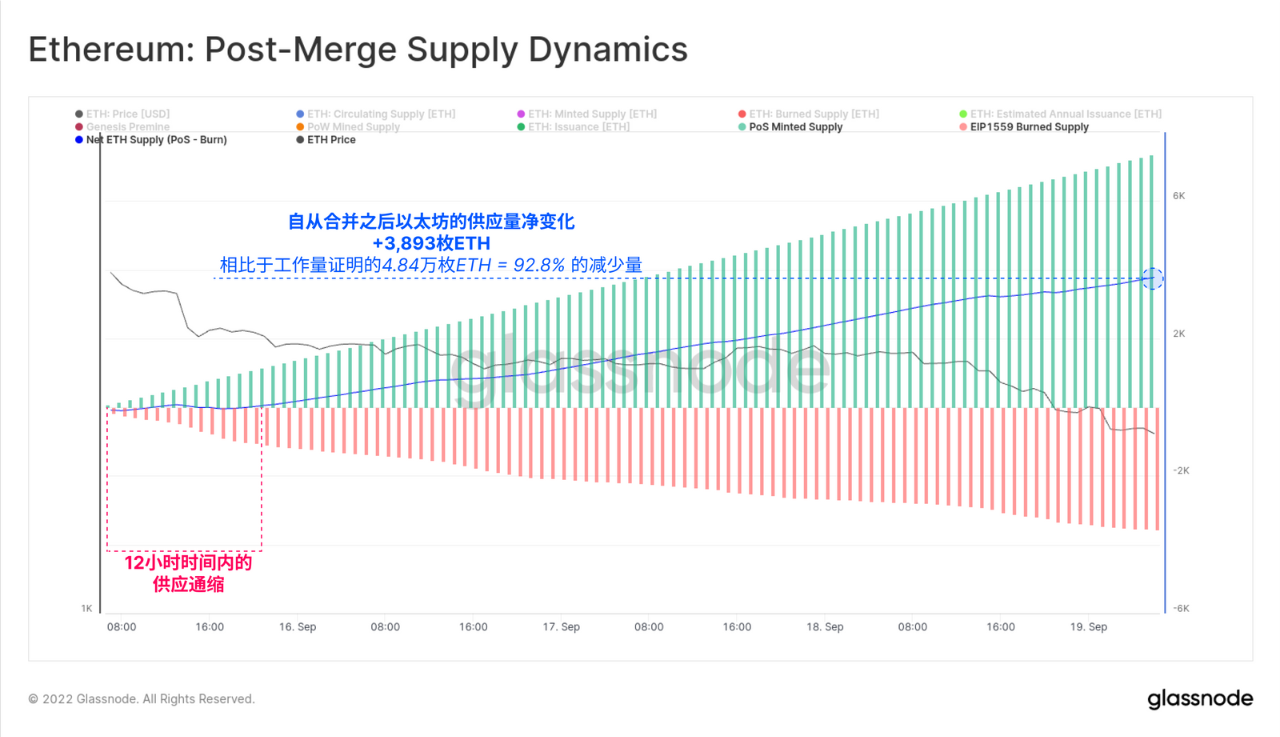
Zooming in on the 1-hour chart from the merger event, we can calculate the net supply reduction that has occurred. From merge to time of writing (4 days after the fact):
The net issuance of the PoW Ethereum chain should be around 48,400 pieces.
The PoS chain has issued 3,893 Ethereum. Compared with the abandoned system, the output of the PoS chain has been significantly reduced by 92.8%.
first level title
Summary and Conclusion
The Ethereum merger was a success, at least a historic one. Years of dedicated research, development and strategy have now come together to achieve a remarkable feat of engineering.
Original link