US stocks still have "deleveraging room," JPMorgan: It will take three months to return to pre-April levels


- Core Viewpoint: A JPMorgan report indicates that the deleveraging process initiated by US investors since June is still ongoing. Leveraged ETFs, options, and margin accounts all have further room for deleveraging, which is expected to suppress US stocks for several months. However, the medium to long-term stock supply and demand structure remains positively supportive.
- Key Elements:
- Leveraged ETFs: Volatile market conditions can erode their scale, serving as a built-in "self-correcting" mechanism. Since peaking, the total scale of all leveraged ETFs has shrunk by 13%. It is estimated that it will take another three months of volatile trading to recover to pre-April levels.
- Options Market: The retail bullish call option buying indicator hit a peak of approximately 14 million contracts on June 5, matching historical highs. After this indicator peaks, tech stocks typically undergo several months of adjustment, with the bottom corresponding to the indicator falling to between 2 million and 4 million contracts.
- Margin Accounts: Current leverage levels are at historically extreme highs, comparable to peaks seen in late 2021 and mid-2018. Although there has been a slight recent pullback, significant deleveraging is still required to avoid acting as a major resistance.
- Hedge Funds: Equity long/short hedge funds may have reduced their semiconductor exposure in July. Both their correlation with semiconductor stocks and their leverage levels have shown a downward trend.
- Supply and Demand in H2: Retail funds are the biggest source of support, with estimated full-year inflows exceeding $1 trillion, and approximately $482 billion in the second half of the year. Estimated net demand for the second half is approximately $197 billion, which will provide long-term support.
Original Author: Long Yue
Original Source: Wall Street Insights
The shadow of US stock market deleveraging has not yet dissipated.
According to news from the Flow Desk, the JPMorgan Chase global market strategy team pointed out in its latest report released on July 15 that the investor deleveraging process initiated in the US in June is still ongoing. There is further room for deleveraging in three areas: leveraged stock ETFs, the options market, and margin accounts, which will continue to suppress stock market performance in the coming months.
They estimate that it will take approximately three months of volatile market conditions for the ratio of leveraged stock ETF size to the market value of the underlying assets to return to pre-April levels.
Leveraged ETFs: Self-Correction Mechanism Activated, but a Long Road Ahead
The problem with leveraged stock ETFs is essentially a mathematical trap.
The bank explained the logic: Suppose the underlying index falls by 10% on a given day and rebounds by 11.1% the next day back to the original level. A 3x leveraged ETF would lose 30% on the first day and gain 33.3% the next, resulting in a net loss of 7%. In other words, volatile market conditions themselves will erode the size of leveraged ETFs, acting as a built-in "self-correcting" mechanism.
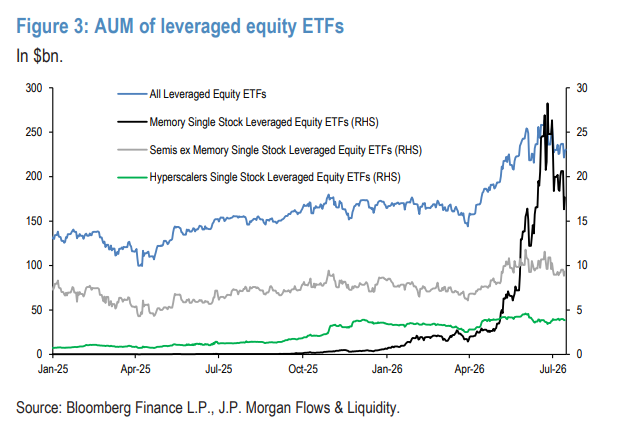
The data confirms this. Analyst data shows that since its peak, the size of the leveraged semiconductor chip ETF has shrunk by 34%, while all leveraged stock ETFs have shrunk by 13%.
But the problem is that the decline in the ratio relative to the market value of the underlying stocks is much smaller.
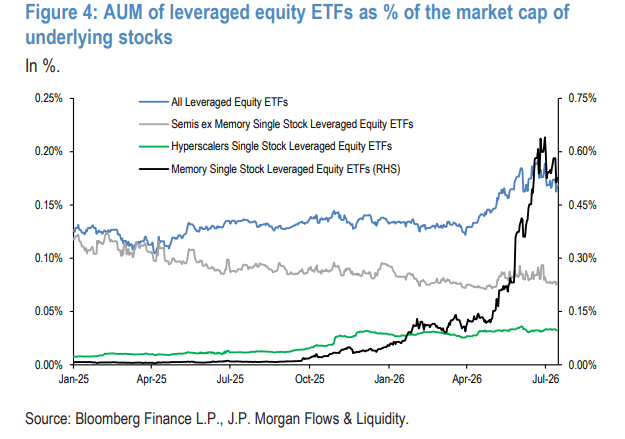
JPMorgan analysts noted that the ratio of the leveraged semiconductor chip ETF's size to the market value of its underlying is three times the average for all stock ETFs, explaining why the volatility of semiconductor chip stocks is significantly higher than the broader market. More alarmingly, even for the overall leveraged stock index ETFs, this ratio is at a high level relative to its own history, indicating that this is not just a sector-specific issue but a systemic risk for the entire market.
The analysts concluded: "It will take about another three months of a volatile trading range for the ratio of leveraged stock ETF size to underlying market value to return to pre-April levels."
Furthermore, new capital continues to flow into leveraged ETFs in July, further prolonging the time needed for deleveraging.
Options and Margin Accounts: Two "Minefields" for Retail Investors
In the options market, the JPMorgan analysts' tracked indicator for retail bullish call buying (based on OCC data, counting clients holding fewer than 10 contracts) hit a peak of nearly 14 million contracts on June 5, matching historical highs seen in October 2025 and November 2021.
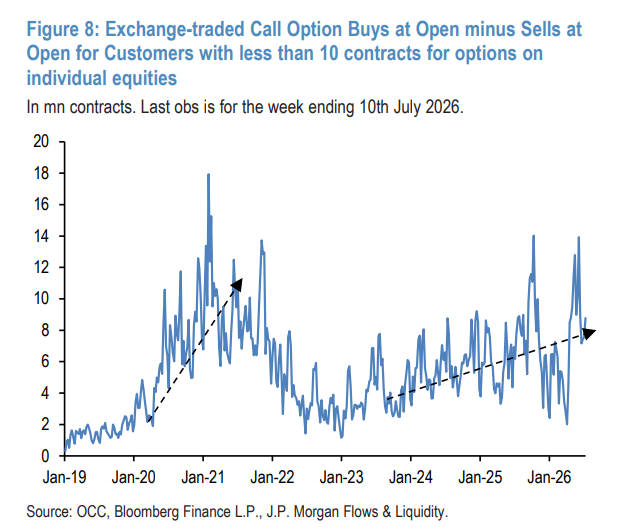
Historical patterns show that each time this indicator peaks, tech stocks undergo months of adjustment, with bottoms often coinciding with the indicator falling to a low of 2 million to 4 million contracts. While the indicator has clearly retreated from its peak, analysts believe that if it ultimately falls to the "capitulation" level of 2 million to 4 million contracts, tech stocks will still face sustained pressure.
The situation is even more severe for margin accounts. Using the NYSE Net Debit Balance as a proxy for US individual investor leverage, analysts show current levels are at historical extremes, comparable to peaks in late 2021 and mid-2018 – both instances where the peaks were followed by months of stock market correction.
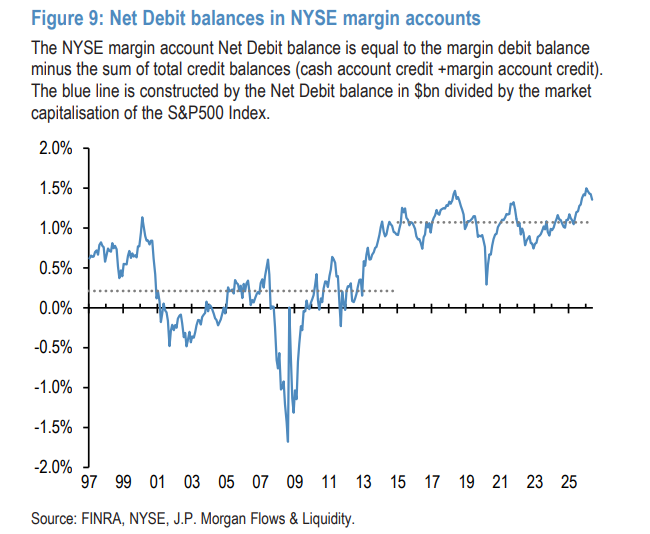
Analysts noted some recent signs of a pullback in margin accounts, but "a significant amount of deleveraging is still required before it ceases to be a notable headwind for equities."
In contrast, leverage for risk-parity funds has largely normalized and is no longer a major source of market resistance.
Hedge Funds: Semiconductor Exposure May Have Quietly Shrunk
At the hedge fund level, the bank's data shows an interesting shift.
In June, despite declines in the S&P 500 and Nasdaq, equity long/short (L/S) and technology sector (TMT) hedge funds posted positive returns of 1.2% and 3.7%, respectively. Analysts attribute this to the strong performance of the semiconductor sector – the SMH semiconductor ETF rose 9.5% in June, while US hyperscale cloud stocks fell 14.5% during the same period.
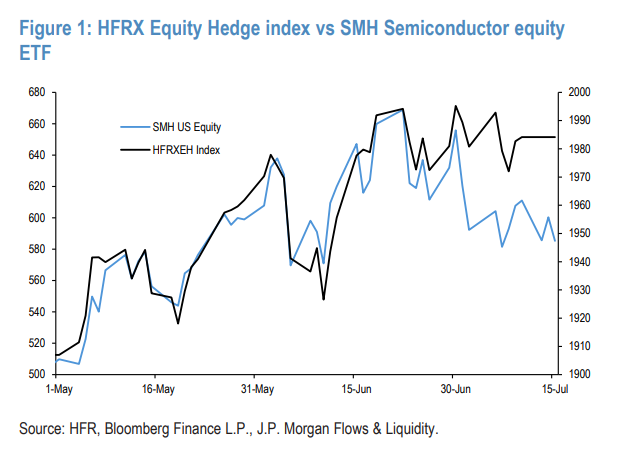
But signals changed entering July. The daily correlation between equity L/S funds and semiconductor stocks has significantly decreased. The analysts' high-frequency leverage proxy indicator also shows a pullback in leverage levels in July – after this indicator had risen to its highest level since 2017 in June.
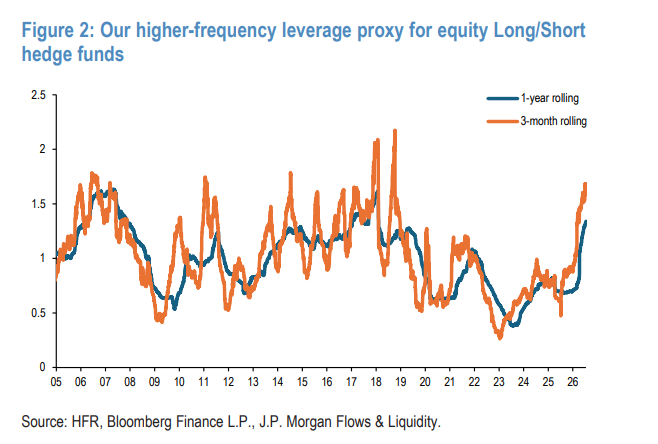
Based on this, JPMorgan estimates that equity long/short hedge funds may have reduced their semiconductor exposure in July.
H2 Supply and Demand: Retail Investors Are the Biggest Support
Deleveraging is a near-term headwind, but the bank's analysts also point out that from a longer-term perspective, the stock supply-demand structure remains positive and will provide support once the deleveraging pressure subsides.
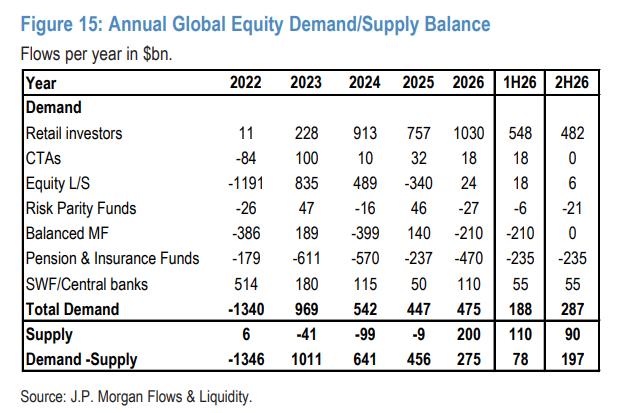
Analysts summarized the flow forecasts for various investor types:
Demand Side:
- Retail Investors are the largest support. Year-to-date inflows have reached approximately $550 billion, potentially exceeding $1 trillion for the full year, with an estimated $482 billion inflow expected in the second half.
- Sovereign Wealth Funds/Central Banks: Expected to contribute about $110 billion in equity demand for the full year, with roughly half occurring in H2.
- Equity Long/Short Hedge Funds (approx. $1.4 trillion AUM): Net bought about $20 billion year-to-date, but analysts expect little room for further accumulation in H2.
- CTA Trend-Following Funds: Momentum signal z-score is around 1.0, with net buying expected to be near zero in H2.
Pressure Side:
- Pensions and Insurance Companies: Structurally reducing equity holdings, with an estimated net selling of approximately $470 billion for the full year 2026, about $235 billion in H2.
- Balanced Mutual Funds: Have net sold approximately $210 billion in stocks year-to-date, concentrated mainly in June.
Overall, analysts estimate a net equity demand of about $475 billion for the full year 2026, with a net supply of about $200 billion (including three major AI-related IPOs), resulting in a net demand of approximately $275 billion, of which about $197 billion is in the second half of the year.
Analysts specifically noted that this positive supply-demand balance is not contradictory to the deleveraging pressure – "The deleveraging process is likely to dominate the market in the coming months, causing significant price volatility, while the stock supply-demand balance acts more like a background, long-term force that will provide support once deleveraging subsides."