
Are prediction markets a money tree? Deep dive into their profit models
- Core Insight: The core business model of prediction markets is not simply charging fees for opening markets, but rather converting market disagreements into trading demand. By utilizing differentiated Taker fee mechanisms, active trading behavior is steadily transformed into platform revenue. Polymarket's success validates the shift from "traffic narrative" to "systematic revenue validation."
- Key Elements:
- The essence of the profit model is "turning disagreements into Fees": The closer the price is to 50/50, the greater the market disagreement, the stronger the impulse to trade, and the higher the platform's fee revenue. Conversely, when the outcome is certain, the information value is high, but the fee contribution is low.
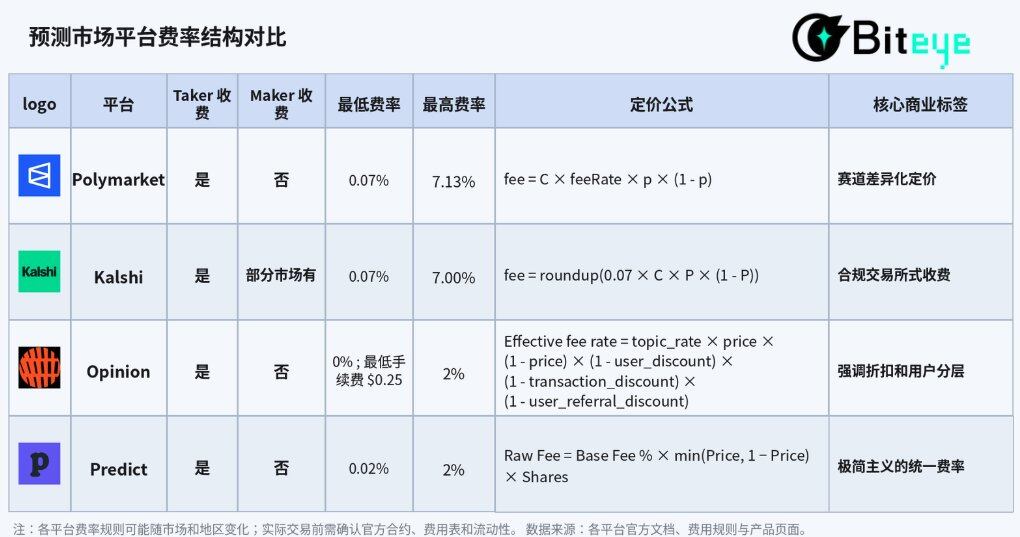
- Fee structures among mainstream platforms vary significantly: Polymarket uses track-based differentiated pricing (Crypto rate 0.07) and disagreement-based pricing (p×(1-p)); Kalshi operates close to a compliant exchange model; Opinion emphasizes a complex discount system and user tiering; Predict.fun adopts a flat 2% fee rate.
- Polymarket's commercialization timeline and key milestones: Fees were first charged on the Crypto track in January 2026, expanded to Sports in February, and the platform demonstrated strong revenue generation after full implementation in March, with 7D Fees reaching $9.27 million.
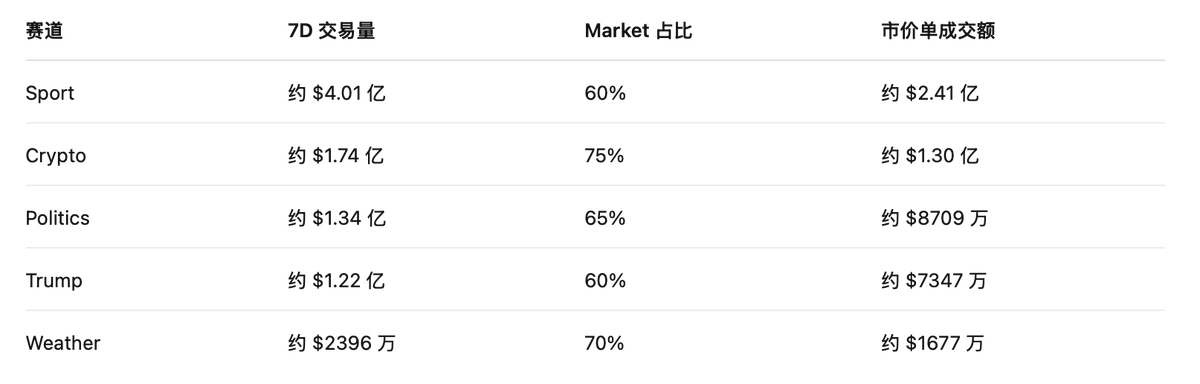
- Trading volume does not equal real profit: The Sports track has the highest 7D trading volume ($401 million), but its estimated fees ($3.31 million) are lower than those of Crypto ($4.39 million). This is because Crypto has a higher market order share (75%) and fee rate (0.07) compared to Sports (60% and 0.03).
- The true moat of prediction markets lies in "sustained pricing power": The core capability is not to spot trending topics, but to transform them into deep, frequently traded markets, where the prices become signals that can be referenced externally.
Original Authors: Changan, Amelia, Biteye Content Team
In the past, discussions about prediction markets focused on their accuracy, trading volume, and potential to become new information markets. However, when viewing prediction markets as a business, the core question shifts: What is the profit model of a prediction market?
In the business world, high trading volume does not necessarily equate to platform profitability. A market can generate significant buzz, and users can trade frequently, but if the bulk of transactions cannot be monetized, or activity is purely sustained by subsidies and points, then volume is merely an impressive statistic, not healthy revenue.
For prediction markets, the true test of business acumen is not "how many markets were opened" or "how popular a specific event is," but whether the platform can seamlessly connect three things:
- Generate the impulse for real transactions;
- Maintain sufficient order book liquidity;
- Convert aggressive order-taking demand (Taker) into fees.
This is why the business model of prediction markets is far from simply "opening a market and collecting taxes." On the surface, it’s just a series of YES / NO betting games, but what truly underpins the platform's revenue base is the underlying trading structure, liquidity mechanisms, fee strategies, and user behavior.
Especially after leading platforms like Polymarket began systematically introducing Taker Fees, the narrative around prediction markets has shifted from "information tools" to "revenue validation."
This article will delve into the underlying fundamentals of prediction markets from a business perspective:
- How do prediction market platforms make money?
- Why does the Maker / Taker dynamic determine a platform's success or failure?
- What are the fundamental differences in fee structures among mainstream platforms like @Polymarket, Kalshi, @opinionlabsxyz, and @predictdotfun?
- Why is the sector with the highest trading volume often not the most profitable?
💡 Core Conclusion: Prediction markets don't sell answers; they sell disagreement.
The closer the price is to 50 / 50, the greater the market disagreement, the stronger the urge to trade, and the easier it is for the platform to convert fees from aggressive trades. The closer the price is to 0 or 100, the more certain the outcome, and while the informational value remains, the associated fee weight decreases significantly.
Therefore, the true business moat of a prediction market is not turning "events" into markets, but turning "disagreement" into trades, and then steadily converting those trades into revenue.
1. How Prediction Markets Make Money: It's Not About Opening Markets, It's About Turning Disagreement into Fees
To deconstruct the cash flow of a prediction market, we must first clarify the four core drivers of its revenue. They intertwine to form a closed loop from traffic to monetization.
1️⃣ Trading Fees - Direct Revenue Source
Most prediction markets charge a fee to the party that initiates a trade, typically the Taker, because the Taker consumes liquidity while the Maker provides it.
This means not all trades generate revenue. The trades that truly contribute fees are often those where users are willing to pay for speed and certainty.
2️⃣ Liquidity - The Foundation for Sustained Trading
The hardest part for a prediction market isn't opening a market; it's giving that market depth.
If no one places orders in a market, users can't buy what they want or sell what they have. Even with high buzz, such a market struggles to form an effective price.
Therefore, many platforms lower costs for Makers or even incentivize them.
This isn't a direct "revenue source," but it determines whether trading fees can exist long-term.
Without liquidity, there is no sustained trading, and fee revenue naturally becomes unstable.
3️⃣ Information Value - Mindshare Capture
Prediction markets differ from regular trading platforms because they are not just trading tools; they also produce information.
When a market has sufficient volume and liquidity, its price becomes a probabilistic signal. Media outlets cite it, KOLs interpret it, traders observe it, and average users use it to gauge market sentiment.
This doesn't directly translate into fees, but it brings attention, mindshare, and external exposure to the platform. Over the long term, this information value reinforces trading demand.
4️⃣ User Operations and Discount Systems - Converting Activity into Revenue
Beyond basic trading fees, different platforms use discounts, referral programs, events, points, and rebates to increase trading frequency. These measures may not directly generate revenue but impact the platform's long-term monetization ability. For example, Opinion offers user discounts, transaction discounts, and referral discounts; Predict.fun uses a simpler base fee and discount mechanism; Polymarket focuses on differentiated fee rates by sector and Maker rebates. The essence of discounts and incentives is not mere subsidy but exchanging a portion of profit for user retention, gradually converting activity into revenue.
2. Horizontal Comparison of Fee Structures Across Mainstream Prediction Market Platforms
Looking at the fee designs of several mainstream prediction markets, the industry's strategic direction is highly convergent: encourage limit orders to provide liquidity and convert aggressive trading into revenue. However, in tactical execution, platforms show clear strategic differentiation due to their positioning.
1️⃣ Polymarket: Granular Pricing by Sector
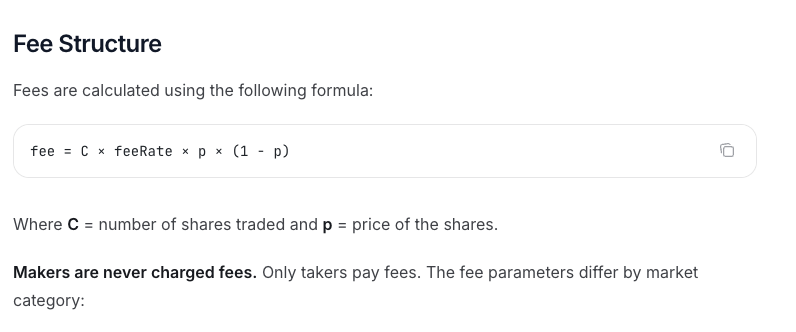
Polymarket's Taker fee logic combines "sector differentiation" and "disagreement-based pricing" to an extreme. Its official core formula is:
fee = C × feeRate × p × (1 - p)
Where C is the number of shares traded, p is the trade price, and feeRate is determined by the market sector.
This mechanism includes two core variables:
- Sector Granularity: Based on currently verified fee rates, the Crypto sector has a feeRate of 0.07, Sports is 0.03, Politics / Finance / Tech is 0.04, Culture / Weather is 0.05, and some Geopolitics markets are 0. This means Polymarket doesn't charge a uniform fee across all markets but uses differentiated rates based on trading frequency, sensitivity, and user willingness to pay in different sectors.
- Disagreement-Based Pricing: Perfectly fits the mathematical curve of p × (1 - p). The closer the price is to 50/50 (maximum disagreement), the higher the fee; the more certain the outcome (close to 0 or 100), the lower the fee.
https://docs.polymarket.com/trading/fees
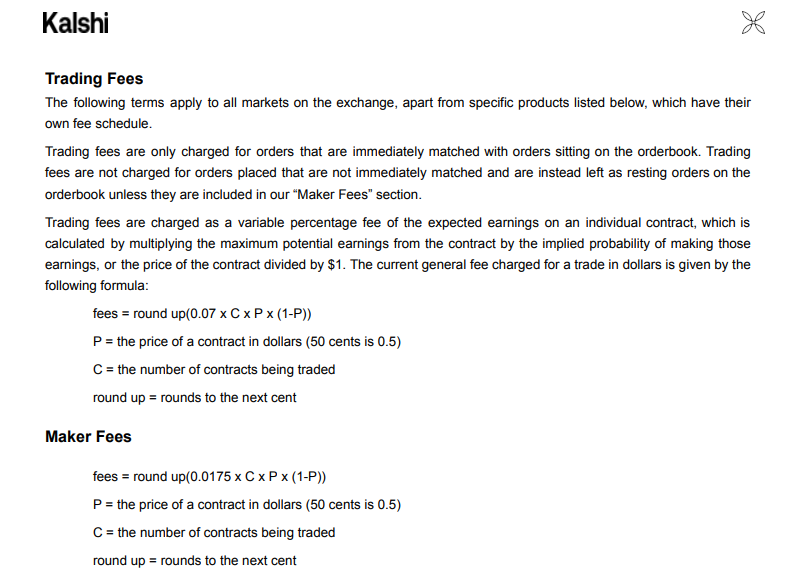
2️⃣ Kalshi: Closer to a Compliant Exchange Model
Kalshi's fee design, within a compliance framework, closely resembles traditional financial derivatives exchanges. Its standard Taker fee formula also links to price disagreement:
fee = round up(0.07 × C × P × (1 - P))
Where C is the number of contracts and P is the contract price. The fee is rounded up to the nearest cent. This structure is very similar to Polymarket's C × feeRate × p × (1-p).
Kalshi's fee structure shares similarities with Polymarket's: the trading fee also relates to the contract price. The closer it is to 50¢, the higher the fee; the closer it is to 1¢ / 99¢, the lower the fee. Kalshi's fee schedule shows that the taker fee for 100 contracts ranges roughly from $0.07 to $1.75.
However, a key difference is that Kalshi may also have Maker fees for some markets, charged only when these limit orders are eventually filled; canceling orders doesn't incur a fee. This indicates Kalshi's fee structure is closer to a compliant exchange: not a simple perpetual free-for-Maker, but more complex bilateral fee rules depending on the market.
https://kalshi.com/docs/kalshi-fee-schedule.pdf
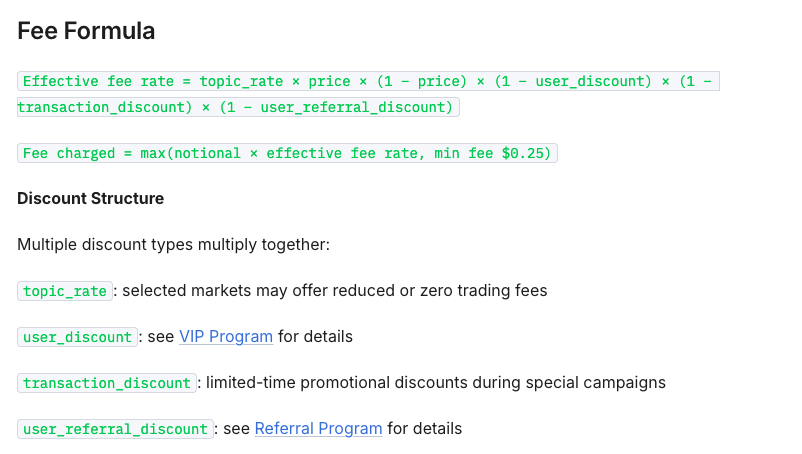
3️⃣ Opinion: Emphasizing Discounts and User Tiers
Opinion introduces a highly complex "multi-dimensional discount system." Its effective fee rate formula is:
Effective fee rate = topic_rate × price × (1 − price)× (1 − user_discount)× (1 − transaction_discount)× (1 − user_referral_discount)
This means Opinion's fee depends not only on the market price and topic_rate but also on user discounts, transaction discounts, referral discounts, etc.
Opinion also sets a $5 minimum order and a $0.25 minimum fee to prevent small trades from generating negligible fees.
This suggests Opinion's fee design is more focused on user operations:
- topic_rate differentiates markets
- user_discount enables user tiering
Compared to Polymarket's "sector-differentiated pricing," Opinion treats fees more like an operational tool: using discounts to guide user trading, retention, and acquisition, while keeping Maker fees low via free orders to maintain liquidity.
https://docs.opinion.trade/trade-on-opinion.trade/fees
4️⃣ Predict.fun: Minimalist Unified Rate
Predict.fun's fee structure is simpler, suitable for lowering user comprehension costs.
According to its current public documentation, its fee calculation formula is:
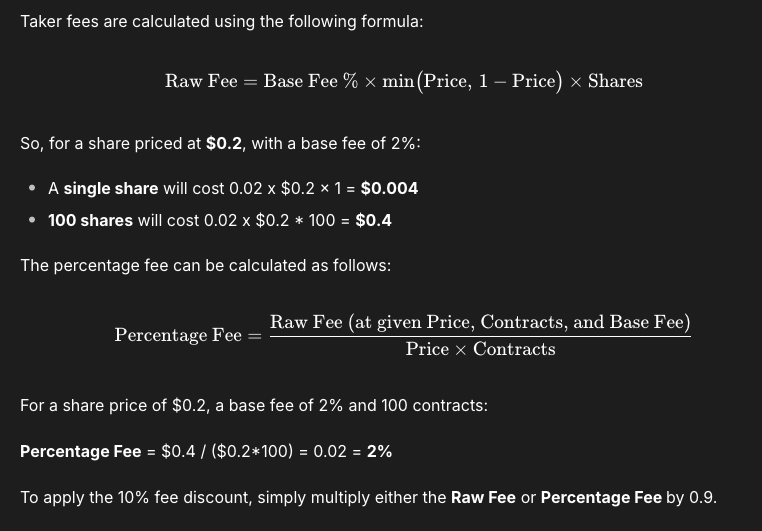
Raw Fee = Base Fee % × min(Price, 1 − Price) × Shares
The Base Fee is currently 2%. The actual fee rate changes with the trade price: below 50%, the rate is roughly fixed at 2%; above 50%, the closer the price is to 1, the lower the actual rate.
Additionally, Predict.fun supports fee discounts, which can further reduce the fee.
The feature of this design is its intuitiveness: users don't need to judge which side the market is on first; they only need to look at the trade price itself to understand the fee change.
https://docs.predict.fun/the-basics/predict-fees-and-limits#limits
It's evident that the common ground among prediction market platforms is their attempt to convert aggressive trading behavior into revenue.
This also shows that commercialization of prediction markets is not limited to a single path. They all ultimately answer the same question: Are users willing to pay for trading?
3. Deep Dive into Polymarket: Trading Volume Doesn't Equal Real Revenue
Although various platforms adopt different approaches, Polymarket remains the most suitable sample platform to verify the true monetization efficiency of prediction markets.
There are two main reasons:
- Its fee path is the clearest: starting from Crypto, expanding to Sports, and moving towards near-universal charging across more categories.
- Its data is more complete: official feeRate, 7D / 30D Fees can be used for further revenue structure analysis.
So next, using Polymarket as an example, let's answer a more specific question: Is the sector with the highest trading volume really the most profitable?
3.1 From Free to Fee: Polymarket's Commercialization Timeline
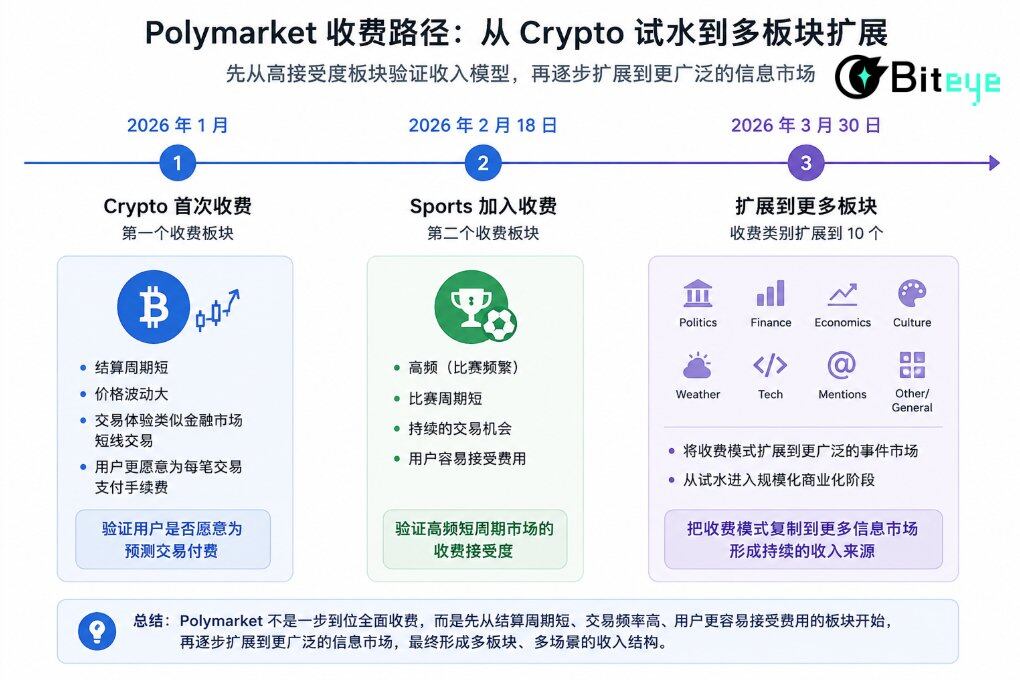
January 2026: Crypto Becomes First Fee-Based Sector
Upon re-entering the US market, Polymarket first introduced Taker Fees in the Crypto sector. Crypto markets have short settlement cycles, high price volatility, and trading behavior akin to secondary market short-term speculation. Users prioritize speed of execution far more than sensitivity to friction costs, making it an ideal testbed for fees.
February 18, 2026: Sports Becomes the Second Fee-Based Sector
Shortly after, on February 18, 2026, the Sports sector became the second fee-based sector. Sports markets have inherently high-frequency, short-cycle characteristics, providing sustained trading scenarios. Thus, Sports was a natural extension for fee implementation.
So Polymarket's initial focus on charging Crypto and Sports was essentially validating the revenue model in two sectors with higher user acceptance.
March 30, 2026: Fee Expansion to More Sectors
On March 30, 2026, Polymarket expanded its taker fee to more categories: Politics, Finance, Economics, Culture, Weather, Tech, Mentions, Other/General, bringing the total fee-charging categories to 10.
After the comprehensive fee rollout, Polymarket didn't simply charge the same fee across all sectors but adopted a more granular fee structure. This step can be seen as a key milestone in Polymarket's commercialization, extending the fee model to a wider range of markets.
The results of the comprehensive fee rollout have been remarkably impressive. According to the latest data, Polymarket has demonstrated immense revenue-generating power: 7D Fees are $9.27M, and 30D Fees are $36.3M. Its 7-day revenue has propelled it into the top six among all crypto projects, officially entering the tier of revenue-generating projects.
3.2 Decomposition of Core Sector Order Types and Price Distribution
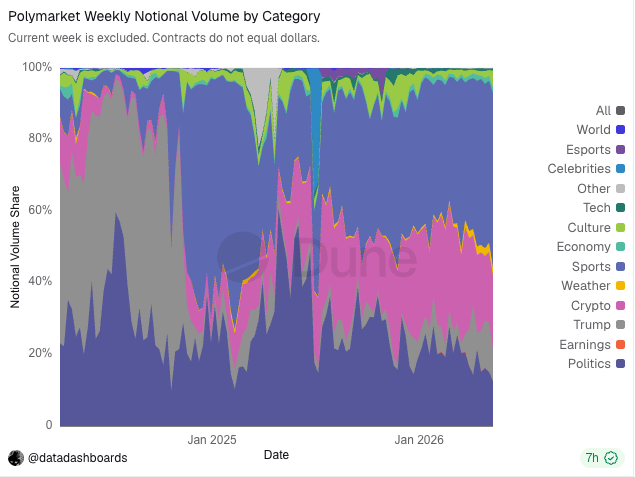
To estimate the real revenue of each Polymarket sector as accurately as possible, we used Polymarket trading data from 2021 to February 2026 to estimate fees for five main sectors 1.
Looking at the proportion of market orders, the five sectors show significant differences:
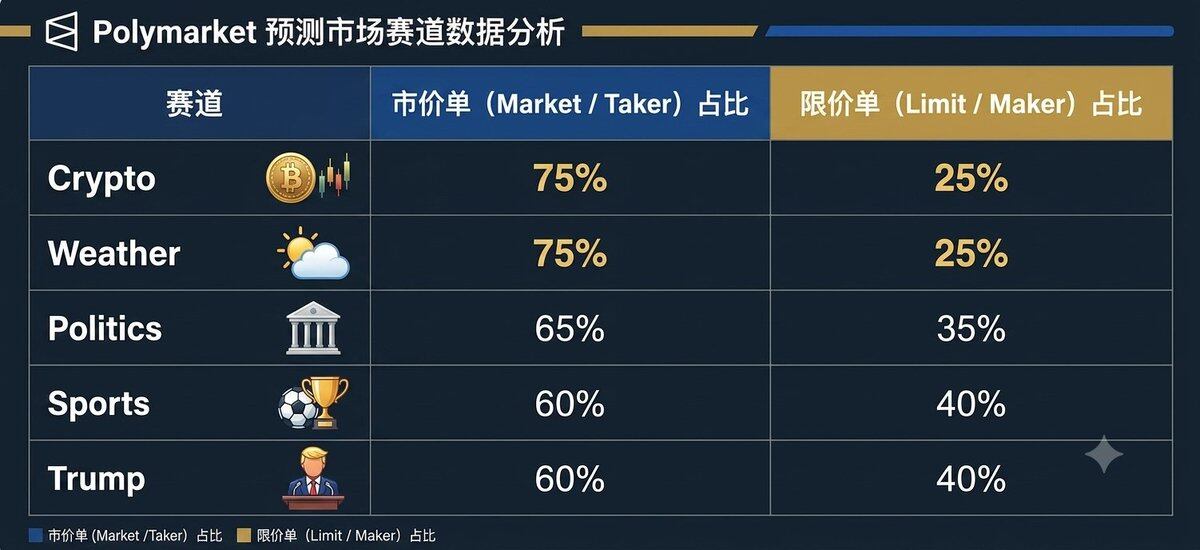
Crypto has the highest Market order proportion, reaching 75%. This perfectly aligns with the "fast-changing" nature of crypto assets, where users prefer using market orders to lock in profits or stop losses. The Weather sector, driven by real-time sudden meteorological data, also sees users valuing reaction speed highly.
Secondly, the amount of fees heavily depends on the price range of the trades.
The reason is that trades entering the fee scope do not generate the same fee. Polymarket's fee is related to p × (1 - p). The closer the price is to 50/50, the greater the market disagreement, and the higher the fee weight. The closer the price is to 0% or 100%, the more certain the outcome, and the lower the fee weight.
Data from the five main sectors shows that most trades are concentrated in the 30-50 range, especially the 40-50 interval:
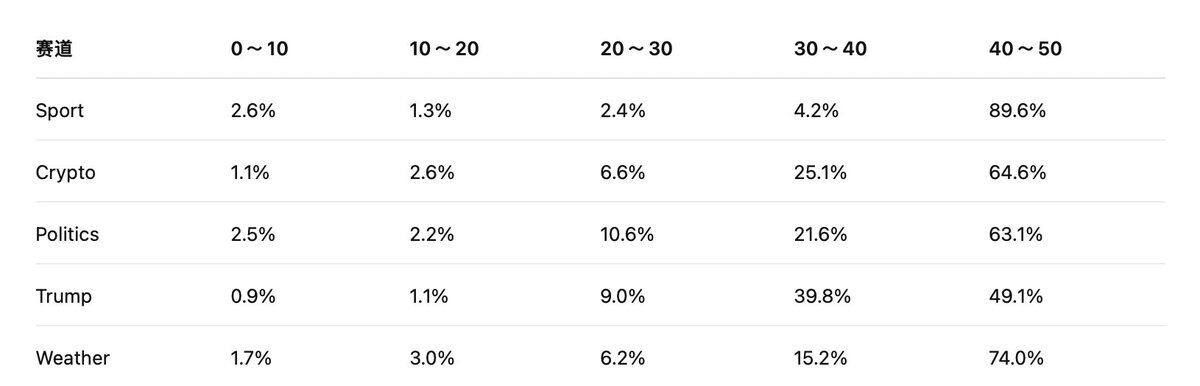
This data indicates that Polymarket's main trades don't occur when the outcome is nearly certain, but rather when the market still has significant disagreement.
### 3.3 Revenue Estimation: Which is the Cash Cow?
We used each sector's Market order volume, combined with its corresponding feeRate and the p × (1-p) weight for different price ranges, to roughly estimate Polymarket's fee revenue across the five sectors. We also considered that after introducing fees, some fee-sensitive users might switch from Taker to Limit orders. Users engaged in late-stage trading, low-odds arbitrage, or frequent short-term trading would calculate their returns more carefully.
Therefore, we can make a more conservative assumption beyond the initial estimate: assume that after charging fees, market order volume in each sector drops by 20%.
The adjusted formula becomes:
Estimated Adjusted Fee ≈ Market Order Volume × 80% × feeRate × p × (1 - p)
Based on the 7D total trading volume and the volume share of each sector, we estimate the 7D market order volume for the five main sectors.
Having calculated the market order volume for each sector, we then combine each sector's feeRate and price range weights to estimate fees. To make the calculation more robust, we use the midpoint of each range as the approximate price:


