
MEXC Alpha Trader 投研週報 | 降息預期徹底逆轉,加密立法破冰卻遭遇ETF歷史級拋壓
- 核心觀點:2026年5月第3週,美國參議院銀行委員會通過《CLARITY法案》是加密行業監管破冰里程碑,但該利好被宏觀面徹底逆轉所抵消。4月CPI與PPI遠超預期導致聯準會降息預期歸零、加息概率驟升至28%,比特幣承壓跌破7.7萬美元,機構資金結束六週淨流入轉為單週流出約10億美元。
- 關鍵要素:
- 《CLARITY法案》以15:9的跨黨派投票通過參議院銀行委員會,為美國史上首次就完整加密市場結構立法進行委員會表決,後續需經參議院全體表決。
- 4月PPI同比暴漲至6.0%,核心PPI同比5.2%創三年多最大漲幅;CPI同比跳升至3.8%。CME隱含的12月加息概率從2%飆升至28%。
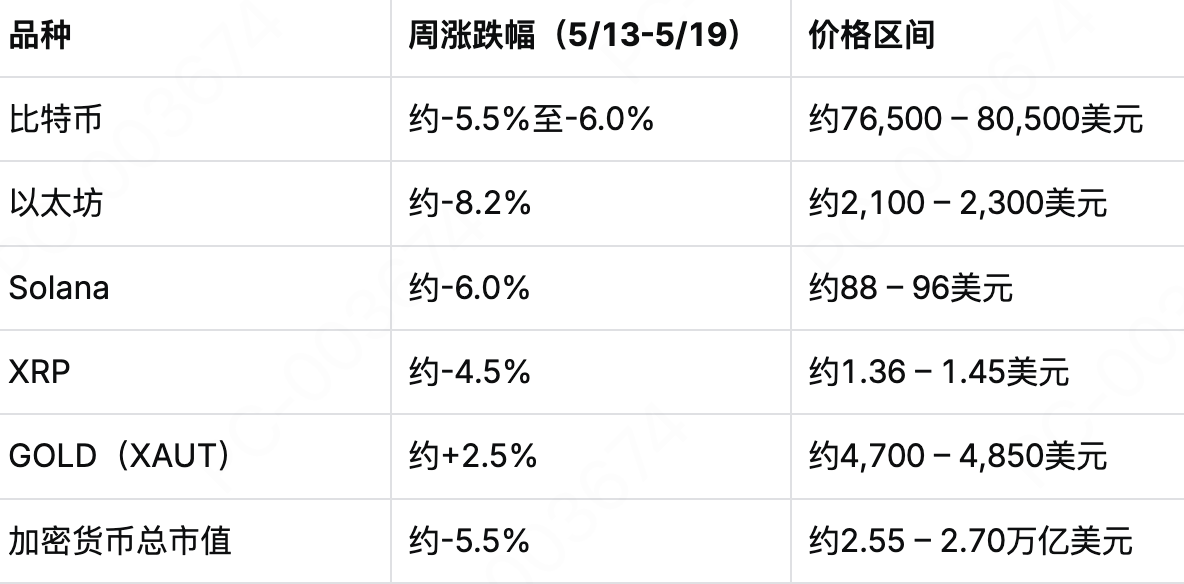
- 比特幣從8.2萬美元持續下跌至5月19日的約7.67萬美元,回吐本月大部分漲幅;以太坊跌至約2,100美元,創兩個月新低。
- 比特幣現貨ETF單週淨流出約10億美元,終結此前連續六週約34億美元的淨流入趨勢,5月13日單日淨流出高達6.35億美元。
- 美伊停火談判僵局推動布倫特原油站上110美元/桶,能源價格高企通過運輸成本強化通膨黏性,進一步鞏固聯準會緊縮預期。
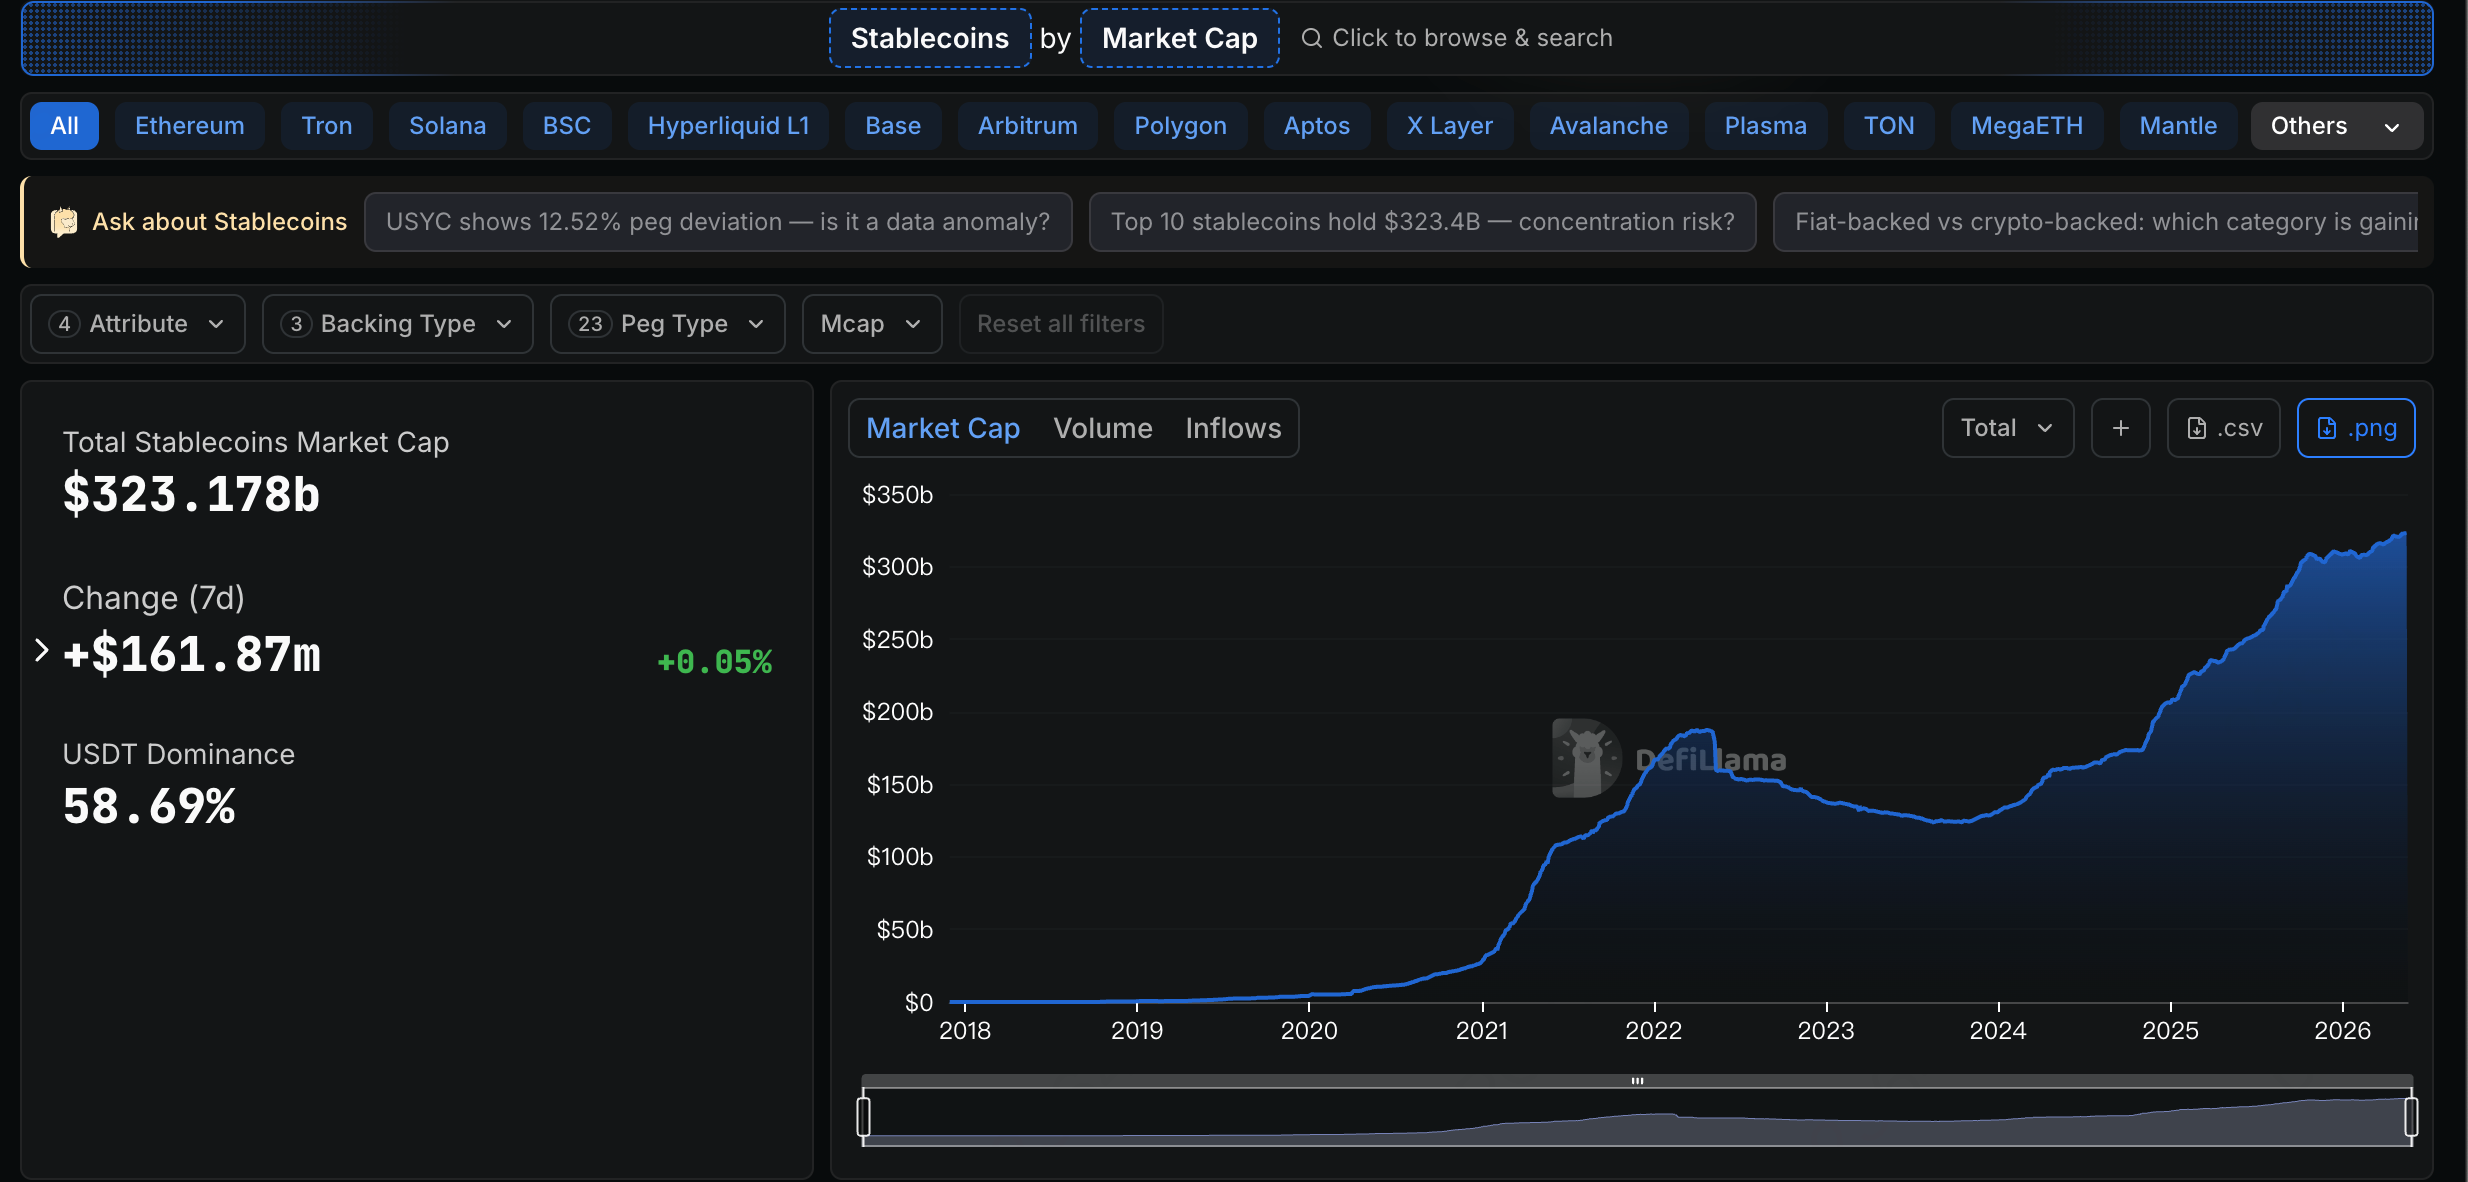
- 穩定幣總市值突破3,200億美元,USDC在以太坊上一次性增發2.5億枚,顯示鏈上資金池仍在擴張。
- 美股納指標普六週連漲終結,30年期美債收益率重返5%關口,市場從「財報季驅動」切換至「通膨定價驅動」。
Week 3 of May 2026
Statistical Period: May 13 – May 19, 2026
Data as of: May 19, 2026
Core Narrative
This past week marked a critical window in which the macro logic of the cryptocurrency market underwent a complete reconstruction since 2026. On May 14, the U.S. Senate Banking Committee voted across party lines, 15-9, to officially pass the CLARITY Act. This represents the first ever committee-level vote in U.S. congressional history on comprehensive crypto market structure legislation, signaling an end to the nearly decade-long regulatory "gray area" for the crypto industry. However, this positive legislative breakthrough was insufficient to offset a deep macro reversal.
Macro developments signaled a key inflection point. After the April CPI year-over-year rate jumped to 3.8% (the highest since Fall 2023) on May 12, the U.S. Bureau of Labor Statistics reported on May 13 that the April PPI surged 6.0% year-over-year, far exceeding all economist expectations, marking the largest monthly increase since 2022. Core PPI rose 5.2% year-over-year, the largest gain in over three years. This unexpected rise in inflation, coupled with elevated energy costs driven by geopolitical conflicts, has fundamentally shifted the Fed's monetary policy trajectory. The CME's implied probability of a Fed rate hike in December 2026 has surged from about 2% a month ago to approximately 28%. The 30-year Treasury yield has returned to the 5% threshold, and the market consensus has swiftly pivoted from expecting "rate cuts this year" to considering the "possibility of rate hikes."
Bitcoin experienced significant downward pressure this week. From above $82,000 in early May, Bitcoin slid steadily, falling below $77,000 during the Asian session on May 19 and briefly approaching the $76,500 mark, erasing most of its gains for the month. Ethereum weakened in tandem to around $2,100, its lowest level since April 7. Against a backdrop of a definitive macro reversal, the crypto market entered a risk-reset phase in mid-May, transitioning from pricing in a "regulatory optimism + easy money" narrative to pricing in a more complex story of "regulatory thaw + tightening liquidity."
Geopolitical factors continued to provide imported volatility. With no substantial progress in US-Iran ceasefire talks, Brent crude oil climbed above $110/barrel during the Asian session on May 18, and WTI crude broke through $107/barrel, the highest levels since early May. Rising oil prices are feeding into core inflation through transportation costs, further reinforcing expectations of Fed policy tightening.
In US equities, despite the Nasdaq and S&P 500 hitting record highs for six consecutive weeks, US stock futures broadly declined starting May 13, with the semiconductor sector leading the losses. The market is transitioning from being "earnings-driven" to being driven by "inflation pricing." Nvidia's upcoming earnings report and the Fed's meeting minutes will be the two major focal points for the market in the coming week.
1. Core Crypto Market Dynamics
1. Institutional Flows: Six-Week Inflow Streak Ends, Weekly Outflow of ~$1 Billion
The robust six-week net inflow streak for spot Bitcoin ETFs officially reversed this week. According to multiple data sources, over the five trading days ending May 15, 2026, US spot Bitcoin ETFs saw total net outflows of approximately $996 million to $1 billion, ending a streak that had seen cumulative net inflows of around $3.4 billion over the prior six weeks.
May 13 was the primary day for this wave of selling pressure. According to reports from BingX and CoinDesk, spot Bitcoin ETFs recorded a single-day net outflow of up to $635 million (some reports cite $630.4 million), one of the largest single-day net outflows since the start of 2026. Under the combined pressure of ETF selling, inflation data shocks, and long-position liquidations in the derivatives market, Bitcoin's price accelerated its decline from near $82,000 to around $78,000. Spot Ethereum ETFs also recorded net outflows for most of this week. BlackRock's Bitcoin and Ethereum ETFs combined for net outflows of approximately $653.9 million over the week, reflecting a phase of defensive risk reduction by institutions following the macro risk reset.
May 14 offered a brief respite in capital flows. Bitcoin ETFs saw net inflows of $131 million that day, with total trading volume reaching $2.76 billion, higher than the previous day's $1.99 billion. However, this rebound proved short-lived. On May 15, net outflows resumed at approximately $290 million, painting a weak weekly pattern of "precipitous outflows → small reprieve → renewed outflows."
Notably, despite weekly net outflows of around $1 billion, total cumulative net inflows for Bitcoin ETFs remain above approximately $59 billion, and the existing holdings have not been severely eroded. As of press time on May 19, Bitcoin was trading around $76,769. Total derivatives liquidations across the market were about $180 million, and the Crypto Fear & Greed Index had fallen to 31, indicating "Fear."
2. Price Action: Bitcoin Falls Below $77,000, Ethereum Hits Two-Month Low
The Bitcoin price trend this week was characterized by sustained, one-way decline. The overall dynamics can be summarized in three phases:
- Phase 1 (May 13-14): Inflation Data Shock Breaks Below $80,000. Following the double data surprises of April CPI at 3.8% YoY and PPI at 6.0% YoY, Bitcoin rapidly declined from above $81,000, breaking below the key $80,000 psychological level and briefly dipping under $79,000. On May 13, Bitcoin fell below $80,000 intraday, down over 2% from its daily high.
- Phase 2 (May 15-17): Regulatory Boost Provides Brief Support, But Rebound is Limited. News on May 15 that the Senate Banking Committee passed the CLARITY Act provided some emotional support for the market, with prices briefly stabilizing in the $78,000-$79,000 range. However, continued ETF outflows capped the rebound's extent.
- Phase 3 (May 18-19): Macro Pressures Build, Breaks Below $77,000. In the latter part of the week, growing concerns over macro pressures—including oil prices pushed higher by stalled US-Iran talks and rising expectations of a Fed rate hike—continued to fester. Bitcoin fell below $77,000 on May 18 and further dropped to the $76,500-$76,800 range by May 19, erasing most of its gains for the month.
The Crypto Fear & Greed Index (FGI) dropped to 31 on May 19, entering the "Fear" zone.
Source: CoinGecko, MEXC
Technically, after breaking below the 100-hour moving average and the $80,000 psychological level, Bitcoin's short-term trend turned weak. The $76,000 level is the core support band since February—coinciding with low points tested multiple times previously. An effective breakdown below this level could open up deeper downside. On Polymarket, the probability of traders betting Bitcoin falls below $75,000 by the end of May has risen to 74%.
3. Stablecoins: Total Market Cap Surpasses $320 Billion, USDC Continues to Mint
The stablecoin market continues its gradual expansion trend. As of mid-May, the total market capitalization of global stablecoins has officially broken through the $320 billion mark. USDT's market cap stands at approximately $189.6 billion, accounting for about 60% of the total stablecoin market. USDC's market cap is around $770-78 billion, representing about 24-25%, with the two combined commanding nearly 90% of the market share.
Newly circulating USDC continues to be minted. On May 19, according to on-chain monitoring reports from Whale Alert, the USDC Treasury executed a large-scale minting transaction on the Ethereum network, creating 250 million new USDC tokens in one batch. Yield-bearing stablecoins are becoming the fastest-growing sub-sector. In Q1 2026, the new market cap added by yield-bearing stablecoins was approximately $4.3 billion, with sUSDS alone absorbing over $2.5 billion in new funds. The latest movements of USDT and USDC suggest that the on-chain "dry powder" pool continues to expand in an orderly manner.
2. Global Asset Performance
1. Equity Markets: Inflation Data Weighs on US Stocks, Ending Six-Week Winning Streak for Nasdaq and S&P
This week, the US equity market pivoted from being "earnings season-driven" to "inflation pricing-driven." As April CPI (3.8% YoY) and PPI (6.0% YoY) both significantly exceeded expectations, the CME's implied probability of a Fed rate hike in December 2026 surged from about 2% a month ago to 28%. The 30-year Treasury yield returned to the 5% level.
The Federal Reserve's April FOMC meeting held the federal funds rate steady at 3.50%-3.75%, with an 8-4 vote, the most divided since 1992. Following the inflation data release, institutions like CICC have adjusted their previous forecast of "possible rate cuts this year" to "further cuts may be difficult this year." Under the baseline scenario, US PCE inflation is expected to remain above 3.5% for the full year, and core PCE inflation above 3%, both significantly higher than the Fed's 2% policy target.
On May 13, futures for all three major US stock indices declined, with chip stocks broadly falling and the semiconductor sector leading losses. After six consecutive weeks of record highs, both the Nasdaq and S&P 500 began to face pressure at elevated levels. The repricing of the Fed's policy path is driving capital outflows from growth-oriented sectors.
Key earnings and events this week: Cisco (CSCO) earnings on May 13; Home Depot (HD) earnings on May 19; Nvidia is expected to report earnings in late May, seen as a bellwether for market sentiment.
2. Commodities: Oil Volatile at Highs, Precious Metals Under Pressure
Over the past week, the international commodity market showed a clear "strong oil, weak gold" pattern. On May 18, Brent crude broke through the $110/barrel mark, and WTI crude reached $107/barrel. Core factors driving this rally include: deep disagreements in US-Iran ceasefire talks that are hard to bridge; the ongoing closure of the Strait of Hormuz reducing global oil supply by over 10 million barrels per day; the expiry of Russian oil sanction waivers in mid-May; and a drone attack on Gulf energy facilities over the weekend.
For the week ending May 12, London gold was priced at $4,528.00/oz, down $213.40/oz from May 8, a weekly decline of 4.50%. London silver was priced at $78.74/oz, down $1


