
159加密協議實測:除了Hyperliquid,有回購機制的代幣都在虧錢
- 核心觀點:收入規模是代幣回報的關鍵決定因素,而非價值累積機制本身;日均收入超過50萬美元的協議平均回報優於無收入協議,揭示了市場實際獎勵的是業務基本面而非機制設計。
- 關鍵要素:
- 主動價值累積(49個協議)代幣1年期平均回報-55%,純治理代幣(48個)為-65%,但剔除頭部項目後差距縮小。
- 日收入最高五分之一協議平均回報+8%,最低五分之一為-81%;收入規模比機制分類更具預測性。
- 回購銷毀類別平均回報-35%,但剔除Hyperliquid(+193%)後降至-56%,說明數據受單一項目影響顯著。
- 唯一正回報的ve模型代幣Aerodrome(+5%)依賴Base生態持續流入,其他ve代幣跌幅為-54%至-84%。
- 混合類別(包括積分計畫、RWA、memecoin等62個代幣)平均回報-71%,缺乏現金流支撐導致空投解鎖後價格崩潰。
- 在135個有數據的協議中,僅5個過去一年回報為正,中位數回報為-66%。
Original Author: Connor King
Original Translation: TechFlow
Key Takeaway: This study tested 6 token value accrual mechanisms across 159 protocols and found that revenue scale matters more than mechanism design—protocols with daily revenue exceeding $500,000 returned an average of +8%, while those in the lowest tier returned -81%. More importantly, many seemingly "winning" mechanisms reverse course when one or two top projects are removed, offering direct reference value for investor token selection.
We mapped 6 value accrual mechanisms across 159 tokens and tested which ones actually translate into returns for token holders.
Most of the crypto industry's narratives around token value accrual are wrong.
Research Setup
Two weeks ago, we released the "2026 Investor Relations and Token Transparency" report. One key finding: 38% of crypto protocols have active value accrual, while 62% return no value to token holders.
This article is the accompanying analysis. We took a dataset of 159 protocols, classified each token by its accrual mechanism, and pulled 1-year price performance data from Artemis. The question: which mechanisms actually translate into returns?
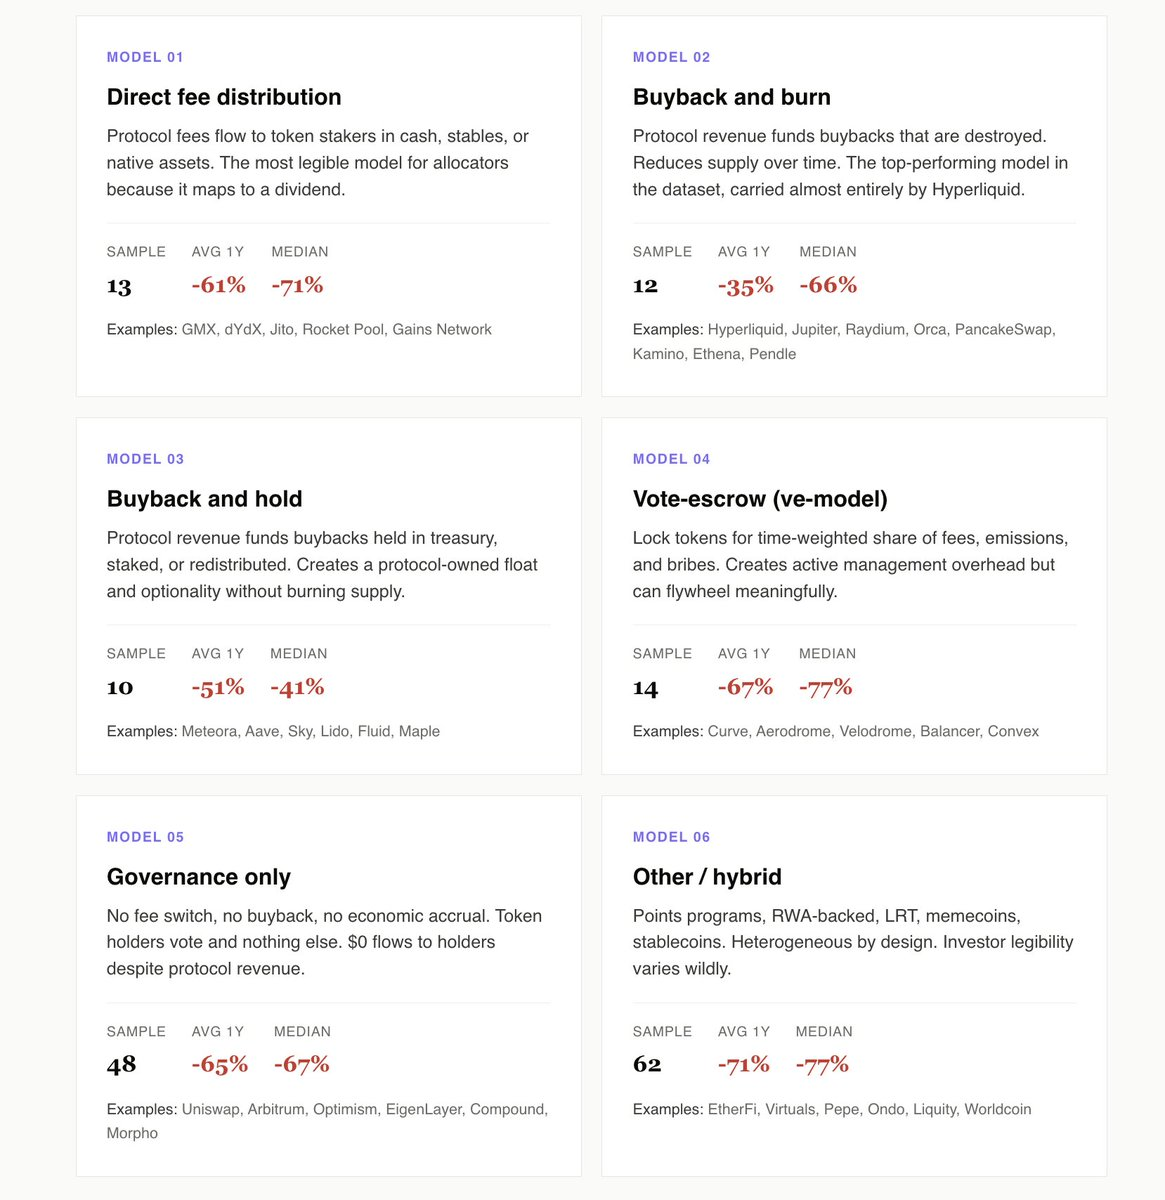
We identified 6 models: Direct Fee Distribution, Buyback & Burn, Buyback & Hold, Vote-Escrow (ve model), Pure Governance, and Other/Hybrid.
Here are our findings:
Active Accrual Leads Pure Governance by 10 Percentage Points
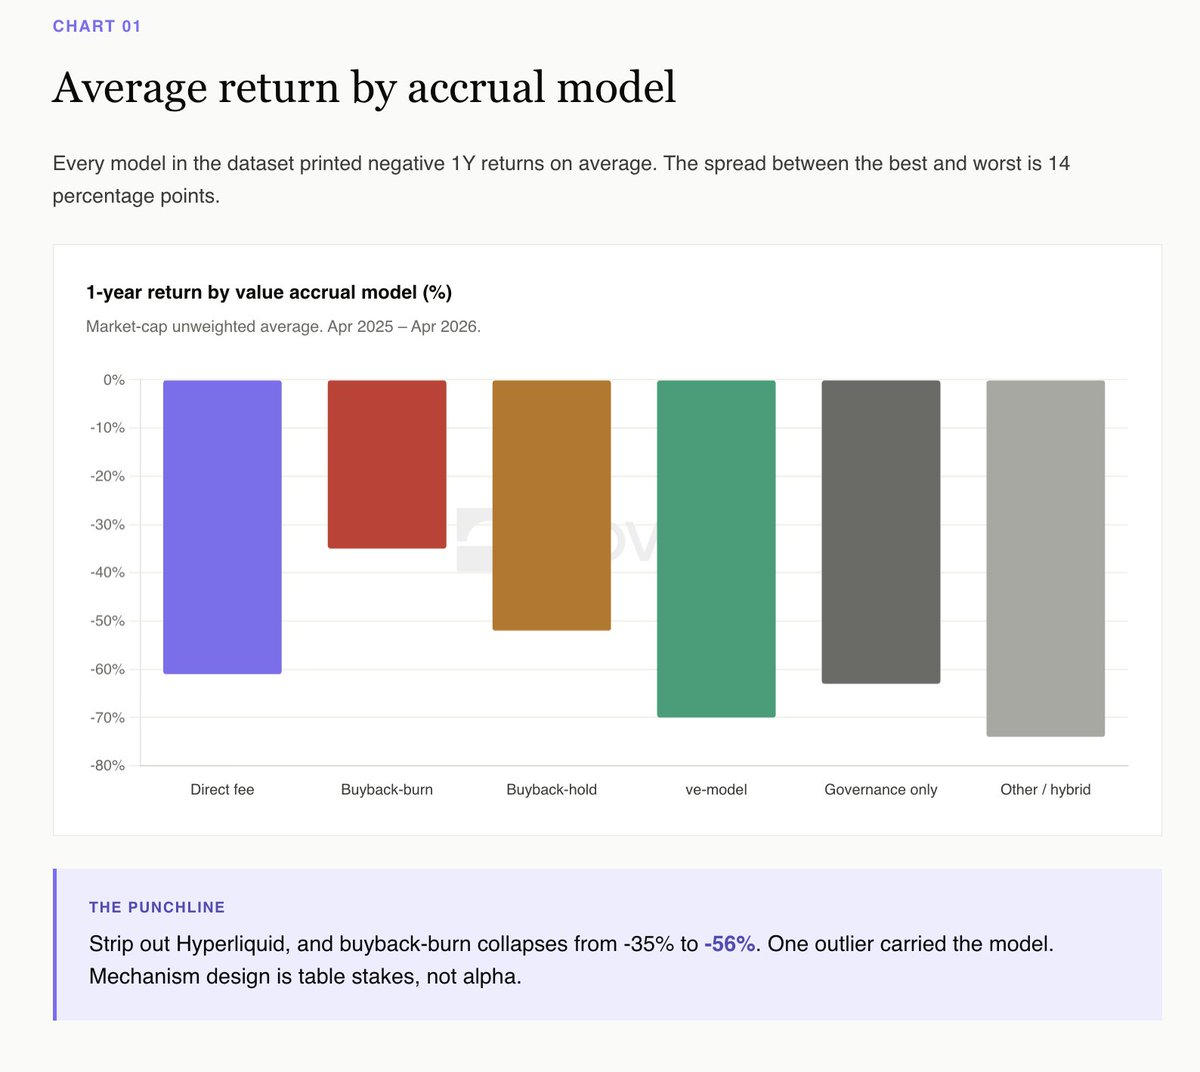
The 49 protocols using Direct Fees, Buyback & Burn, Buyback & Hold, and ve models averaged a -55% return over the past year. The 48 Pure Governance protocols averaged -65%.
When narrowing the focus to revenue-generating pure governance tokens like Uniswap, Arbitrum, and Morpho, the gap widens further. These protocols generate real revenue but allocate zero to token holders. This opportunity cost is the most glaring element in the dataset.
Pure governance is the investor relations equivalent of a public company that neither pays dividends nor buys back stock. Eventually, allocators stop pretending it's a going concern and start pricing it as an option on management waking up.
Hyperliquid *Is* the Buyback & Burn Category
On the surface, Buyback & Burn won this year (average -35%), with Buyback & Hold coming in second (-52%). This looks like a clean victory for burning.
But the story reverses when removing Hyperliquid. Excluding HYPE, Buyback & Burn averages -56%, while Buyback & Hold averages -52%. One token defines the entire category.
Meteora is the cleanest Buyback & Hold case study. A $10 million buyback program, a Novora investor relations score of 95/100, and transparent treasury accumulation. It's down about 40% this year, below the category median. Holding buybacks in a transparent treasury preserves optionality and creates visible, audited supply. Burning destroys optionality in exchange for a marketing headline.
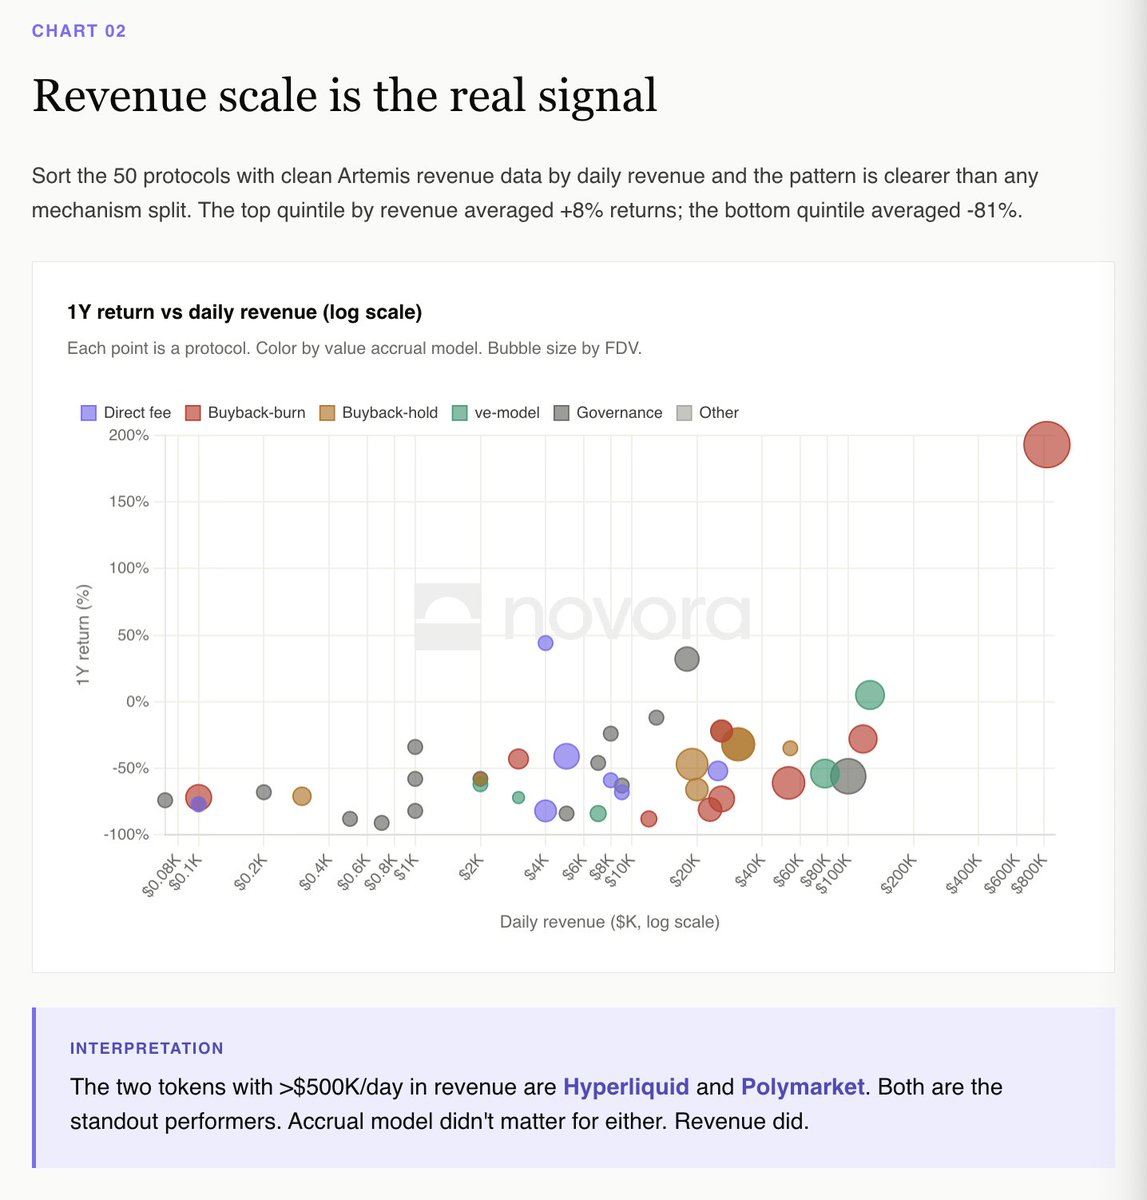
Revenue Scale is the Real Signal
Ranking the 50 protocols with clear Artemis revenue data by daily revenue reveals a pattern clearer than any mechanism classification.
Protocols in the top revenue quintile averaged a return of +8%. Those in the bottom quintile averaged -81%.
The two protocols with daily revenue over $500,000 are Hyperliquid and Polymarket. Both are standout performers in the dataset. Their accrual models differ, but their revenue trajectories are the same.
The dYdX Paradox vs. the Hyperliquid Paradox
Direct Fee Distribution is the most readable model for institutional allocators because it maps clearly to dividends. dYdX runs the textbook version: 100% of trading fees to stakers, 75% of net revenue for buybacks, and best-in-class investor relations infrastructure.
dYdX dropped 82% over the past 12 months. The mechanism worked exactly as promised, but the business did not.
Hyperliquid is the opposite. It uses buybacks and burns via its aid fund (99% of fees), has zero traditional investor relations infrastructure, and is up +193% year-over-year.
If you're an allocator, this is the clearest read in the dataset: you are buying a share of protocol revenue. If revenue declines, the token will too. Mechanism is table stakes; revenue trajectory is everything.
ve Models Require Perpetual Bribes to Function
Aerodrome is the only ve-model token in the dataset with a positive 1-year return (+5%). Its mechanism relies on Base ecosystem inflows to sustain the bribe market.
Velodrome, Curve, Balancer, and every smaller ve fork dropped between -54% and -84%. The ve flywheel works, but it requires continuous new capital. When capital stops flowing, the entire structure collapses.
This isn't a criticism of the model. It's an acknowledgment that ve tokens are leveraged bets on ecosystem inflows, not necessarily bets on pure protocol fundamentals.
The Hybrid Category Averages -71%
Points programs, RWAs, LRTs, memecoins, stablecoins. 62 protocols. The most heterogeneous category in the dataset. Average 1-year return: -71%.
This is the fate of most projects launched in 2024-2025: EtherFi, Renzo, Puffer, Usual, Virtuals, AI16Z, the entire LRT cohort, the memecoin cohort. These tokens trade on narratives and TGE airdrop events, not on cash flow mechanisms. Once the airdrop unlocks are complete, there's nothing left to support the price.
Investor readability is the fundamental problem. Allocators cannot underwrite a token whose accrual mechanism depends on a future narrative.
The Big Picture
Average 1-year returns by accrual model:
Buyback & Burn: -35% (boosted by Hyperliquid; -56% excluding HYPE)
Buyback & Hold: -52%
Direct Fee Distribution: -55%
Pure Governance: -65%
Vote-Escrow (ve): -67%
Other/Hybrid: -71%
Of the 135 protocols with empirical performance data, 5 were positive over the past year. Median return: -66%.
What This Means
The market does not pay a premium for good mechanism design, but it punishes tokens with no mechanism at all.
The clearest empirical read of 2025 is: value accrual did not generate excess returns; revenue did. But the 48 pure governance tokens in the dataset show the cost of having no mechanism. When the market chooses between a token that pays you and a token that doesn't, it picks the one that pays.
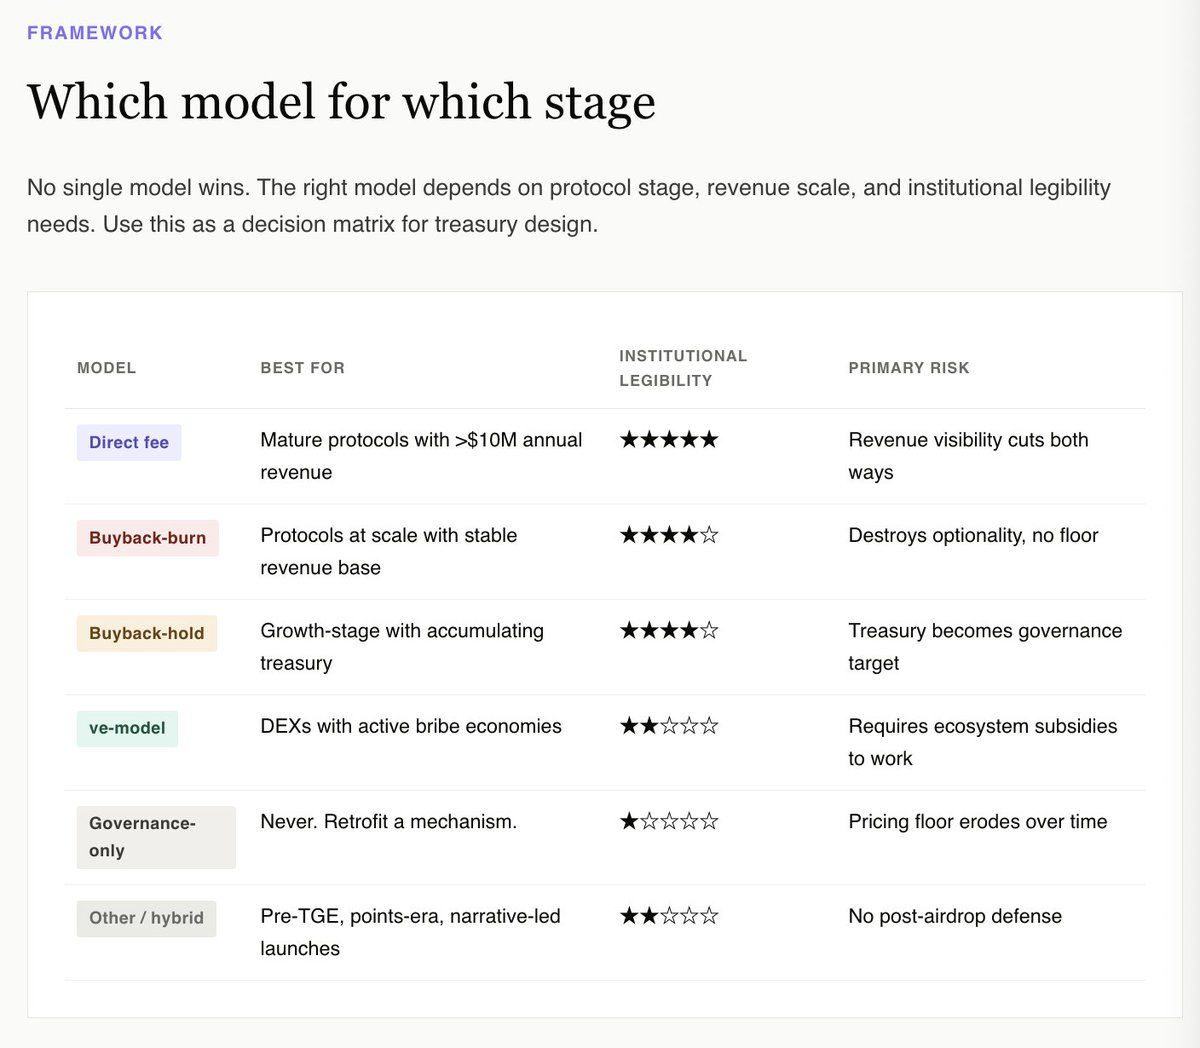
For treasuries, the right question isn't which mechanism maximizes upside. The data shows none reliably do. The right question is which mechanism makes this token look investable from an institutional allocator's fundamental perspective.
That perspective immediately eliminates Pure Governance and the Hybrid category. It favors Buyback & Hold with transparent treasury disclosures, Buyback & Burn for scaled protocols (Hyperliquid), Direct Fee Distribution for mature revenue-generating protocols, and, for narrow-range DEX native tokens, the ve model tied to an active bribe market.
For every other token—including most launched in the last 24 months—the honest answer is: retrofit a mechanism before the next unlock. Do it while you still have the option.
The full interactive report with all 159 protocols and a filterable dataset is now live:
https://www.novora.co/research/value-accrual-2026.html
This article is for informational purposes only and does not constitute financial, investment, or legal advice. All data is verified from public sources as of April 2026. Novora may have consulting relationships with protocols mentioned in this report. Always conduct your own research and consult a qualified financial advisor before making investment decisions.


