






韩股这一波去杠杆是如何发生的?


- 核心观点:文章系统复盘了2026年韩国股市因单股杠杆ETF过度集中、散户融资抄底与外资撤退叠加,引发从股价暴跌到多轮负反馈去杠杆的全过程,指出市场结构脆弱性与预期反转是踩踏主因。
- 关键要素:
- 5月27日韩国推出三星电子与SK海力士单股两倍杠杆ETF,吸引大量散户资金,致两只股票占KOSPI市值比升至52%,形成极端集中杠杆结构。
- 6月22日金融监督院院长公开承认产品审批仓促,打破政策支持预期,成为信心拐点,次日KOSPI暴跌9.99%触发熔断。
- 去杠杆第一阶段(6月23日)价格暴跌但信用融资余额未降,散户继续抄底;第二阶段(6月24-25日)强平与新增融资同时创纪录,形成“价格去杠杆、资产负债表未去杠杆”的畸形状态。
- 6月外资净流出126.3亿美元,散户净买入42.4万亿韩元接盘,风险从全球机构转移至韩国家庭部门;7月盈利利好无法推高股价,市场转向担忧内存周期见顶。
- ETF每日再平衡机制放大双向波动:下跌时被迫减仓,反弹时强制加仓;强制平仓数据滞后于暴跌,7月9日创历史第四高。
- 7月16日韩国央行加息至2.75%,金融委员会限制单股杠杆产品上市与提高门槛,标志去杠杆进入监管主导阶段。
- 至7月16日,KOSPI累计下跌25.17%,但信用融资余额仅下降11%,价格跌幅为债务降幅的2.3倍,显示杠杆泡沫收缩仍在进行。
Original author: qinbafrank (X: @qinbafrank)
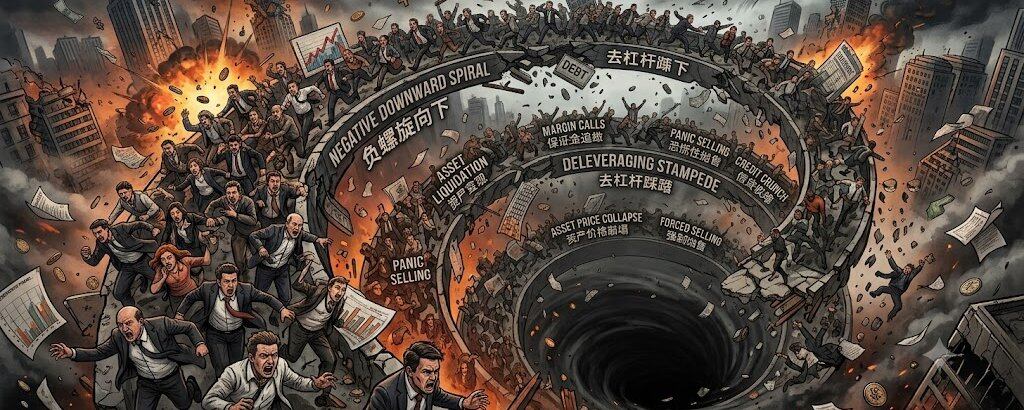
A devastating leverage unwinding has already occurred. Now is the time for a post-mortem to trace how this deleveraging unfolded. From a personal perspective, this wave of deleveraging started with the Korean stock market. Although the U.S. stock market began deleveraging on July 1st, in hindsight, the first large red candle on June 23rd marked the beginning of the process. Today, let's follow the timeline to dissect exactly how this deleveraging happened in the Korean stock market.
1. Before June 23rd, the market already had all the conditions for a crash
To understand the subsequent plunge, we must first look at the market structure formed between May 27th and June 22nd.
1. Single-stock 2x leveraged products further concentrated capital into Samsung Electronics and SK Hynix
On May 27th, the Korean market launched single-stock 2x leveraged and inverse ETFs tracking Samsung Electronics and SK Hynix. By June 19th, retail investors had cumulatively net purchased approximately 8.2 trillion KRW of long leveraged ETFs, with about 4.6 trillion won for SK Hynix and 3.7 trillion won for Samsung Electronics; net purchases of inverse ETFs during the same period were only about 0.3 trillion won.
More critically, the capital wasn't simply flowing from cash into the market. It was clearly rotating from diversified semiconductor ETFs and KOSPI index ETFs into single-stock leveraged products. By June 19th, the asset size of the SK Hynix leveraged ETF reached 9.15 trillion KRW, and Samsung Electronics-related products reached 5.22 trillion KRW.
This led to three structural changes:
1) Investors shifted from diversified industry exposure to concentrated exposure in just two stocks;
2) The volatility of ordinary stocks was further amplified by the 2x leverage;
3) As the ETF size grew larger with rising prices, the subsequent daily rebalancing trades also became larger.
The Korea Capital Market Institute estimates that the asset size of SK Hynix-related leveraged ETFs increased by about 4.31 trillion KRW between June 10th and 19th. Of this, approximately 3.6 trillion won was not from new subscriptions, but from the increase in net asset value (NAV) caused by the underlying asset's appreciation. In other words, even without new investors entering the market, the market's own rise automatically generated greater subsequent rebalancing demand.
2. The two stocks were already approaching "half of KOSPI"
The combined market capitalization weight of Samsung Electronics and SK Hynix in the KOSPI rose from 34% at the end of 2025 to 49% on May 26th, and further reached 52% by July 15th.
This isn't traditional debt leverage, but it constitutes a very strong index structural leverage:
A 10% decline in these two stocks, even if other companies remain unchanged, could directly drag down the KOSPI by about 5%.
As of July 15th, the total market capitalization of the 16 single-stock leveraged or inverse products had expanded from 4.4 trillion KRW at their launch on May 27th to 11.9 trillion KRW, with daily trading volume increasing from 10.4 trillion to 13 trillion KRW.
3. The regulator's statement on June 22nd became the inflection point for confidence
On June 22nd, the head of South Korea's Financial Supervisory Service publicly admitted that the approval process for related products was "too hastily prepared" and stated that measures to stabilize the market were being studied.
The regulator also explained that the initial approval of domestic single-stock leveraged products, besides the desire to bring demand for overseas products under the domestic regulatory framework, also included considerations of attracting Korean retail capital back from the U.S. and Hong Kong markets to alleviate the pressure on the Korean won's depreciation, but the actual exchange rate effect was limited.
As of the end of May, the scale of various types of retail leveraged investments in South Korea had reached approximately 60 trillion KRW.
The market implication of this statement was not "an immediate trading ban by regulators," but rather:
- The expectation of policy support for product expansion was shattered;
- The potential for product expansion by securities firms and asset managers was questioned;
- Foreign investors began to worry that regulation could change the market's liquidity structure;
- The market seriously evaluated the risk of the negative feedback loop of 2x ETFs for the first time.
2. Major Index Path
Below are the most important price points during this cycle. Relative declines are based on the June 22nd closing level of 9,114.55 points.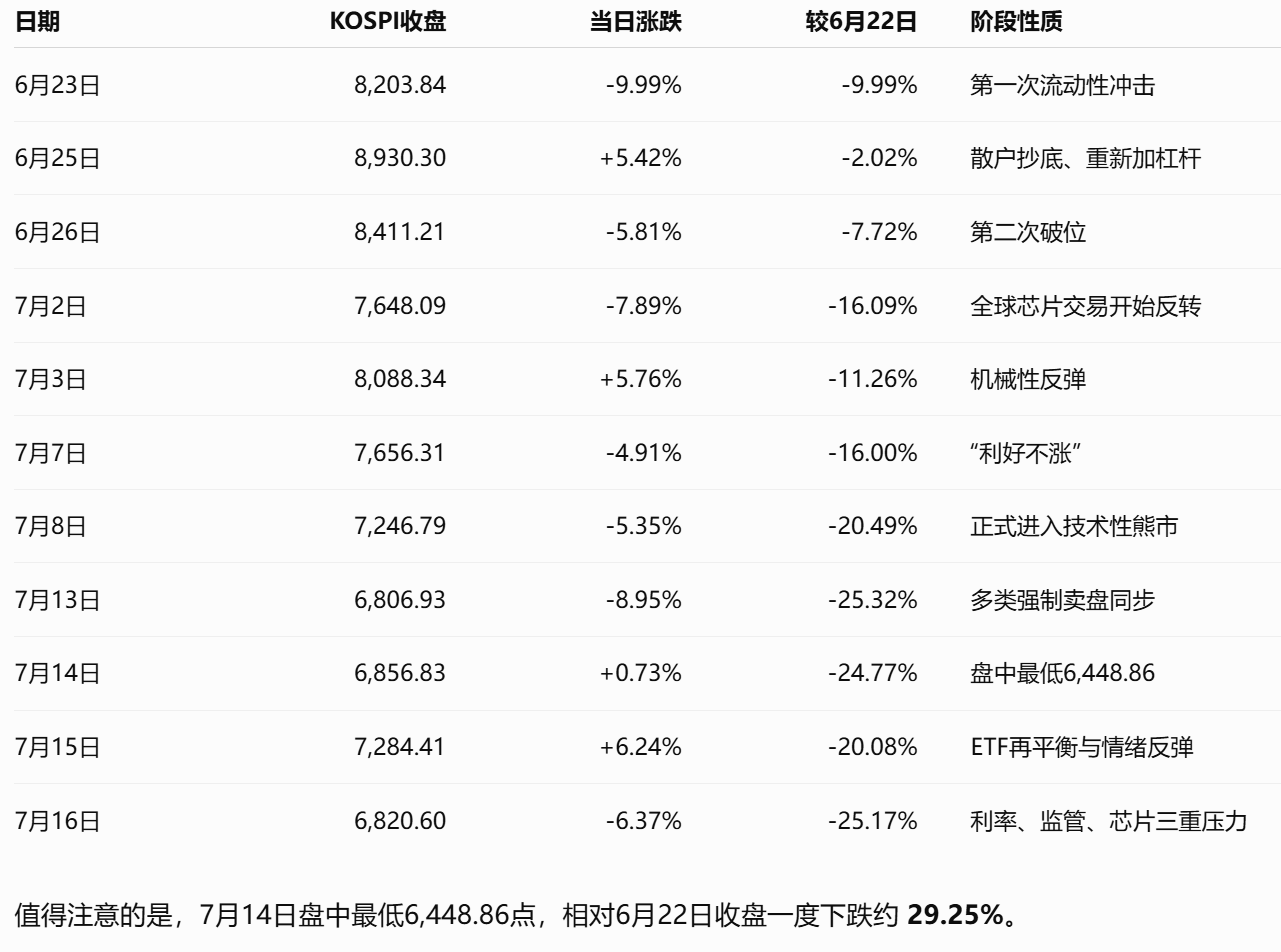
3. Dissecting the Deleveraging Process by Timeline
Phase 1: June 23rd – Prices Crashed First, but Debt Did Not Decline
On June 23rd, the KOSPI fell 9.99% in a single day, with Samsung Electronics and SK Hynix both dropping over 12%, triggering a 20-minute market-wide trading halt.
Direct triggers included:
- The strong warning from regulators regarding leveraged ETFs the previous day;
- Foreign investors began to heavily sell the two chip giants;
- A synchronous adjustment in global tech stocks;
- Following a significant market rally, institutions had demands for profit-taking and rebalancing their overweight positions.
Given that Samsung Electronics and SK Hynix already accounted for more than half of the KOSPI, selling pressure on these two stocks quickly escalated from a stock-specific issue to an index-wide problem.
However, a very important and dangerous phenomenon appeared on this day:
- The amount of forced liquidations rose from approximately 199 billion KRW the previous day to 424.27 billion KRW;
- Unsettled receivables instead increased by 1,816 billion KRW, reaching 1.4792 trillion KRW;
- The balance of credit financing remained around 38 trillion KRW.
In other words, the first day's crash did not lead to a general repayment of debt by investors. On the contrary, some investors continued to use short-term credit funds to add to their positions during the decline.
The Essence of This Stage
This was a price deleveraging, but not a balance sheet deleveraging.
Prices fell rapidly, reducing ETF net asset values and collateral values; however, retail investors did not retreat but instead continued to buy the dip. The original leverage was not cleared, and new leverage was entering.
Emotionally, the market still interpreted the decline as a short-term technical overreaction caused by regulatory comments, rather than a trend reversal.
Phase 2: June 24th to 25th – Forced Liquidations and Releveraging Occurred Simultaneously
On June 24th and 25th, the KOSPI rose by 3.26% and 5.42% respectively, closing on June 25th only about 2% below the June 22nd high.
However, beneath the surface rebound, two completely opposite things were happening internally.
On one side: Forced Liquidations
Publicly reported forced liquidations on June 24th reached approximately 1,107.93 billion KRW. This was mainly short-term credit transactions where investors had failed to replenish funds in time, leading securities firms to process them.
On the other side: New Margin Financing
On the same day, the balance of credit financing instead increased by about 5,392 billion KRW, reaching a record 38.6328 trillion KRW.
This means:
Old accounts were being liquidated, while new or surviving accounts were borrowing even more money to buy the dip.
Consequently, June 24th became the peak of the market-wide credit financing balance for this cycle, not before the crash on June 23rd.
Why Did Leveraged ETFs Amplify the Rebound
2x long ETFs must restore their target 2x exposure daily.
Assume an ETF has an initial NAV of A and holds a stock or derivatives exposure of 2A:
- After the underlying asset falls 10%, the ETF's NAV decreases to about 0.8A;
- The market value of the existing exposure becomes approximately 1.8A;
- The new target exposure should be 1.6A;
- Therefore, it needs to sell about 0.2A worth of assets.
Conversely, when the underlying asset rises, the ETF must buy more to increase exposure.
The Korea Capital Market Institute estimates that the rebalancing trade size of single-stock 2x ETFs is roughly proportional to "previous day's AUM × daily stock price change," and adjustments occur in the same direction in both the spot and futures markets.
Thus, the rebound from June 24th to 25th was simultaneously driven by:
- Retail investors buying the dip;
- Short covering;
- Upward rebalancing by leveraged ETFs;
- Hedging adjustments by securities firms and market makers;
This was not a healthy rebound after completing deleveraging, but rather releveraging in the middle of the deleveraging process.
Phase 3: June 26th to 30th – Foreign Withdrawal, Retail Absorption, Risk Shifting to the Household Sector
On June 26th, the KOSPI fell again by 5.81%. Although it closed down only 0.20% on June 29th, intraday volatility was extreme. The Korea Volatility Index (VKOSPI) surged to an all-time high of 97.99, compared to just 28.85 at the end of 2025.
The most important change in this phase was not any single trading day, but the shift in shareholding structure.
Foreign Investors Were Not Simply "Bearish on Korea," But Reducing Concentration
In the first half of 2026, foreign investors recorded a net outflow of approximately 708 billion USD from the Korean stock market; in June alone, the net outflow was about 126.3 billion USD.
These sell orders came from various institutions:
- Mutual funds sold approximately 75 billion USD;
- Pension funds sold approximately 43.5 billion USD;
- Hedge funds sold approximately 18.7 billion USD.
Analysis suggests that not all of this capital was due to a belief that the Korean economy or semiconductor earnings would collapse. Instead, it was because:
- Korean and Taiwanese chip stocks had appreciated too much;
- The weight of Samsung Electronics, SK Hynix, and TSMC in global funds had rapidly expanded;
- Both passive and active funds needed to control concentration in single countries, single sectors, and single stocks;
- Some funds engaged in currency hedging and benchmark rebalancing;
- Long-term institutions were taking profits.
Retail Investors Became the Final Marginal Buyers
Individual investors in South Korea cumulatively net purchased approximately 42.4 trillion KRW of KOSPI stocks in June.
So the core capital flow structure for June was:
Foreign investors, pension funds, and mutual funds reduced risk, while Korean retail investors took over these positions using cash, margin financing, and leveraged ETFs.
This supported the index in the short term but also produced two consequences:
- Risk shifted from global institutional balance sheets to the balance sheets of Korean households;
- The average risk tolerance of remaining market holders was weaker, making them more sensitive to margin calls and price volatility.
Phase 4: July 1st to 3rd – Global Semiconductor Trade Reversal, ETFs Began Systematic Buying High and Selling Low
On July 1st, the KOSPI fell 2.04%, and on July 2nd, it plunged a further 7.89%.
On July 2nd:
- SK Hynix fell 14.6%;
- Samsung Electronics fell 9.1%;
- Japan's Kioxia fell over 13.5%;
- U.S. semiconductor stocks also experienced significant adjustments the previous night.
The market began to shift from asking "semiconductor earnings are currently strong" to questioning:
- Rumors of Meta selling computing power raised concerns about excess capacity;
- Whether U.S. cloud companies can sustain high levels of AI capital expenditure;
- Whether large-scale data center construction is entering a phase of marginal slowdown;
- Whether trillions of dollars in new capacity from Samsung Electronics and SK Hynix could lead to future oversupply;
- How long the current memory price increases can last;
- Whether the speed and duration of earnings growth are already fully reflected in stock prices.
The Industry Spark and Market Amplifier Must Be Distinguished
The sparks at the industry level were:
- Profit-taking in the global semiconductor sector;
- Doubts about the sustainability of AI capital expenditure;
- The growth rate of memory prices may have peaked;
- New capacity plans could alter future supply and demand dynamics.
But what truly expanded the decline to nearly 8% was the market structure:
- Foreign investors sold heavyweight chip stocks;
- 2x ETFs were forced to reduce exposure as the underlying assets fell;
- Futures and spot market makers simultaneously sold for hedging;
- The index decline widened, reducing the collateral ratio of margin accounts;
- Risk models, stop-losses, and algorithmic capital further reduced positions.
The KOSPI rebounded 5.76% on July 3rd, which can also be explained by the reverse operation of the above mechanisms: retail buying, short covering, and ETFs re-leveraging.
Thus, this phase formed a classic pattern:
ETFs must sell when the market falls, and must buy when it rebounds; the market does not gradually converge, but its up and down swings are both amplified.
The Korea Capital Market Institute also emphasized that the entire volatility cannot be attributed solely to ETFs, as the volatility of U.S. and Japanese memory stocks also rose sharply during the same period, and factors like the Middle East situation, inflation, and global interest rate uncertainty were equally important. ETFs are amplifiers, not the sole root cause.
Phase 5: July 6th to 8th – "Good News Fails to Lift Prices," Sentiment Shifted from Technical Correction to Concerns Over Earnings Sustainability
July 7th was the second key inflection point in market sentiment
Samsung Electronics released preliminary guidance suggesting that Q2 operating profit could increase approximately 19 times year-over-year. However, Samsung shares still fell 6.9% on the day, briefly dropping over 10%; SK Hynix fell 6.1%.
This indicates the market had entered a phase where "good news cannot lift prices":
- It wasn't that earnings were bad;
- It was that previous expectations were already too high;
- Investors started fearing that current earnings are near the cycle's peak;
- Good news was used to take profits, not to chase higher prices.
On that day, foreign investors net sold about 2.9 trillion KRW, while individual investors net bought about 3.2 trillion KRW. More alarmingly, the margin loan balance in the KOSPI market was still around 29.7 trillion KRW, only slightly below the late June peak of 29.8 trillion KRW.
This means that although the index had fallen about 16% from its high, margin debt in the KOSPI had barely decreased.
Risk Began to Spread to Other Industries
July 7th wasn't just about semiconductor declines:
- LG Energy Solution estimated a 77% drop in Q2 operating profit due to weak EV demand, and its shares fell 6.4%;
- Hanwha Ocean fell 22.7% after Canada's submarine project selected a German proposal.
This shows the market began to expand from a semiconductor product structure issue to include:
- Slowing profitability in the battery industry;
- Uncertainty in defense and shipbuilding orders;
- A reduction in


