
不再被噪音淹没:巧用OKX Agent Trade Kit组合套件看清市场动向
- 核心观点:OKX推出的Agent Trade Kit通过三个AI套件(市场筛选与OI分析、情绪雷达、聪明钱信号),将分散的资金动向、市场情绪与顶级交易员方向整合至统一工具,降低信息噪音与误判概率,辅助交易者完成多维度的交叉验证分析。
- 关键要素:
- 市场筛选与OI分析套件:支持全市场合约按7个维度筛选,并提供单合约OI历史分析及全市场OI异动排行,用于追踪资金净流向。
- 情绪雷达套件:聚合3万+核心KOL的X帖文与新闻,量化情绪方向并自动识别异动预警,捕捉先于价格变化的社交热度信号。
- 聪明钱信号套件:基于OKX星球中1000+验证交易员的真实持仓与胜率数据,提供多头投票与资金加权两个维度的方向总览及趋势变化检测。
- 三个套件在Meme币行情复盘案例中展示协同工作流:先用情绪雷达发现热度,再以OI异动确认资金入场,最后用聪明钱验证顶级交易员方向,形成交叉验证。
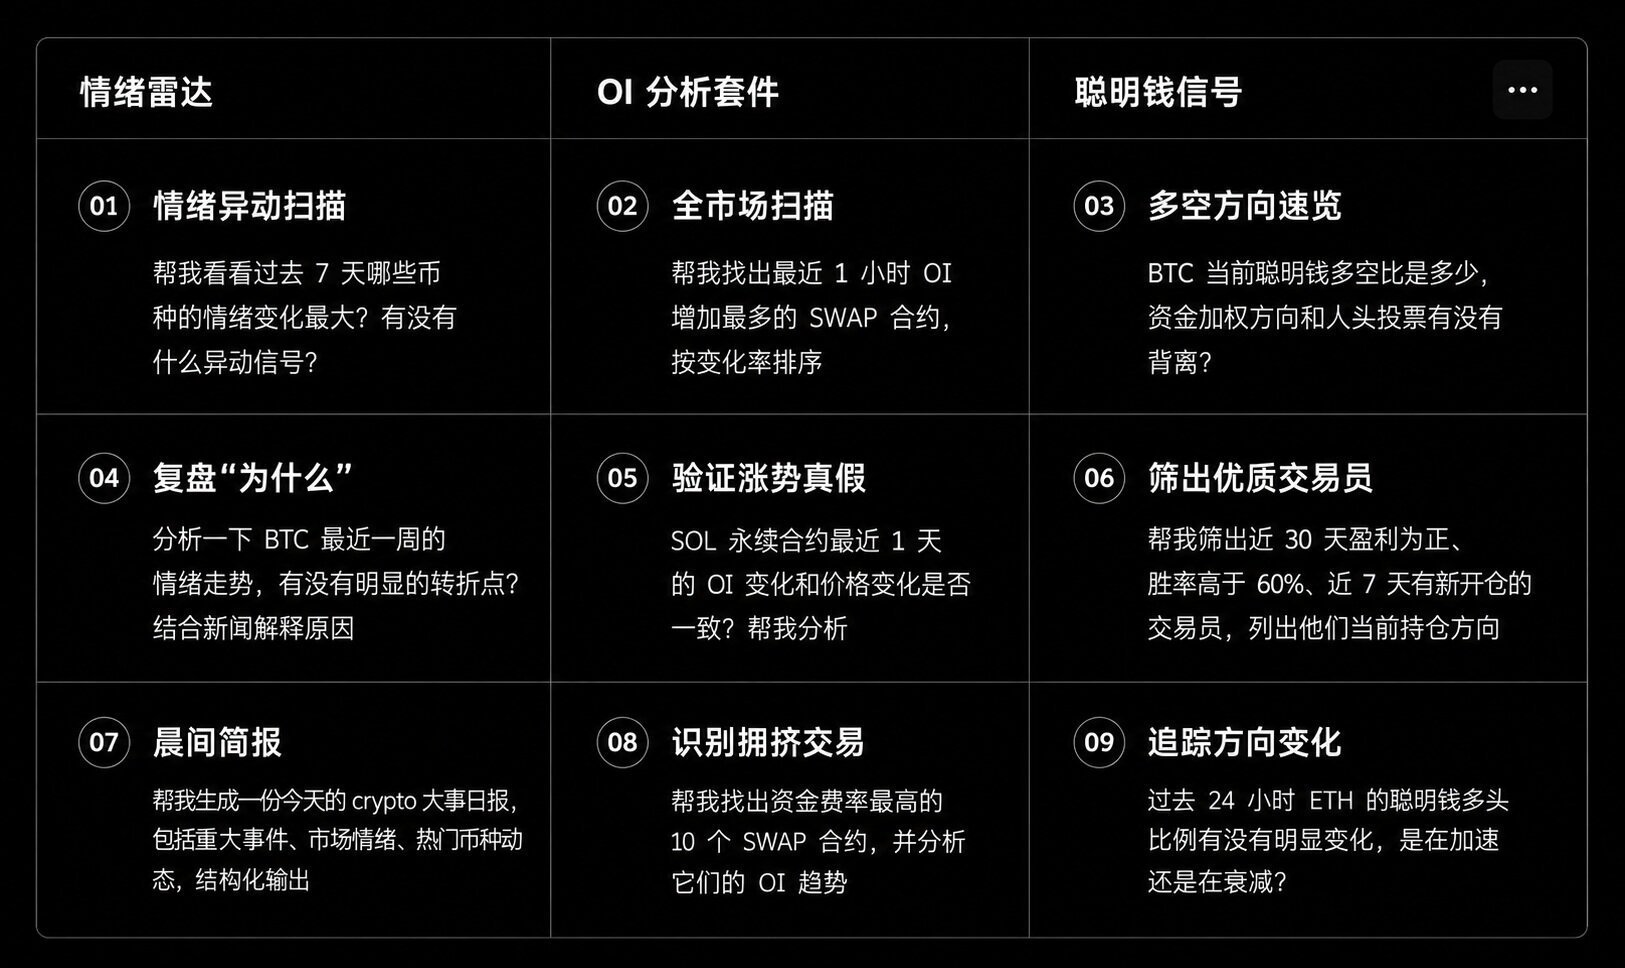
- 组合指令示例展示了五步分析流程:筛选合约→OI增量排序→情绪评分与新闻分析→聪明钱方向与胜率→四维度综合研判,最终输出交易决策依据。
In trading, the real challenge is often not a lack of information, but an overload of it. Every coin's price changes in real-time, OI data fluctuates constantly, and social media, communities, and news feeds are overflowing with sentiment and trends. However, most of this is noise, and truly valuable information is often buried. Making matters more difficult, these signals are scattered across different places: sentiment is hidden in Twitter communities, open interest is on data websites, news comes through media feeds, and market prices are on exchanges. The market never lacks data; what it lacks is a tool that can simultaneously aggregate capital flows, market sentiment, and the direction of top traders, helping you quickly form a judgment.
The three Agent suites now live on the OKX Agent Trade Kit are designed to solve precisely this problem. The Market Screening & Open Interest (OI) Analysis Suite tracks capital flows, the Sentiment Radar Suite captures market sentiment, and the Smart Money Signals Suite tells you which side consistently profitable traders are on. Combined, they allow AI to perform the analysis that previously required cross-platform, time-consuming effort, significantly reducing the probability of misjudgment.
What Are the Three Agent Suites?
Market Screening & OI Analysis Suite: Follow the Money
OI (Open Interest) is one of the most critical indicators for gauging market capital flow. A price increase alone doesn't tell the whole story; a simultaneous increase in OI indicates genuine capital inflow, not just internal speculation among existing funds.
However, before this suite existed, conducting a proper OI analysis was not easy. Filtering actively traded contracts required pulling global data. Checking funding rates meant calling APIs one by one. Analyzing OI historical trends involved manually running calculations, which had a high error rate, let alone making judgments on top of that. This suite compresses these tasks into a single call, offering three core capabilities:
- Full Market Screening: Supports all asset types including spot, perpetual swaps, and delivery contracts. Filter and sort simultaneously by 7 dimensions such as price change, trading volume, funding rate, and OI, getting the desired results in one go.
- Single Contract OI History Analysis: Offers five granularities from 5 minutes to 1 day. Built-in OI Delta and change rate directly reveal whether capital is flowing in or out during a specific time window.
- Full Market OI Anomaly Rankings: Scans the entire market for OI change rates in real-time. Instantly see which assets are experiencing a sudden surge in open interest.
Sentiment Radar Suite: Understand the True Market Mood
Behind price movements lies human emotion. In the crypto market, sentiment often changes *before* price. Signals like a sudden spike in a coin's social heat may occur while the price remains unchanged.
The Sentiment Radar front-loads this 'information gap'. It also integrates three core modules:
- News Aggregation: Connected to mainstream media sources. Automatically deduplicates multiple reports on the same event, preventing repetitive content from wasting your attention.
- Sentiment Quantification: Aggregates X (Twitter) posts from over 30,000 core crypto KOLs globally. Accurately tags each post with the relevant coin and sentiment direction, strictly filtering out engagement-farming content to ensure data quality.
- Anomaly Alerts: Automatically identifies sentiment reversals and social heat explosions. You don't need to watch the data constantly; the Agent alerts you when a signal emerges.
Smart Money Signals Suite: See What Profitable Traders Are Doing
What direction are those who are consistently profitable taking right now? Let the Smart Money Signals Suite answer this question. Its data source comes from over 1,000 verified top traders in the OKX community, with real data on their positions, win rates, and P&L. This fundamentally differs from on-chain smart money tracking: on-chain tracks anonymous wallets, where you don't know who is behind them, their historical win rate, or if their profits are real. The data criteria for OKX Smart Money are clear: assets of no less than 10,000 USDT, historical profits of no less than 1,000 USDT, active in the last 14 days, with verifiable win rates and P&L for each trader. Specifically, this suite offers four core capabilities:
- Smart Money Direction Overview: Provides both vote-counting and capital-weighted voting dimensions. Divergence between the two is a signal in itself.
- Trader Filtering: Supports multi-condition cross-filtering, e.g., "profitable in the last 30 days, win rate > 60%, opened new positions in the last 7 days."
- Signal Quality Assessment: A 70% bullish sentiment backed by traders averaging a 79% win rate differs vastly in reliability from one backed by traders averaging a 52% win rate. The Agent directly tells you the historical accuracy of the signal source.
- Trend Change Detection: Whether the 70% bullish sentiment rose from 50% or fell from 85% carries completely different implications. The Agent covers 1-hour, 24-hour, and 7-day windows to help you judge if a trend is initiating or fading.
How to Use the Agent Suites
Currently, the three suites are integrated within the OKX Agent Trade Kit, compatible with all AI clients supporting the MCP protocol, such as Claude, Cursor, and VS Code. The OKX Agent Trade Kit is an open-source exchange MCP toolkit designed for AI Agents and professional traders. Learn more: https://www.okx.com/zh-hans/agent-tradekit
Now that we understand what the three suites are and what they can do, let's apply them to practical scenarios. Here are a few examples for reference:
The Sentiment Radar acts as a "thermometer," letting the Agent monitor market sentiment for you. Sentiment often signals before price, and this tool compresses the time needed to capture that signal from browsing multiple platforms down to a single query.
The OI Analysis Suite addresses the capital flow aspect. Simply watching price movements isn't enough; you need to know if capital is truly entering or exiting. Changes in open interest are often more honest than price itself, making it one of the most direct tools for gauging trend authenticity and preemptively avoiding liquidation risks.
The Smart Money Signals solves another problem: even with capital moving and sentiment rising, you still need to know where the truly profitable traders are positioned. Its value isn't just "how many are bullish," but "how historically accurate are those bulls, and how large are their positions?" These two answers are often more valuable than a simple vote count.
How to Combine the Three Suites for Cross-Validation
Every single indicator has its blind spots. A surge in OI isn't necessarily good news; it could be shorts heavily building positions. Collective bullish sentiment doesn't guarantee profitable entry; the move might have already played out. Even if smart money is bullish, their win rate needs verification. Truly valuable judgment comes from layering multiple signals; when they point in the same direction simultaneously, that's when it's worth taking seriously.
The combination of OI and price forms a basic four-quadrant judgment framework.
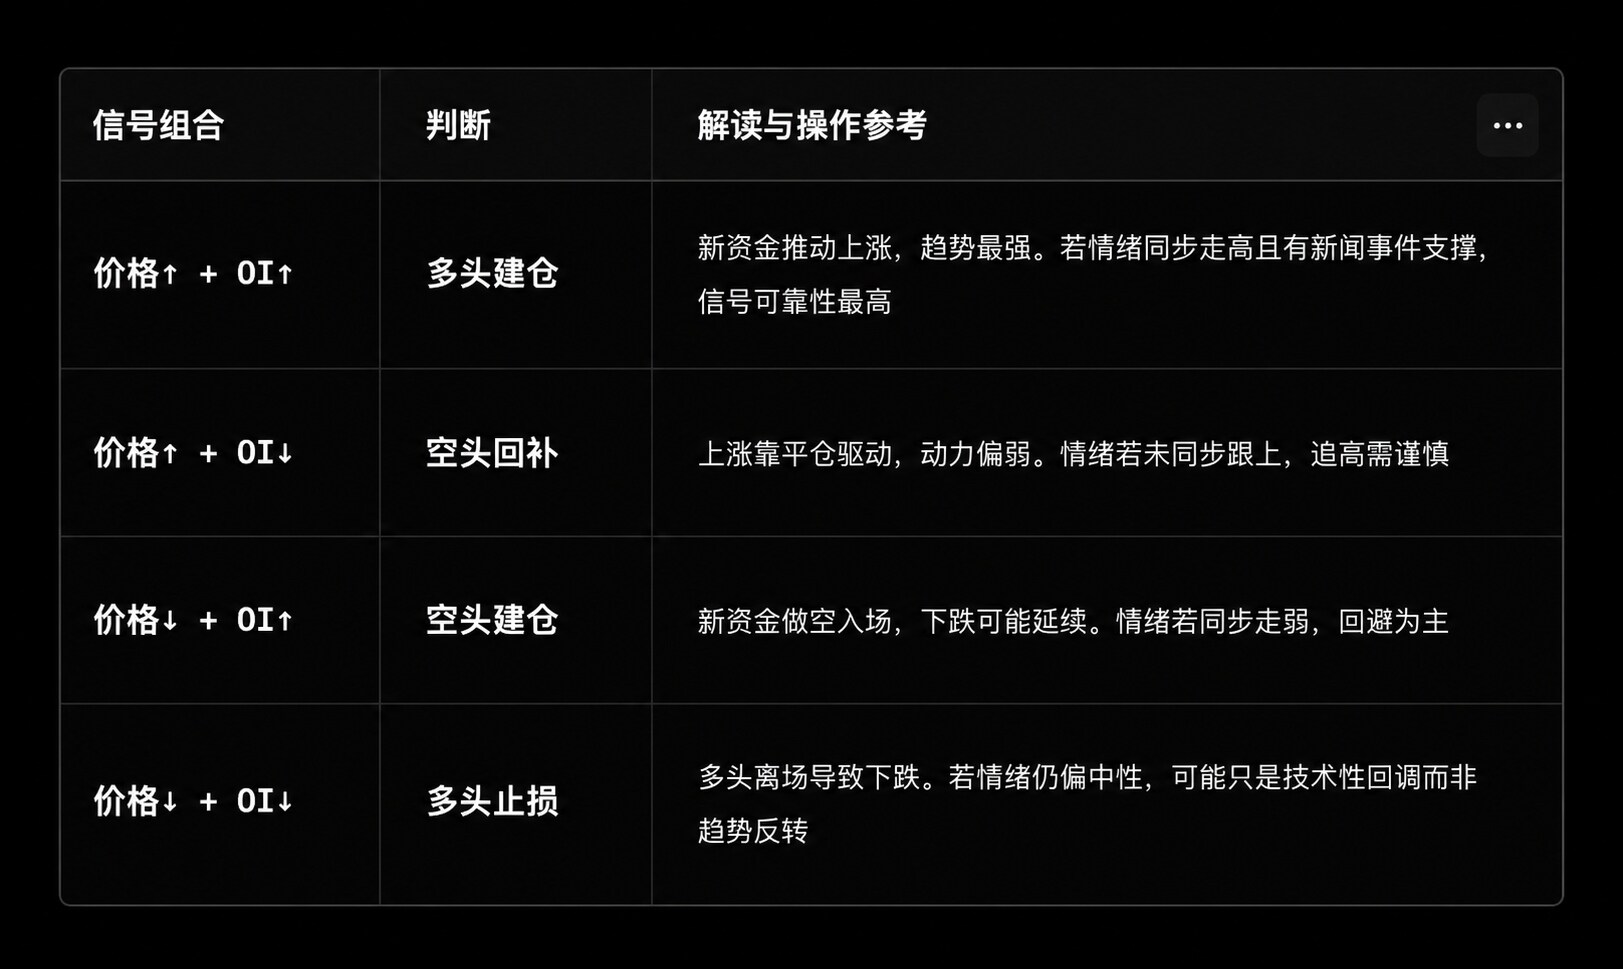
Adding sentiment data to this framework further refines judgment. For the same "Price ↑ + OI ↑" scenario, if sentiment is also rising, communities are actively discussing it, and it's backed by specific news events, the signal quality is vastly different from a scenario where sentiment is flat or bearish. Conversely, if sentiment explodes but OI doesn't follow, it suggests retail hype without real capital backing – a signal that historically warrants high caution.
Finally, adding the Smart Money dimension provides final confirmation: Are traders with a history of high win rates and significant capital also building positions in the same direction? When all three dimensions align towards one direction for an asset, the signal's credibility is on a different level.
Example of a combined instruction:
You are a professional crypto analyst. Execute the following strategy: Step 1: Screen USDT perpetual contracts with 24h volume > 50 million USDT and select the top 20 by price change. Step 2: For the screened contracts, check the 1-hour OI change rate and identify the 5 with the largest OI increase. Step 3: For these 5 contracts, analyze the current sentiment score and recent news events. Step 4: Check the smart money long/short direction and average win rate for these 5 contracts. Step 5: Combine the four dimensions (Price, OI, Sentiment, Smart Money) to output a comprehensive assessment and recommendation.
Case Study: How to Preemptively Capture Price Anomaly Signals
In early 2026, Meme coins experienced a concentrated wave of anomalies. According to Coinglass data, DOGE's 24-hour open interest (OI) surged over 45%, with trading volume climbing sharply towards 2 billion USD. Tokens like PEPE, SHIB, and WIF also saw significant OI increases over short periods. While everyone noticed the resulting price volatility, the signals had actually appeared earlier, scattered across different sources, and most people failed to connect the dots.
Reconstructing this scenario using the three suites, the signal capture path likely looked like this:
- Step 1: Full Market Scan with Sentiment Radar. Have the Agent scan for coins with the most significant sentiment change in the past 24 hours. Meme coins often follow a pattern where sentiment leads: as social media activity around a coin intensifies and social heat rises rapidly, the price hasn't moved yet. This is the earliest signal.
- Step 2: Cross-Validation with OI Anomaly Rankings. After a sentiment signal appears, immediately use the OI suite to check the coin's open interest change. If sentiment rises *and* OI increases rapidly, it indicates real capital is following, not just retail hype. This is a stronger, more reliable entry signal than sentiment alone.
- Step 3: Crowdedness Confirmation with Funding Rate. Check the contract's funding rate. If OI surges but the funding rate remains within a normal range, the long setup signal is relatively clean. If the funding rate is already extremely high, it suggests longs are crowded, and entry risks facing liquidation if the move reverses.
- Step 4: Final Confirmation with Smart Money Direction. Use the Smart Money suite to check the direction of top traders for these Meme coins. If high-win-rate, large-capital traders are also going long simultaneously, the three dimensions resonate, and signal reliability increases significantly. Conversely, if smart money direction diverges from sentiment and OI, caution is warranted.
- Step 5: News Event Correlation. Finally, have the Sentiment Radar pull related news to judge if the sentiment wave is supported by tangible events. Anomalies driven by clear events tend to have better sustainability; moves purely driven by hype often rise quickly and fall just as fast without warning.
The value of the three suites isn't in their individual use, but in the signal amplification effect achieved through cross-validation. The data layer tells you "who is moving," the sentiment layer tells you "why it's moving," and the smart money layer tells you "how profitable traders view the move." A suggested workflow: first narrow down the list using OI anomalies, then validate the direction with sentiment, and finally confirm alignment with top traders using smart money.
Conclusion
Trading has never been something you can do well with just a single piece of information. Information is noisy, sentiment can be distorted, and even the smartest money can make mistakes. The true way to reduce misjudgment is never to find a universal indicator, but to allow signals from multiple dimensions to validate and check each other.
What the OKX Agent Trade Kit composite suite can do is not make decisions *for* you, but ensure that *before* you decide, the information you hold is more complete, faster, and more logical than what others have. The judgment, from start to finish, remains in your hands.
Disclaimer: This article is for informational purposes only. The views expressed here are solely those of the author and do not represent the position of OKX. This article is not intended to provide (i) investment advice or an investment recommendation; (ii) an offer or solicitation to buy, sell, or hold digital assets; or (iii) financial, accounting, legal, or tax advice. We do not guarantee the accuracy, completeness, or usefulness of such information. Holdings of digital assets (including stablecoins and NFTs) involve high risk and can fluctuate significantly. You should carefully consider whether trading or holding digital assets is suitable for you based on your financial situation. Please consult your legal/tax/investment professional regarding your specific situation. You are solely responsible for understanding and complying with applicable local laws and regulations.


