LD Capital宏观周报(12.25):数据顺风,红海危机,Repo见底,基金经理FOMO,散户情绪过热

上周市场得到进一步数据支撑,表明美国经济不仅实现了软着陆,而且经济进展平稳,没发生担忧中的通胀回升,进而延长美联储加息周期。之前市场一直在辩论经济实现软着陆的可能性,同时也在考虑长期高位利率环境的前景。但在前周美联储的鸽派转变之后,这种观点发生了快速变化,因为通胀加速放缓,增长保持稳固,实际收益率回落,股市也应声上涨,金融条件迅速放宽。投资者最近表现出了对股票的浓厚兴趣。美国银行称客户最近一周净买入 64 亿美元的美国股票,这是自 2022 年 10 月以来最大的单周净流入。
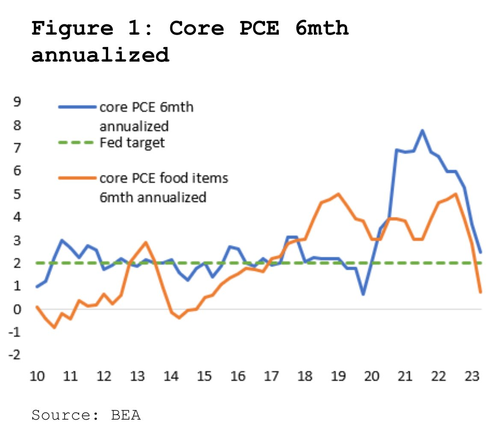
上周在通胀压力继续消退, 11 月名义 PCE 环比首次出现负数,核心 PCE 价格环比增长 0.1% ,低于预期,年率下降至 3.2% ,从六个月年化数据看联储基本已经完成物价目标
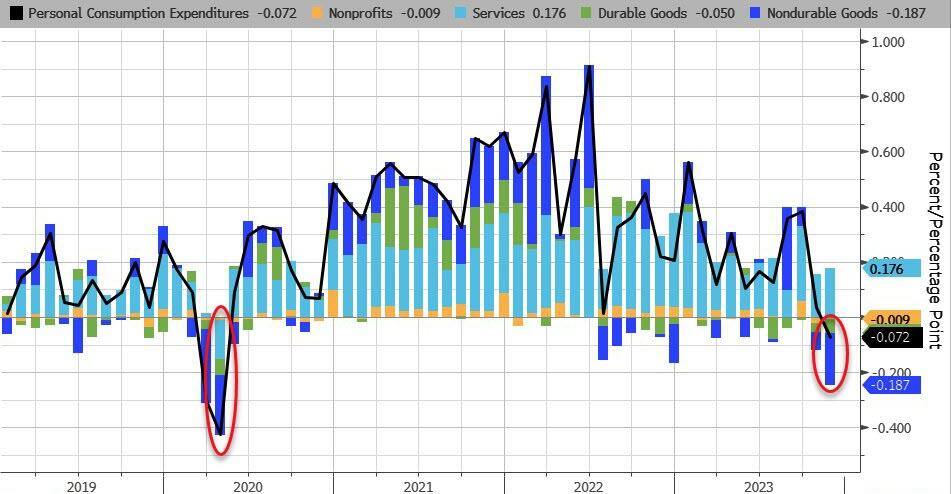
并且收入和支出同时反弹:
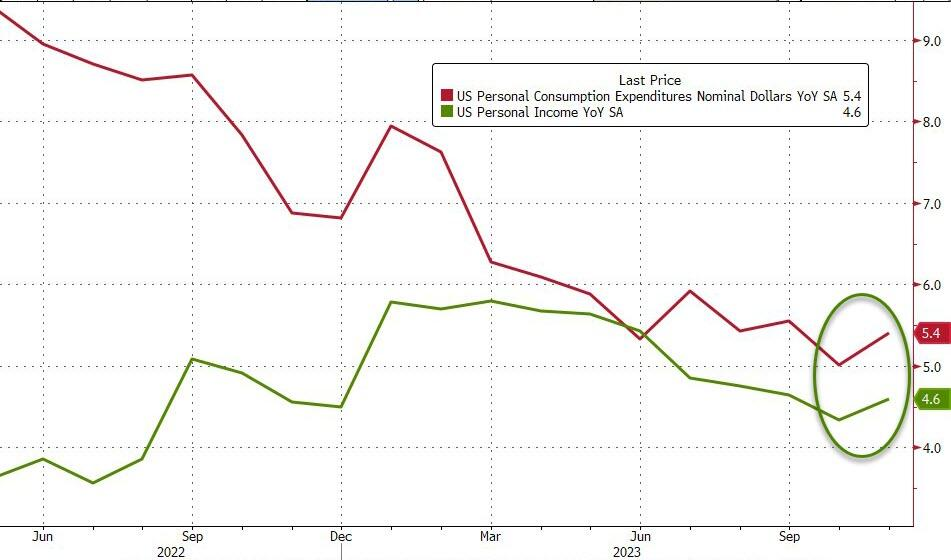
在经济数据方面,上周的包括费城联储调查和消费者信心调查 — — 表明经济仍在增长,但速度不太快;与此同时,美国 11 月份耐用品订单超出了投资者的预期。耐用品新订单增长 5.4% ,高于预期的 2.2% 。10 月份耐用品订单萎缩 5.1% 。上周第三季度 GDP 小幅下修至+ 4.9% ,但这仍然是自 2014 年以来最强劲的季度 GDP 增速(不包括疫情后重新开放阶段)。美国 11 月新建房屋销售暴跌,原因是抵押贷款利率上升对购房者造成了不利影响,但考虑到二手挂牌量也急剧萎缩,且冬天本来就是淡季,市场对此数据没有过多关注。
现在市场的主题是美国经济 no landing,所谓的 landing 原本市场预期以 2023 年第四季度/2024 年第一季度活动低谷为标志,不过在这段时间内美国 GDP 依旧有望达到 2% ,然后重新加速。
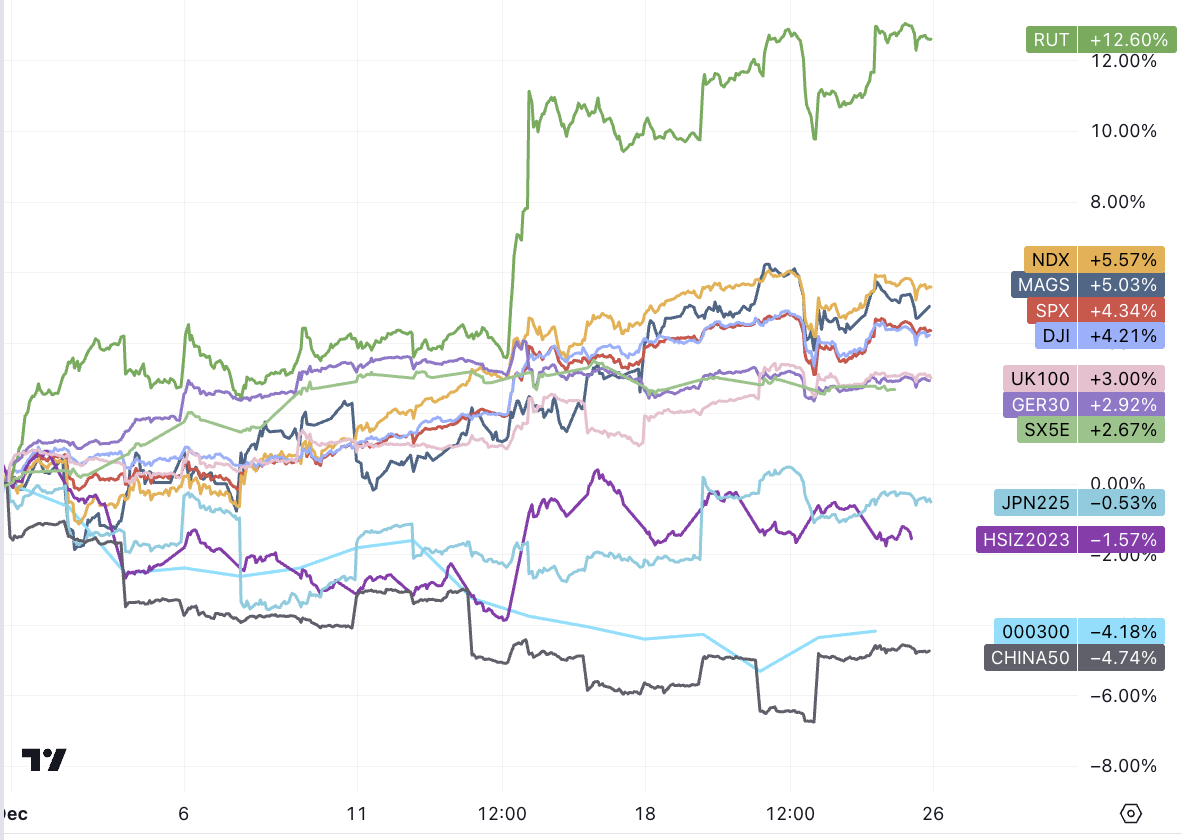
美股连续第八周上涨(SPX 2017 年来最长连涨记录),尽管周三盘中跳水 1.5% ,没有明显的原因也没有过多的讨论,零星有评论归因于台海地缘紧张局势升级或大规模标普 500 看跌期权交易。主流的理解还是更合理的解释还是技术面的,市场连续上涨后需要一些冷静的空间。
周五,中国推出一系列限制玩家电子游戏支出的新措施,在全球股市引发涟漪。不止腾讯网易大跌,法国育碧,美国 unity 都跟跌。腾讯的大股东 Naspers/Prosus 大跌 20% 。
沪深 300 指数周五创下连续第六周的下跌,这是自 2012 年 1 月以来最长的连续下跌。该指数今年下跌了近 14% ,落后于全球大多数主要国家股指。金龙指数 2023 年跌幅加深至 8% 左右,远远落后于纳斯达克 100 指数 54% 的涨幅。随着政策制定者加大支持力度,一些人再次燃起希望,认为 2024 年会更好,特别是考虑到中国股市估值低廉。
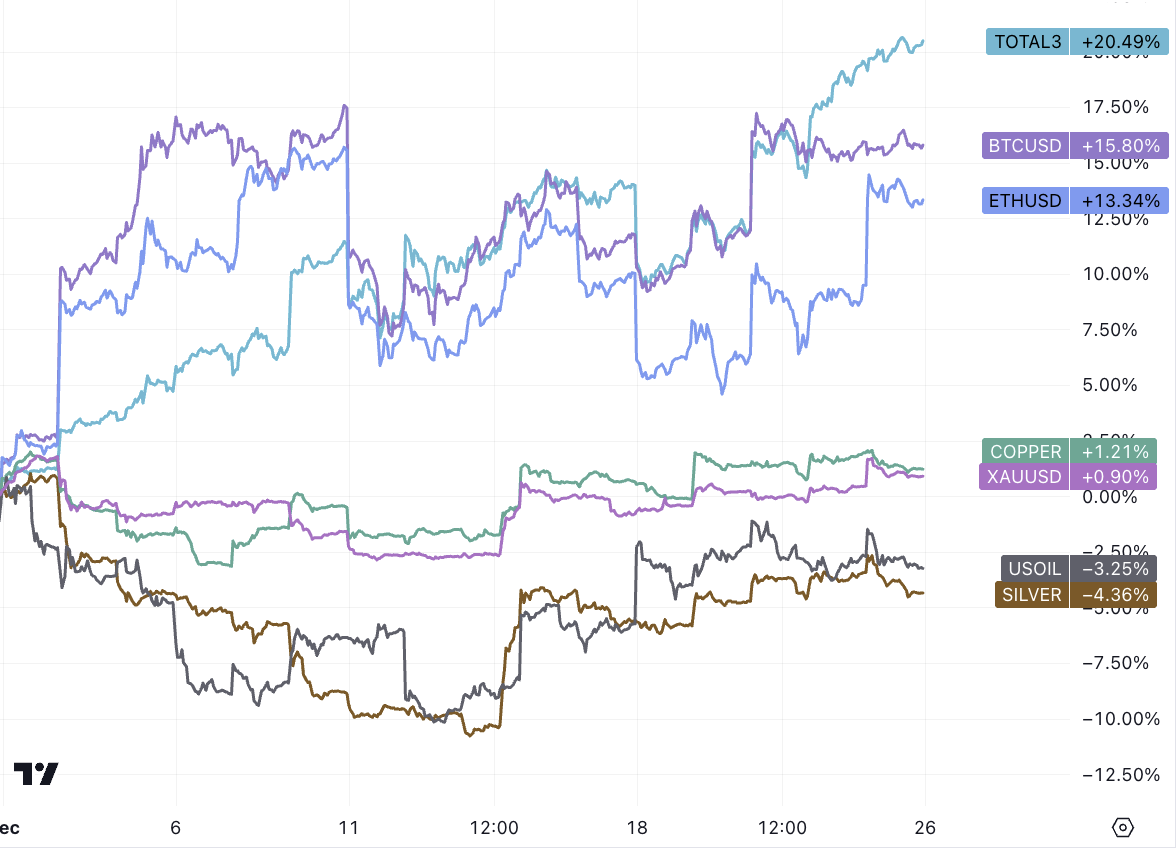
原油净多头上周自 9 月底以来首次增加,从创纪录的低点反弹,主要由于胡塞武装对穿越红海的商船进行袭击,导致运输从制成品到石油和大宗商品等各种商品的公司股价上涨,石油价格录得数月来最大单周涨幅。
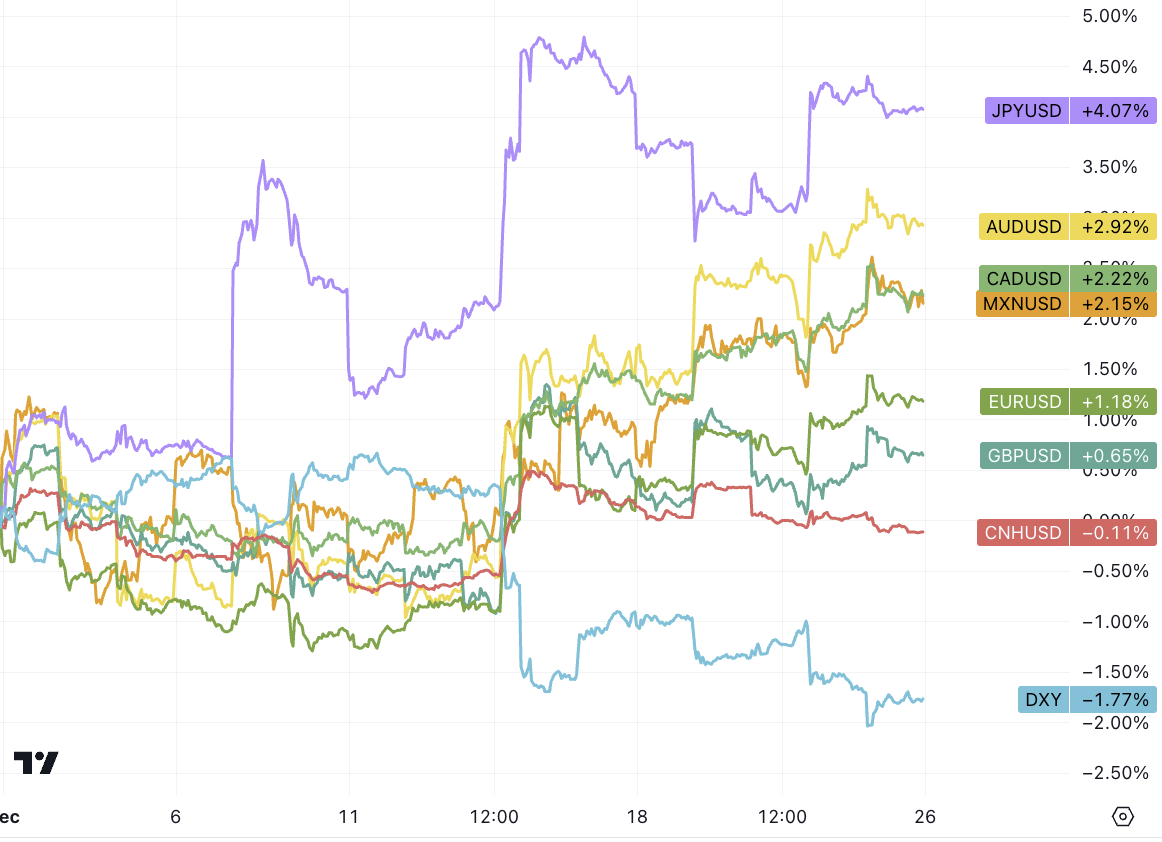
投机者正在加大对加元的看跌押注,将净空头头寸提升至近五年来的最高水平。主要因通胀依然顽固,增长乏力
本周美债收益率总体继续下行,但降幅不及美联储会议释放鸽派大转向信号的前周,短债跌幅偏大, 10 Y 依旧持平 3.9% , 30 Y 持平 4% :
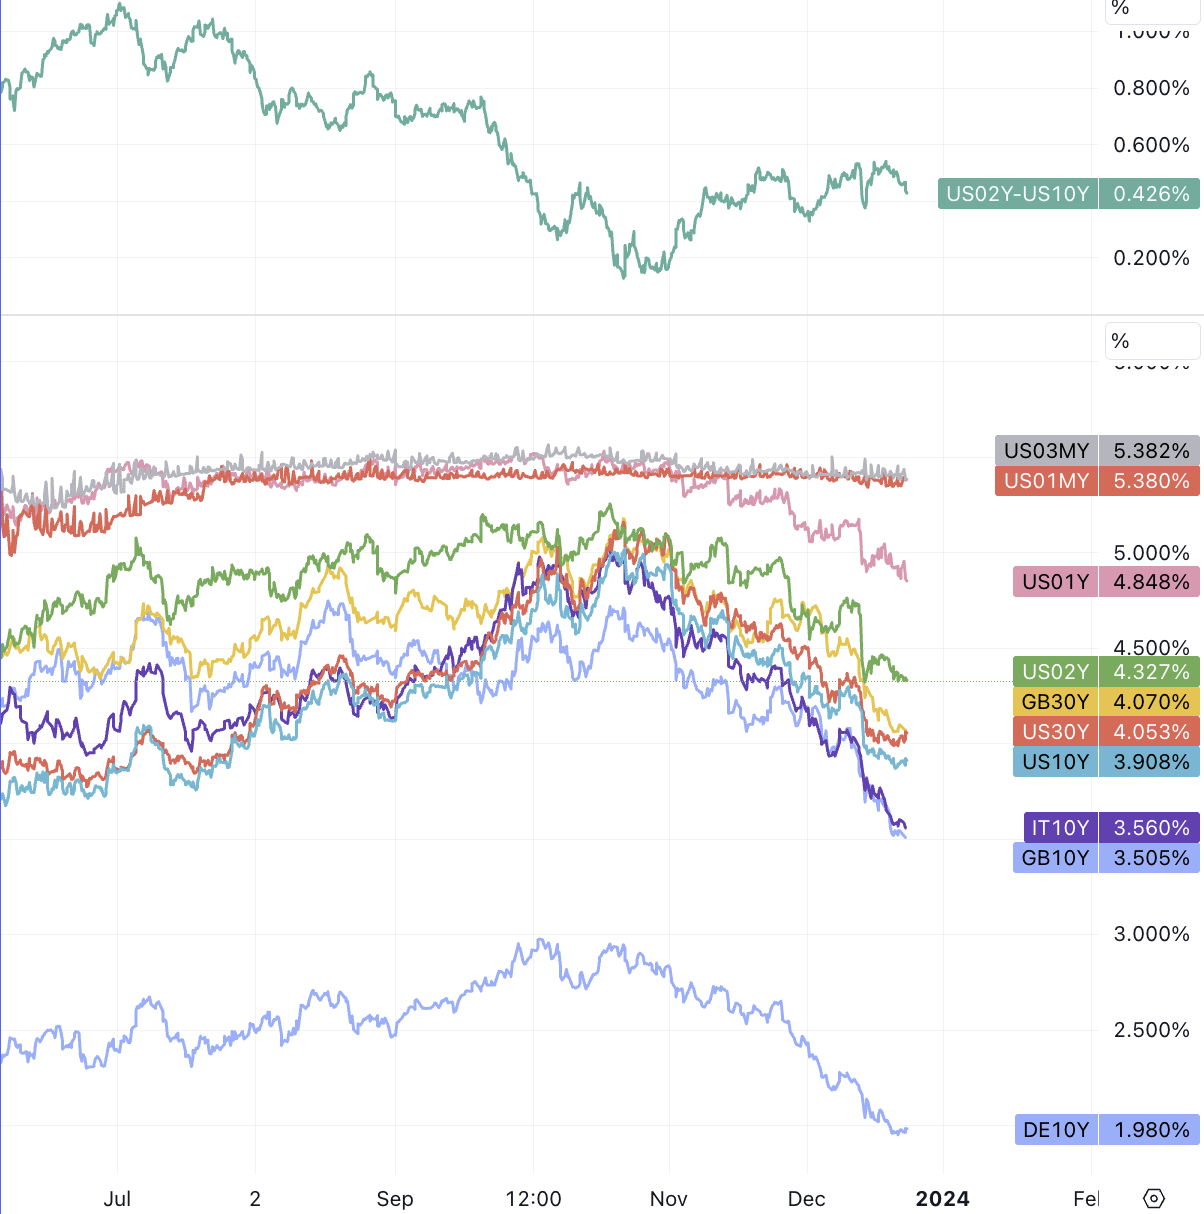
市场押注美联储将在 3 月份开始降息 160 个基点,要实现市场定价的目标,劳动力等一些指标需要大幅恶化,目前并看不到这种情况出现的迹象:
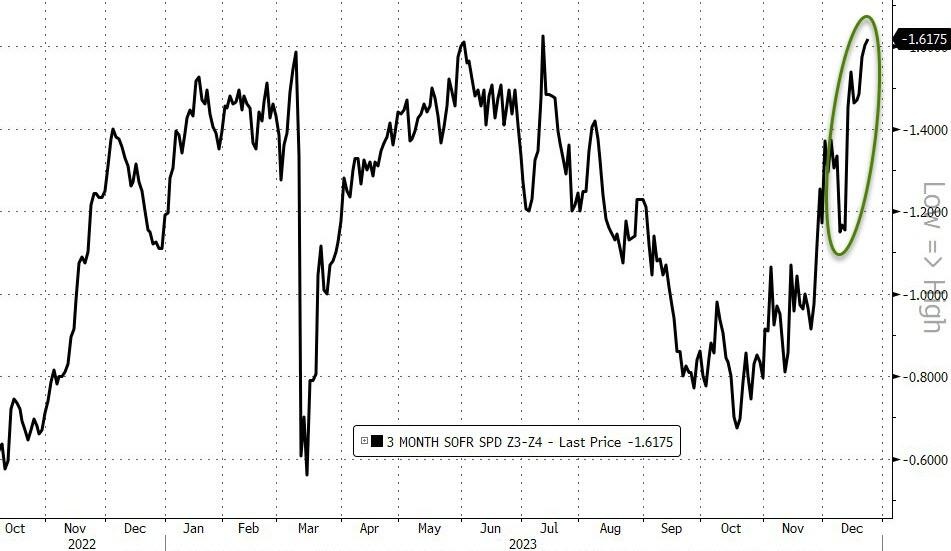
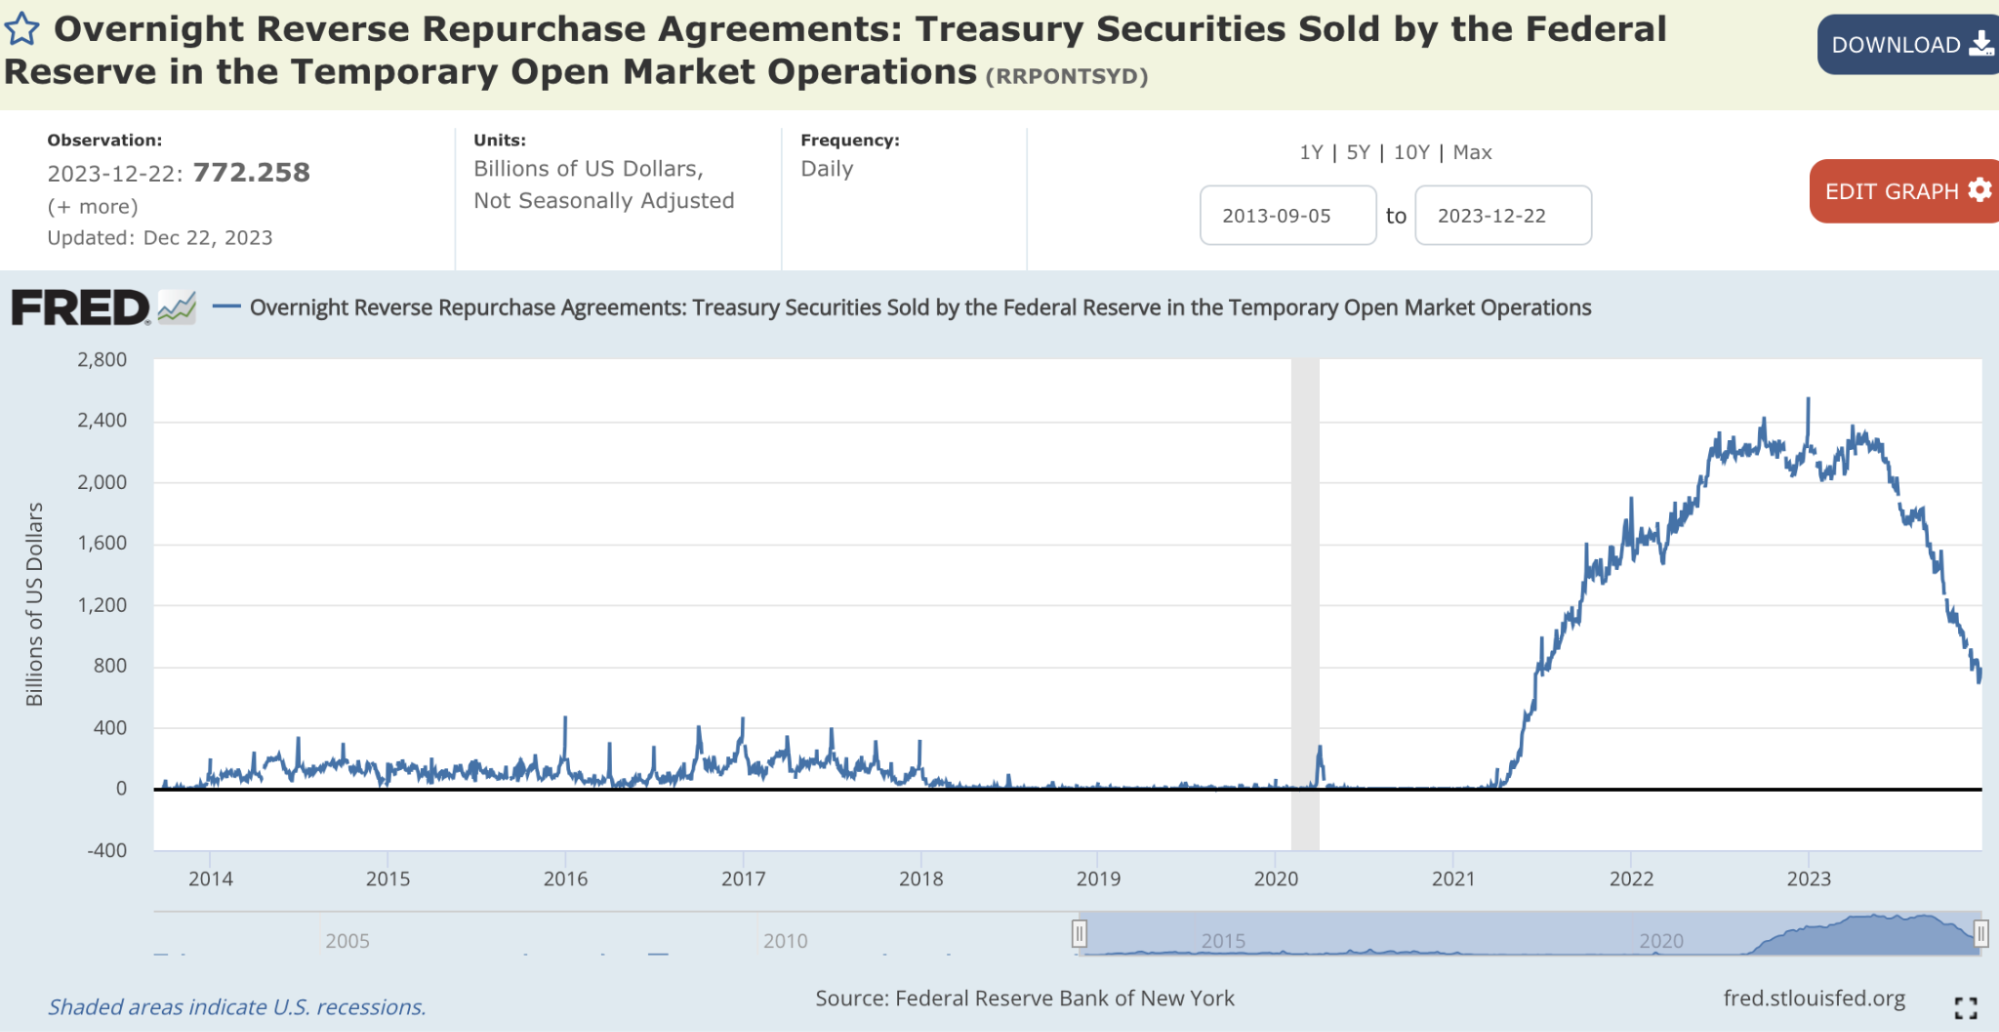
回想起 7 ~ 9 月市场担心的财政纪律混乱的主题让股票和债券市场大跌,实际上到了 2024 年也不会有任何好转,只会更差, 2023 年美债的净发行量为 1 万亿美元,但 2024 年将飙升至 1.9 万亿美元,逆回购工具可能会在 3 月份耗尽难以提供更多流动性支撑,这或许是除了通胀之外市场押注联储必须大幅降息的一大背景。
红海危机海运通胀飙升
上周全球金融市场最大的主题可能是红海航运业危机。由于胡塞武装持续发动袭击的风险, 158 艘载有约 1, 050 亿美元海运货物的船只被迫离开红海,导致货物价格飙升。
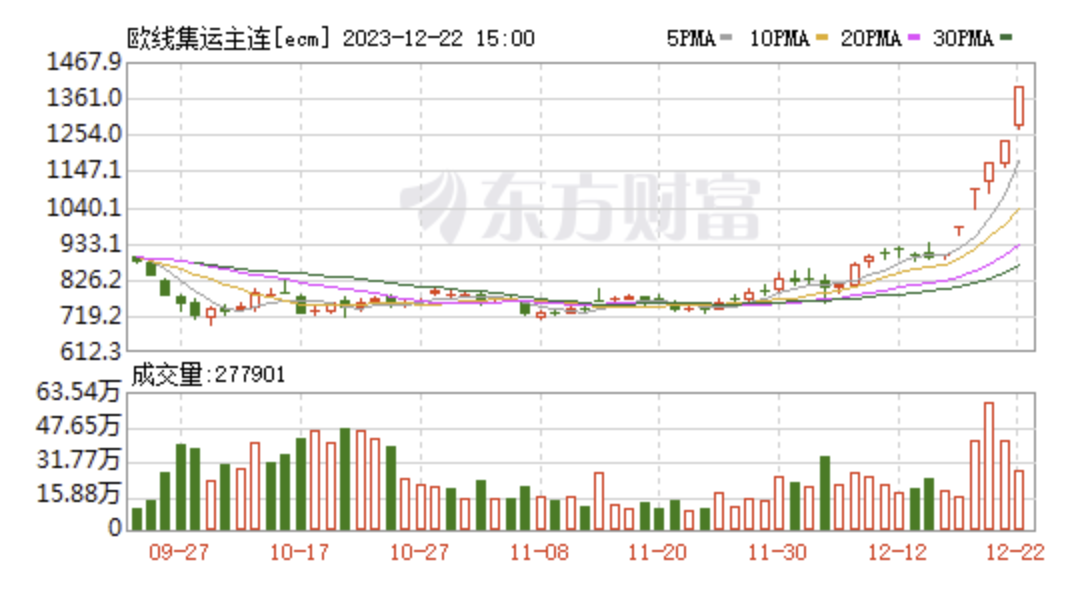
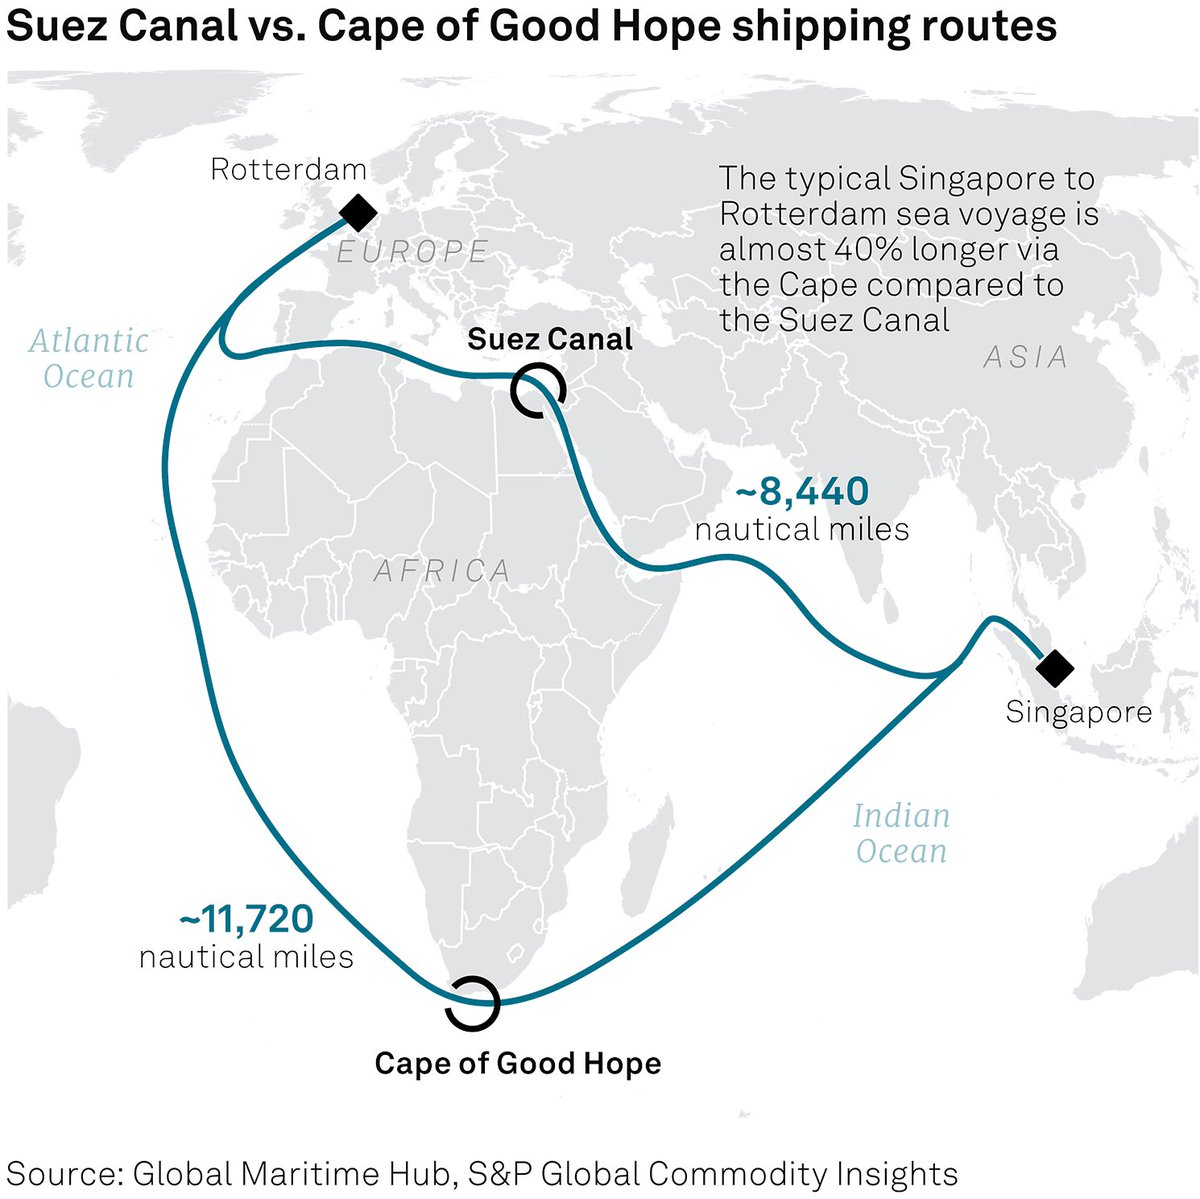
宁波航运交易所 12 月 22 日发布的报告显示,目前 85% 的集装箱船班轮公司均已通知暂停红海航线货物的接载。越来越多的货轮将选择绕道好望角,这意味着,运距和运输成本将会大幅增加。据媒体估算,目前来看总体航程增加了 40% ,运输成本上涨了 40% 以上。这带动国内集运指数、市场运价持续走高。上海国际能源交易中心集运指数(欧线)期货主力合约连续 5 个交易日均触及涨停,一周累计涨幅超过 50% 。
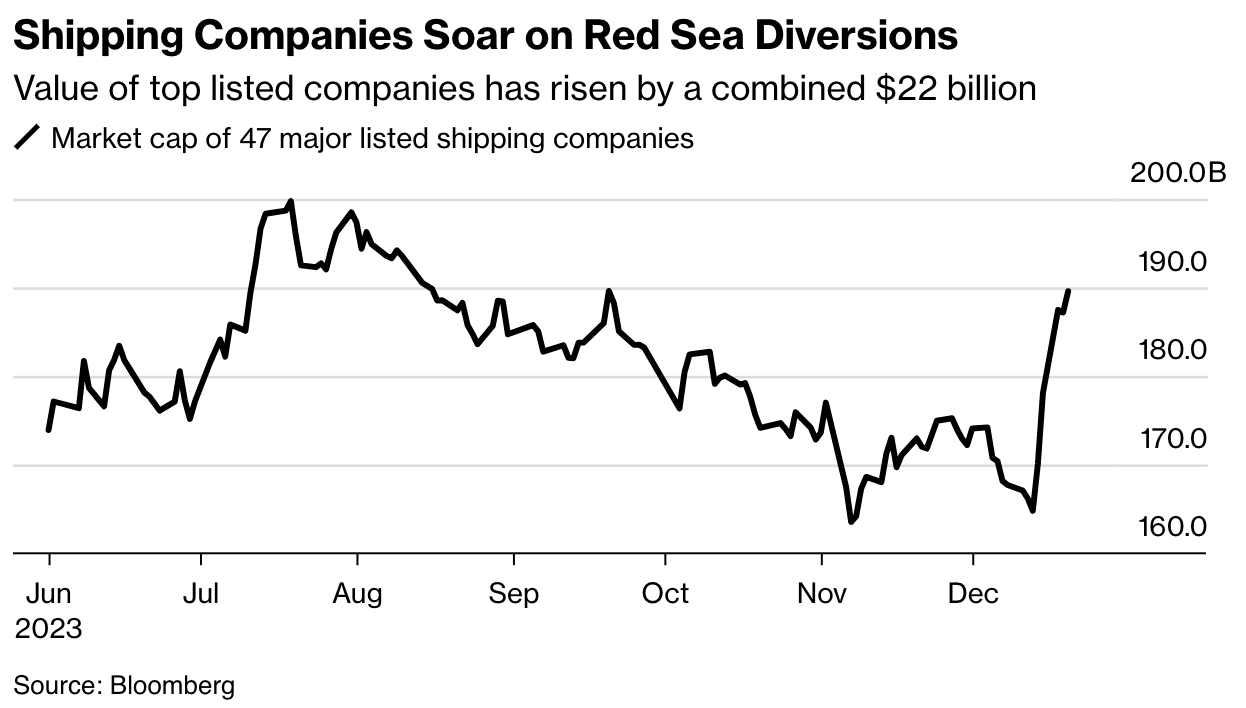
红海中断推高货运成本航运公司财务上将受益,自 12 月 12 日攻击真正加剧以来,全球最大的上市航运公司的总市值已跃升约 220 亿美元。
红海-苏伊士运河走廊占国际贸易的 12% 和全球集装箱运输量的近三分之一。该航线几乎陷入停滞预示全球供应链的混乱将在短期内重新出现。根据媒体上周五报告, 上海到英国的海运费涨至每 40 英尺集装箱 10000 美元,就在前一周这个价格只有 2400 美元。业内专家分析一旦物流紧张时间超过一个月,供应链乃至消费者层面就会感受到并看到通胀压力。
资金流与情绪
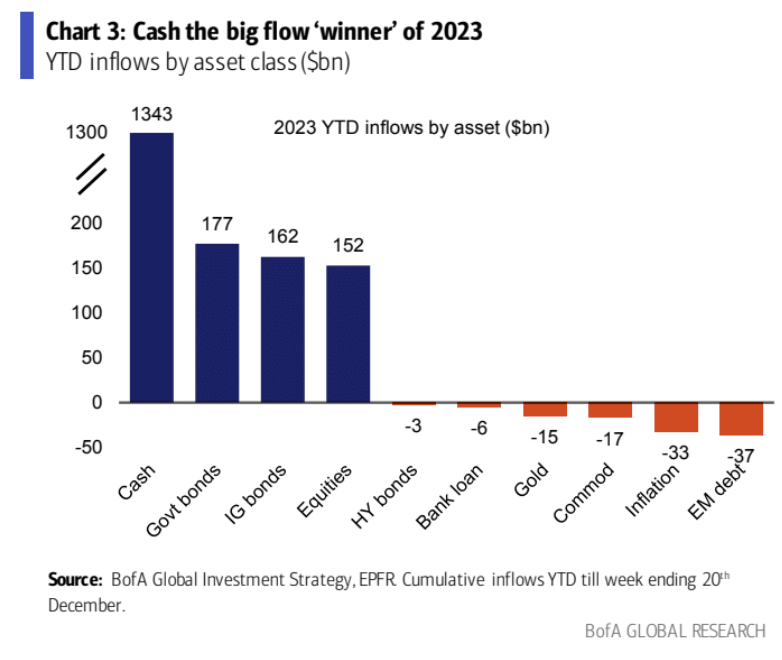
EPFR Global 的数据表示,现金基金吸引了 1.3 万亿美元的资金流入,使流入全球股市的 1, 520 亿美元相形见绌。投资者对美国国债的投资也比以往任何时候都多,达到 1, 770 亿美元。这些数据说明,在经历了惨淡的 2022 年之后,今年的股市反弹如何让大多数投资者感到意外。这可能意味着,如果央行的预期符合预期,新的一年仍有大量资金在观望,等待被推入股票和债券。
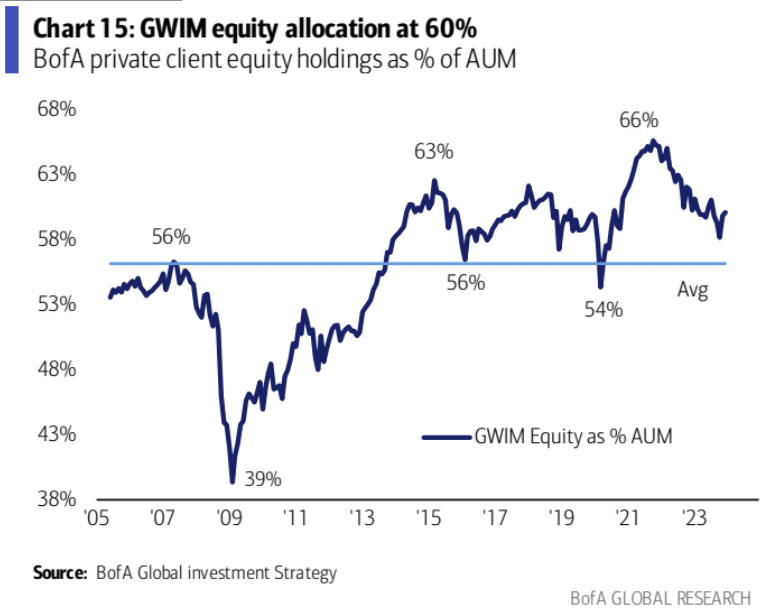
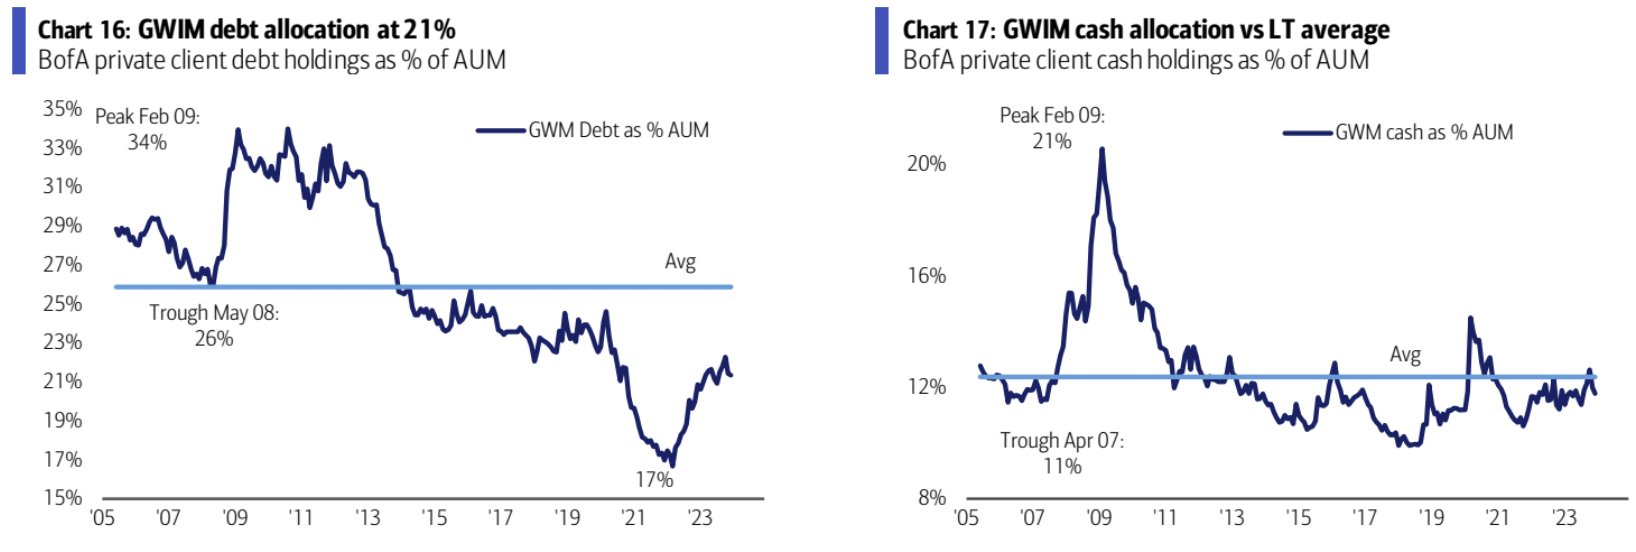
美银财富管理客户股票持仓 60% , 21.4% 债券, 11.8% 现金,股票比例在上升,债券现金比例在下降:
过去两周 GS 对冲基金客户的总杠杆率和净杠杆率都加速爬升
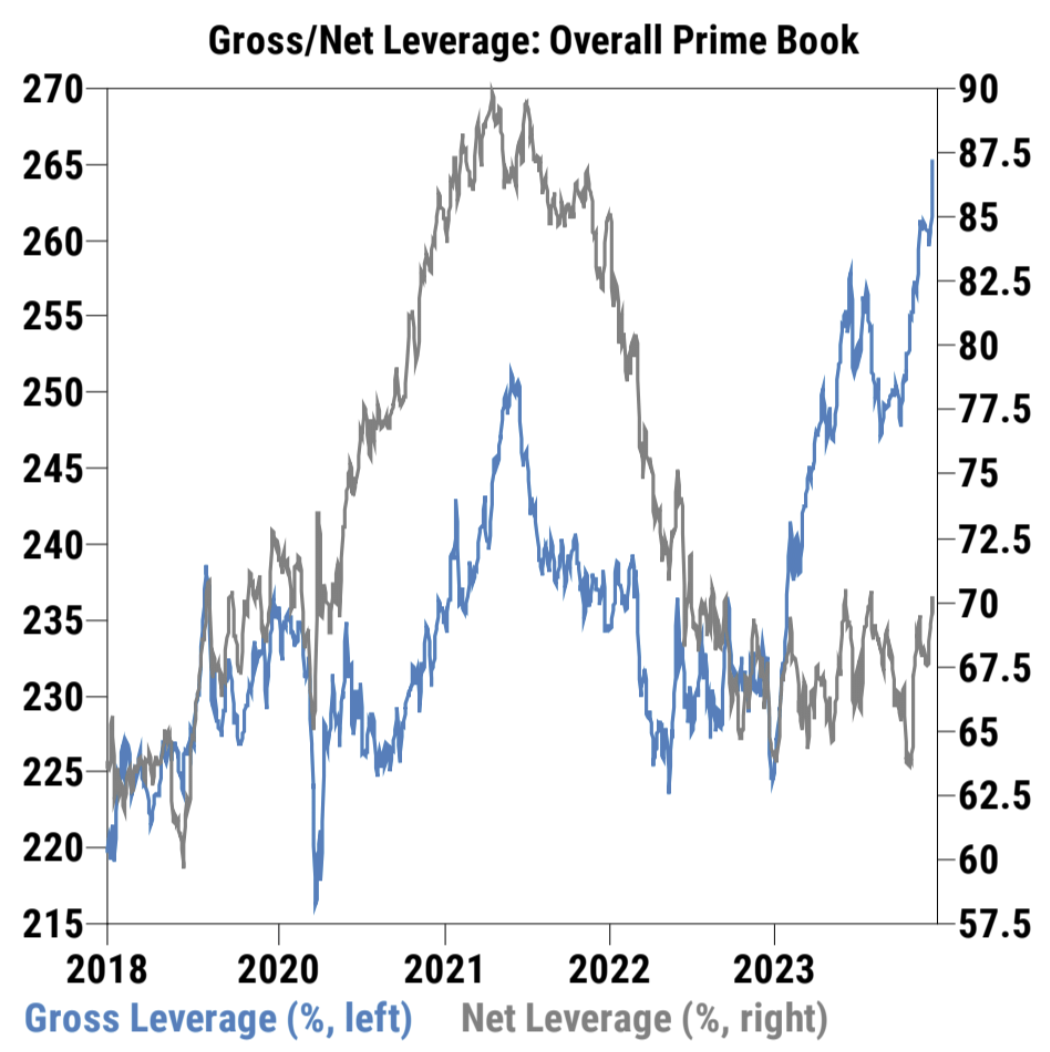
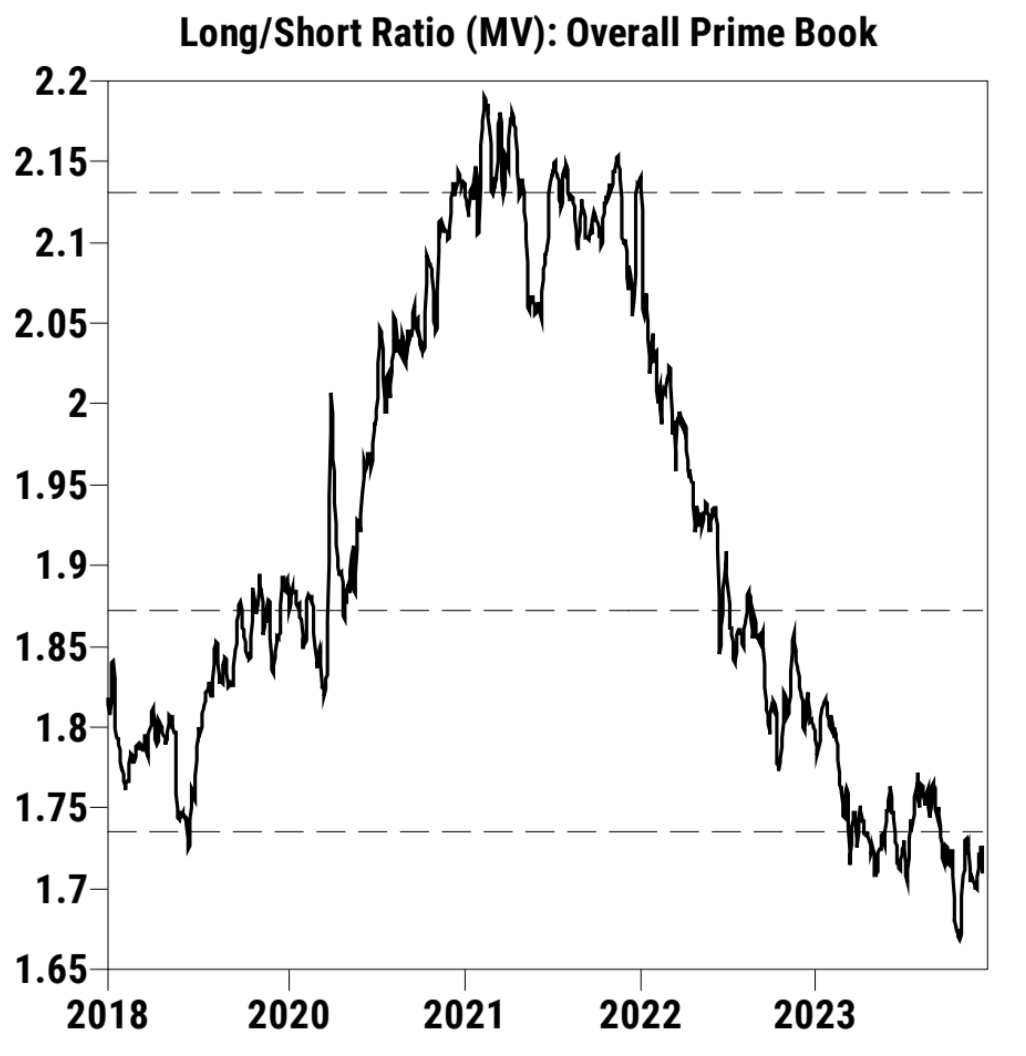
不过总多空比扔徘徊在历史地位:
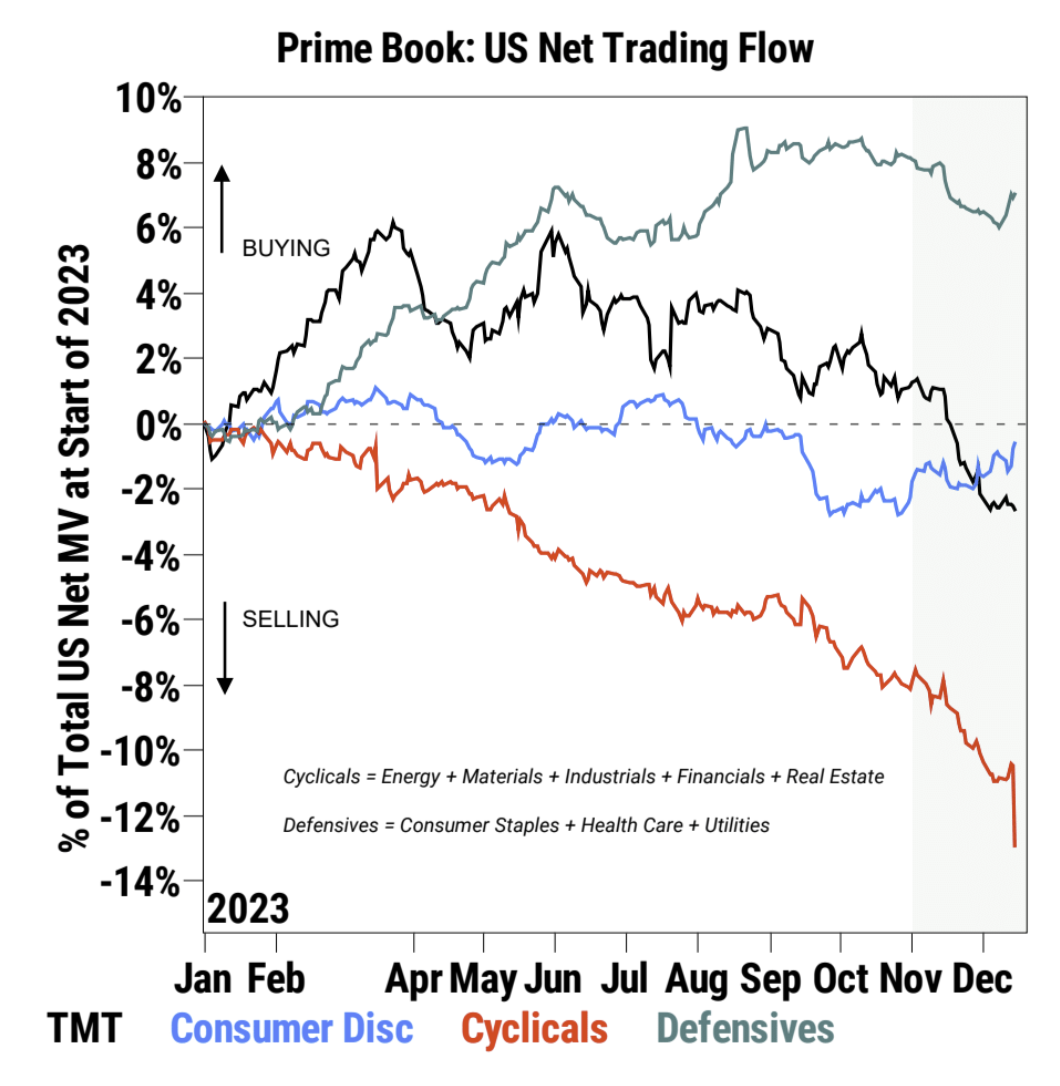
近几周,GS 客户增持防御性股票(必需品、医疗、公用事业)和可选消费,大幅减持周期股(能源、材料、工业、金融、房地产),小幅减持 TMT。GS 客户的操作与最近的市场走势并不完全一致,最近房地产、可选消费、工业、金融板块的反弹势头很强,但 GS 客户选择减持,防御型股票的表现是偏弱的,但 GS 客户选择增持:
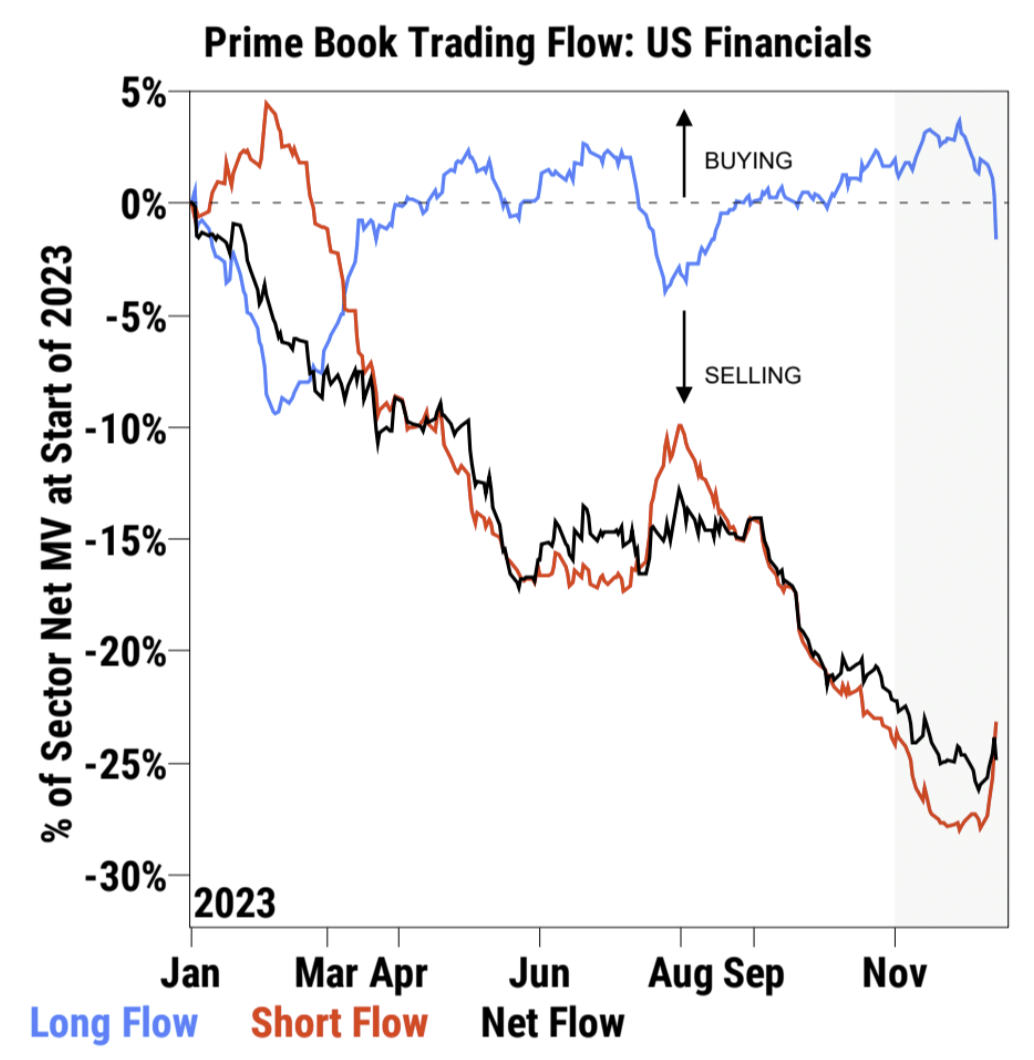
以金融板块为例从 11 月地点反弹了 19% ,但多头在上周开始转为卖出:
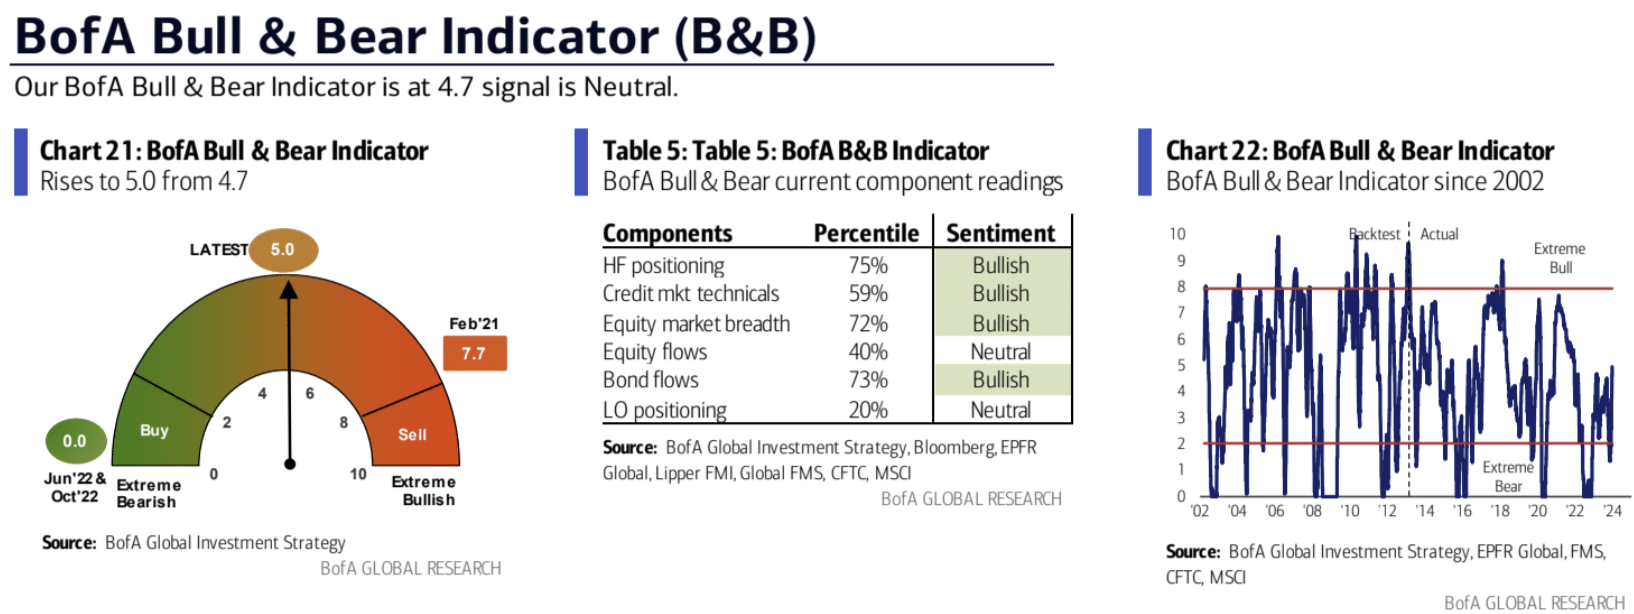
美银牛熊指标继续回升:
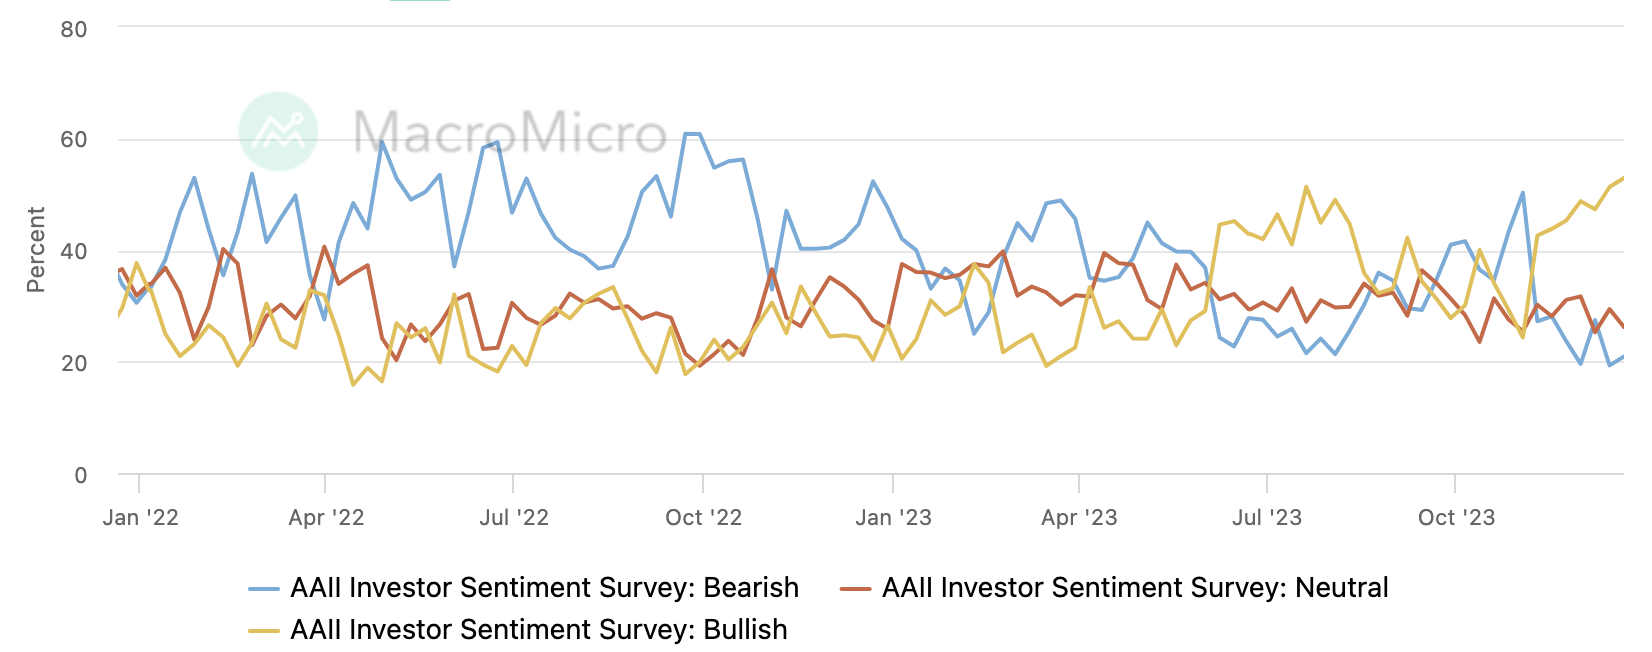
在最新的 AAII 情绪调查中,个人投资者对股票短期前景的乐观情绪升至两年半以来的最高水平。与此同时,悲观情绪略有上升,但仍处于异常低水平。
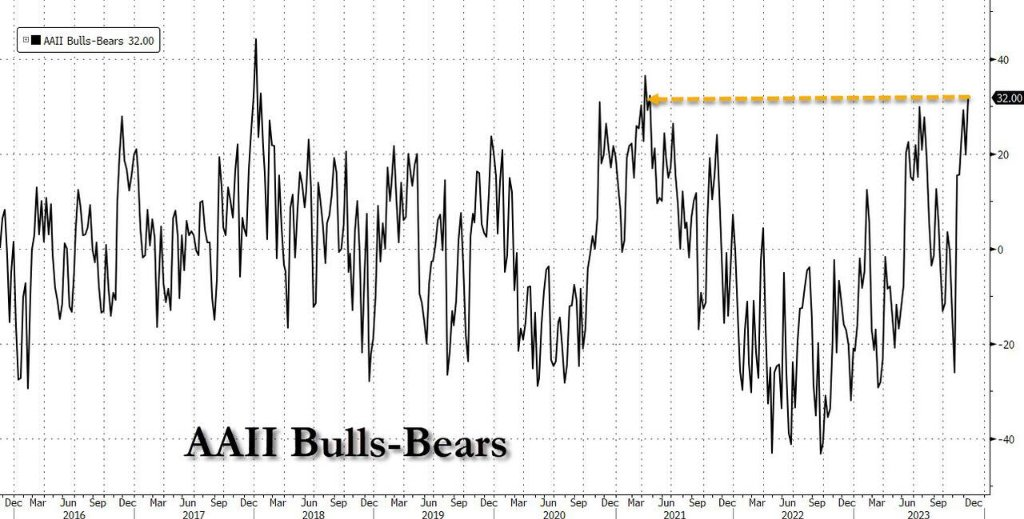
牛熊差值刷新 2021 年 3 月以来新高,报 32 ,历史均值 6.5% ,表明散户乐观情绪已经比较极端:
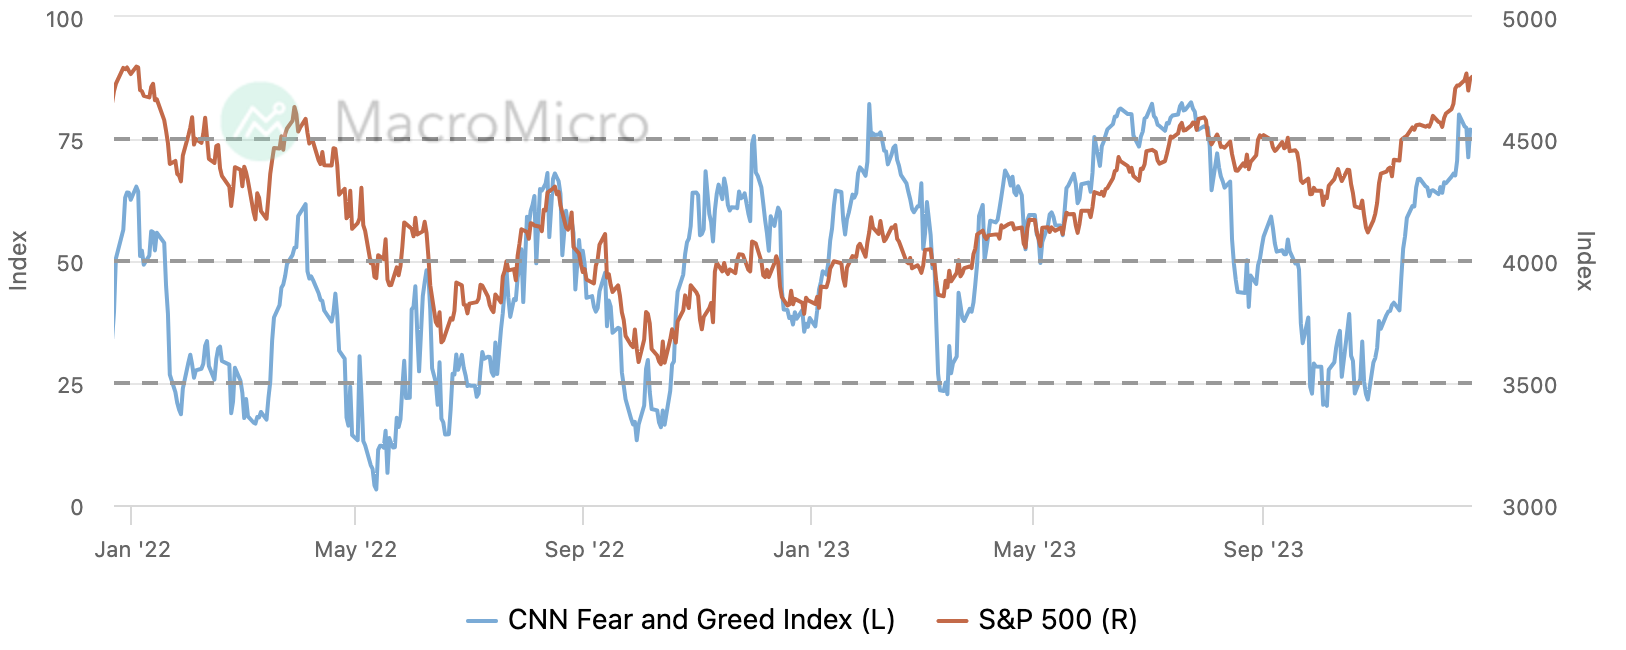
CNN 恐惧贪婪指数连续两周保持在“极度贪婪”水平:
机构观点
DB: 2024 估值修复之年
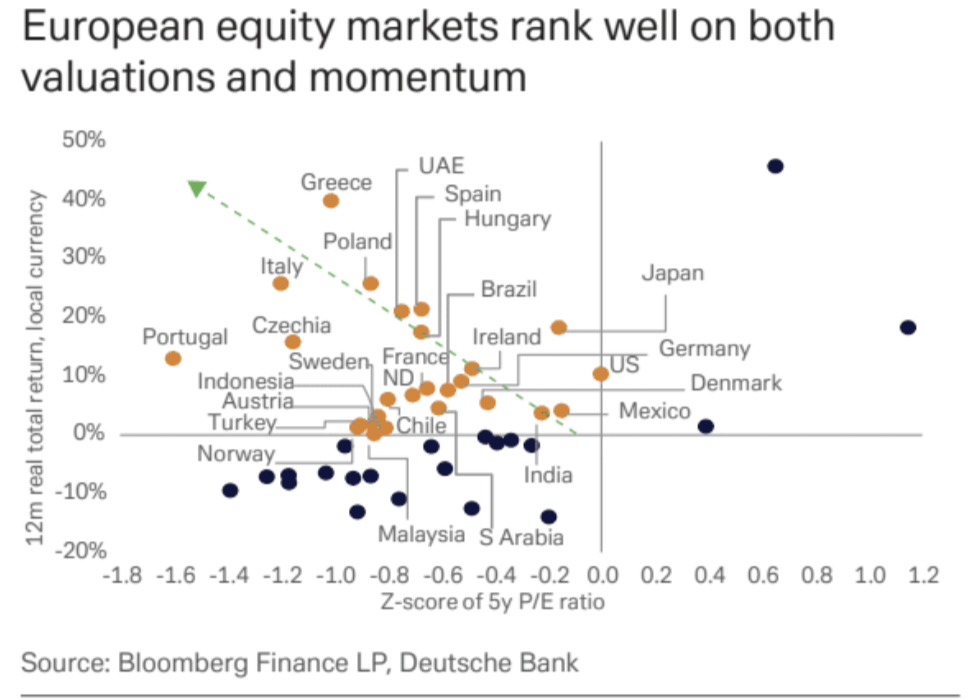
过去五年,在我们分析过程中约占一半市场份额左右的几个欧洲和亚洲国家(粗略计算)的市盈率(P/E)低于过去五年均值 0.75 个标准差。即使在美国和日本,倍数也只是现在才达到其平均水平。如果 2024 年在更确定的宏观经济背景下市场上风险偏好模式持续,很可能会支持便宜的资产。其中许多位于美国以外,它们可以提供多元化收益,并且现在势头也不错:
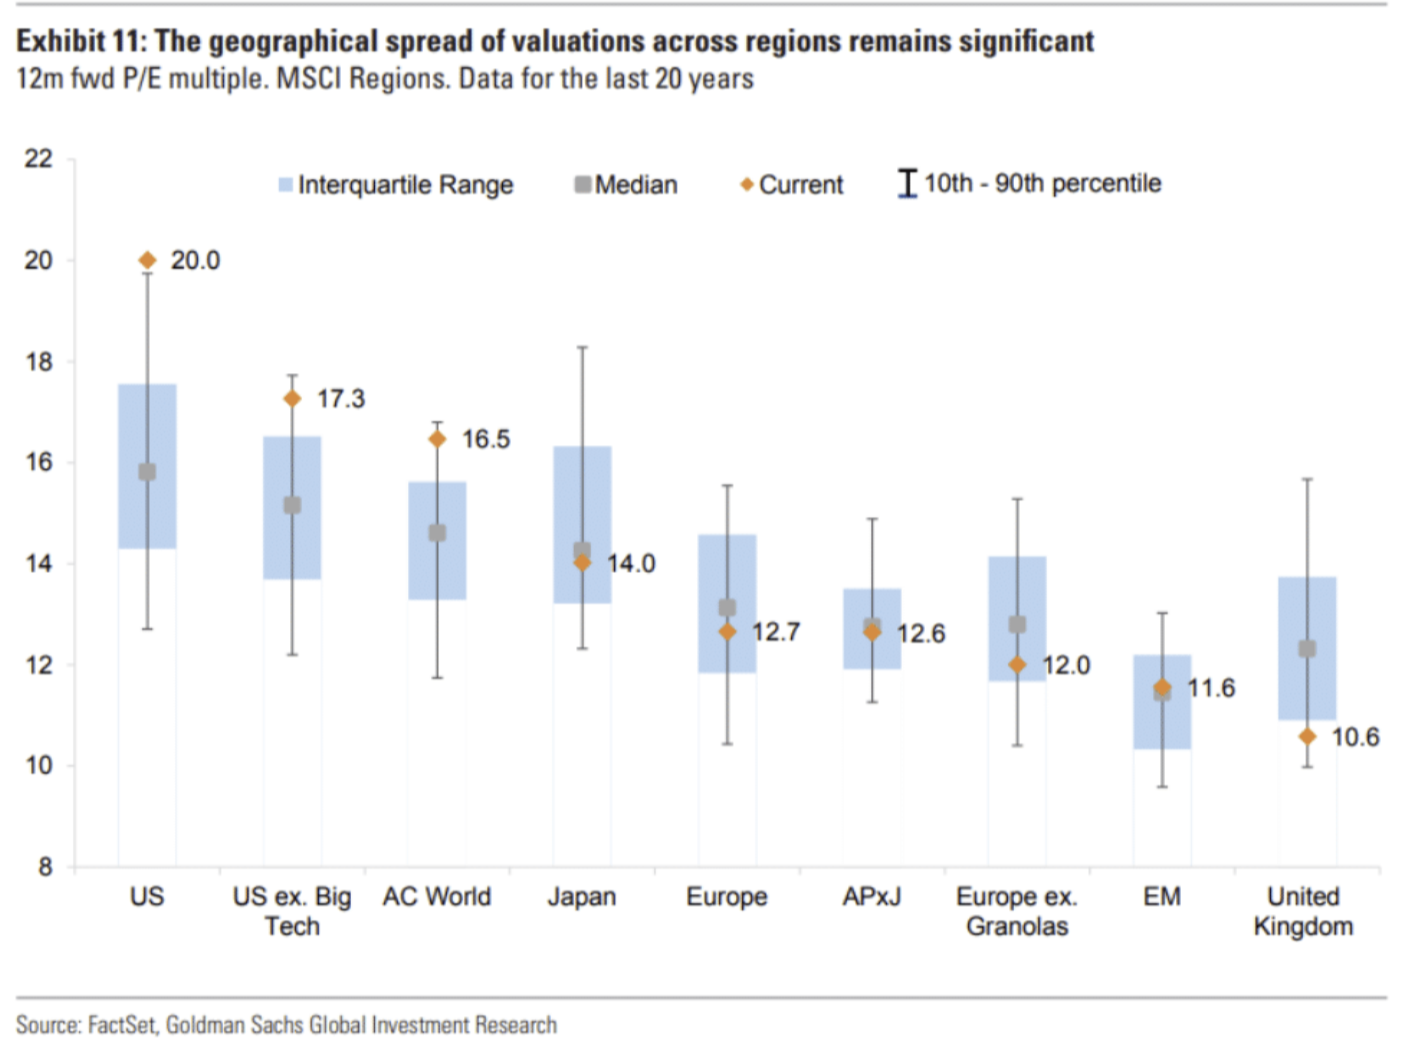
补一张 GS 的估值比较,可以看到除了美股估值都不高。美国作为最昂贵的发达市场, 2023 年初的市盈率为 17 倍,现在已经 20 倍,而历史上在通胀率 1 – 3% 时的中位市盈率为 20 倍,所以市场已经定价了通胀回归正常的情景:
DB: 202 X 迎接下一个泡沫时代
历史上,在经历经济动荡和债券收益率下降后,资产泡沫往往会在一段时期后重新形成。20 世纪 90 年代、 2000 年代和 2020 年代初都是如此。现在收益率有所下降,全球经济正从新冠疫情的影响中复苏,我们有理由相信,在 20 年代的某个时刻,会出现新一轮的资产泡沫。信贷市场系统性风险短期内不大,私募基金现金弹药很多。短期的风险在于,如果美国 2024 年中期遭遇衰退+欧洲经济也已放缓,市场情绪可能再度恶化,届时许多投资者将重新审视风险偏好。(政治风险不止来自美国, 2024 年代表全球 41% 人口和 42% 全球 GDP 的国家的选民将参与领导层换届)
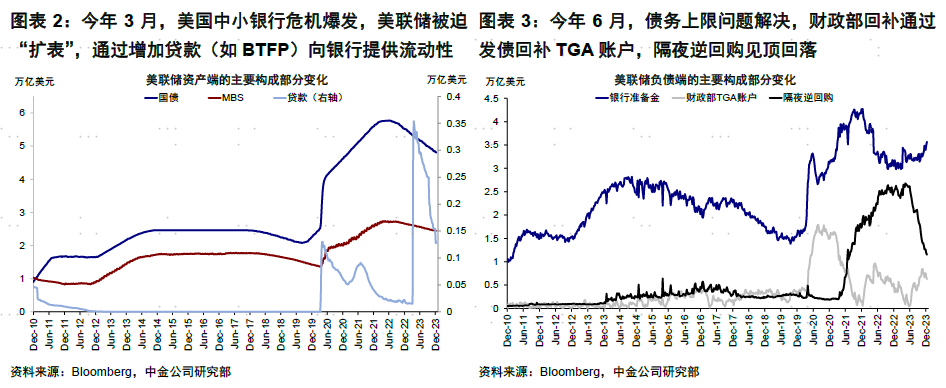
CICC:逆回购还能支撑多久?当前压力不大,美股仍有支撑;明年二季度或再度转向收缩,除非停止缩表
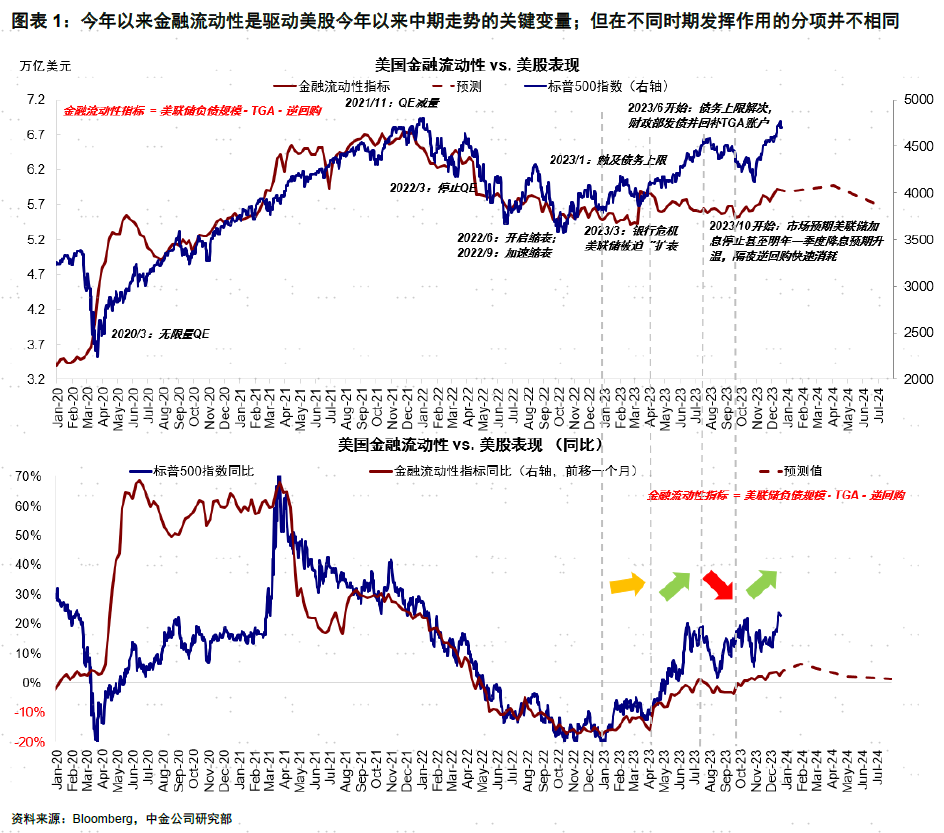
美联储缩表还在继续,TGA 回补已经完成,逆回购自然就成为左右未来流动性变化的关键。当前逆回购还有 1.15 万亿美元,一季度超 4600 亿美元的短债净发行或使其回落 3900 亿美元,仍可对冲同期缩表规模;但二季度短债净发行将明显放缓甚至转负,这或将使得余下逆回购释放速度放缓。如果同期缩表还在继续,那么二季度金融流动性将开始转为收缩。所以美股当前的流动性压力不大,但明年二季度或再面临一定压力,除非美联储停止缩表。
(感觉财政混乱+天量供给这个主题将在 2024 年反复出现,尤其碰上美国总统选举,人们的注意力很容易被牵扯到巨额赤字上,尤其是长端债券收益率下行的空间可能十分有限,如果央行大幅降息,收益率水平本身倒也不会达到今年这般高位,而是表现为风险溢价更高和曲线更陡,也就是倒挂恢复正常。货币市场基金 可能是 RRP 之外一个潜在接盘的资金池,但这需要利率大幅下降否则债券对普通投资人没有更多吸引力)
Cathie Wood: 2024 的主题是通缩交易
通缩将成为 2024 年的关键主题,预计将促使美联储大幅降息。技术进步与这样的经济环境相结合,为那些适应通缩、专注于创新的公司创造了未来几年的大幅扩张的条件。虽然之前对其元宇宙策略持怀疑态度并减持了股份,但由于看好其 CEO 扎克伯格利用开源 AI 的策略,正重新对 Meta 燃起兴趣。她还强调了基因编辑技术的变革性潜力,特别提到了 CRISPR 疗法,由于这个领域还处于早期阶段,加上行业十分“烧钱”的问题,该行业的定价效率低下,存在吸引人的投资机会。
美银基金经理调查
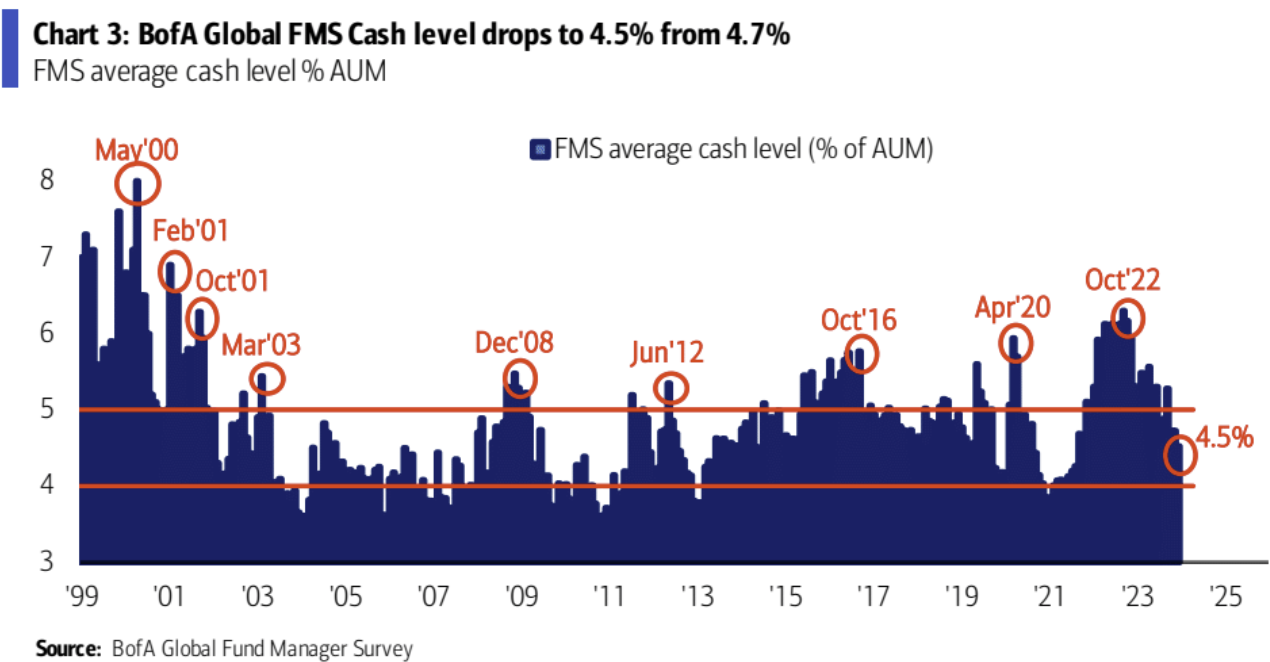
BofA 全球基金经理月度调查显示投资者情绪自 2022 年 1 月以来最为乐观,现金水平降至 4.5% ( 2 年低点)
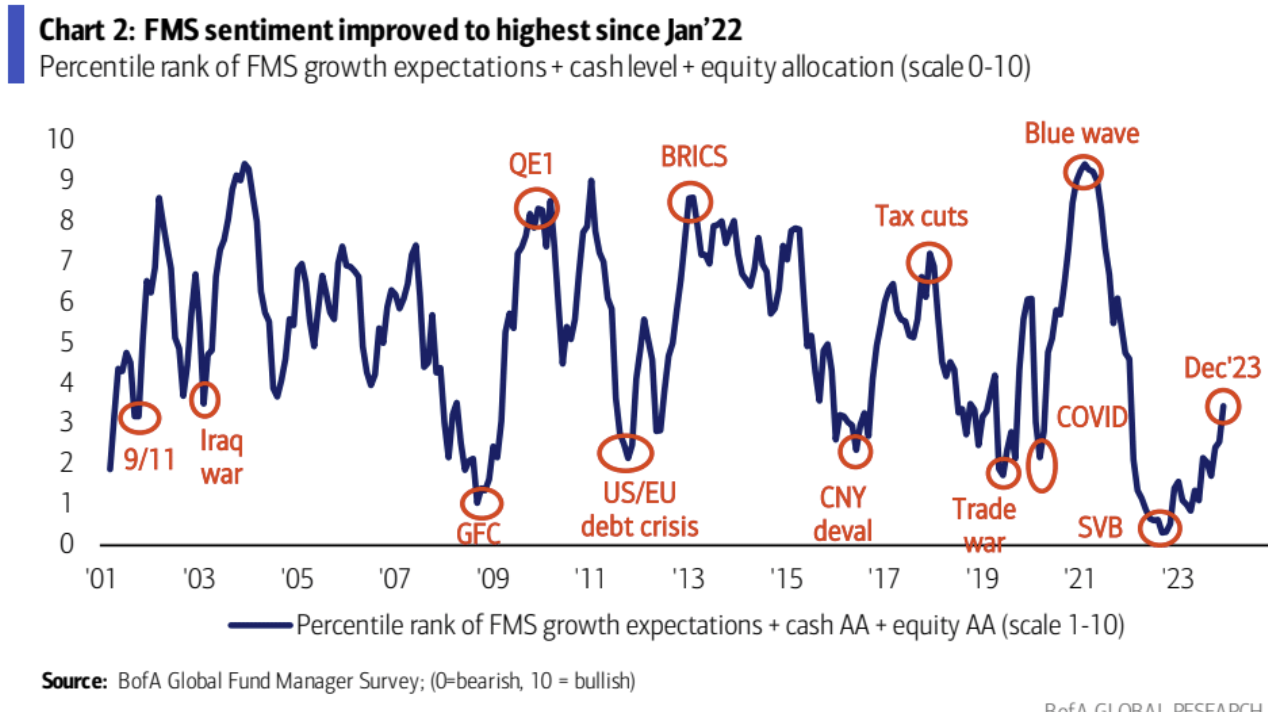
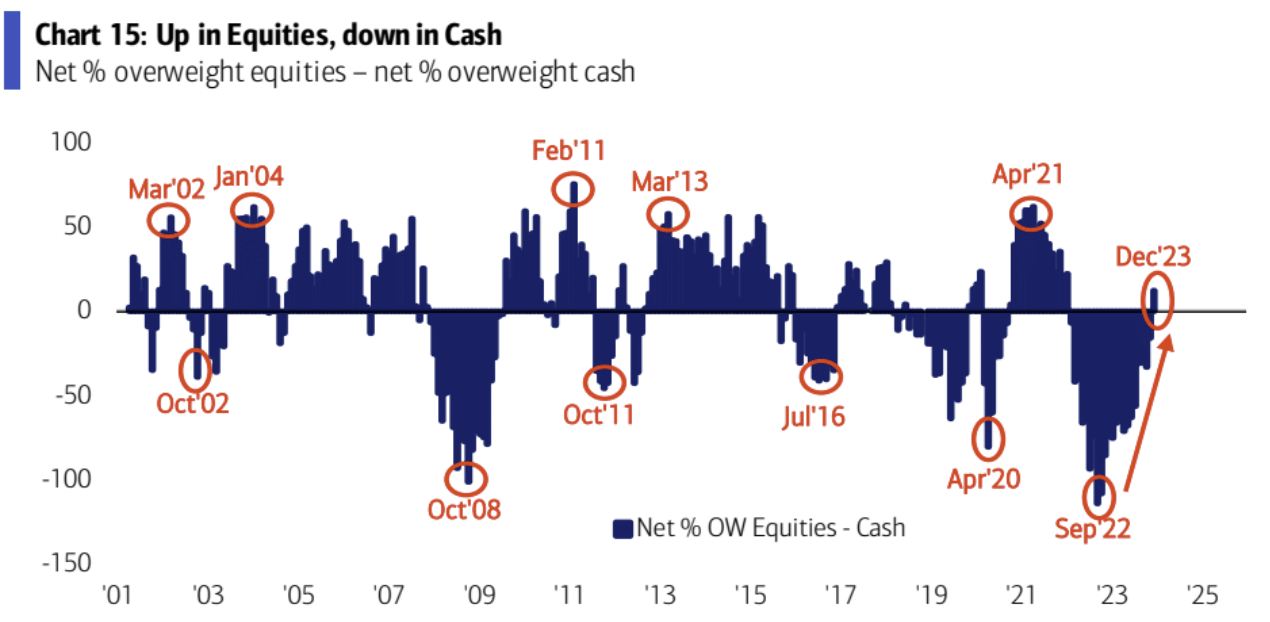
股票配置上升至净 15% OverWeight,单月增 13% ,是自 2022 年 11 月以来的最大单月增幅,股票-现金净配置比例创 2022 年 1 月来最高,现在基金经理们 OW 股票才刚 2 个月时间:
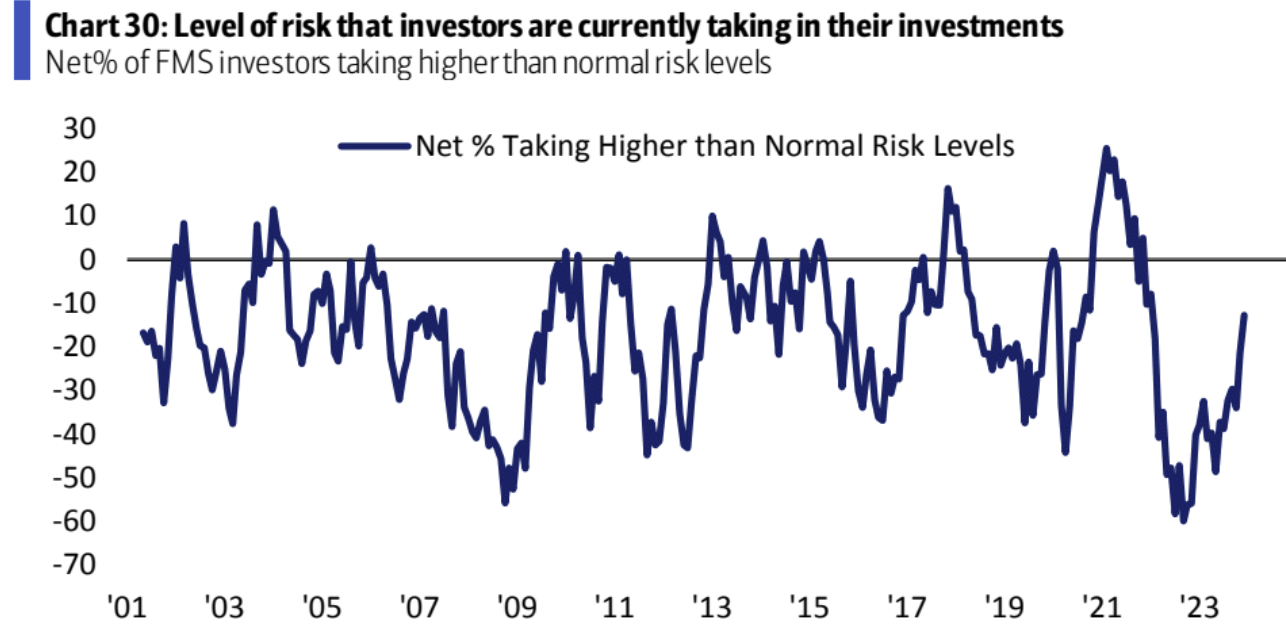
基金经理们对目前承担的风险水平感到舒适,过去两个月风险容忍度提高了 21 个百分点,但没有过热迹象:
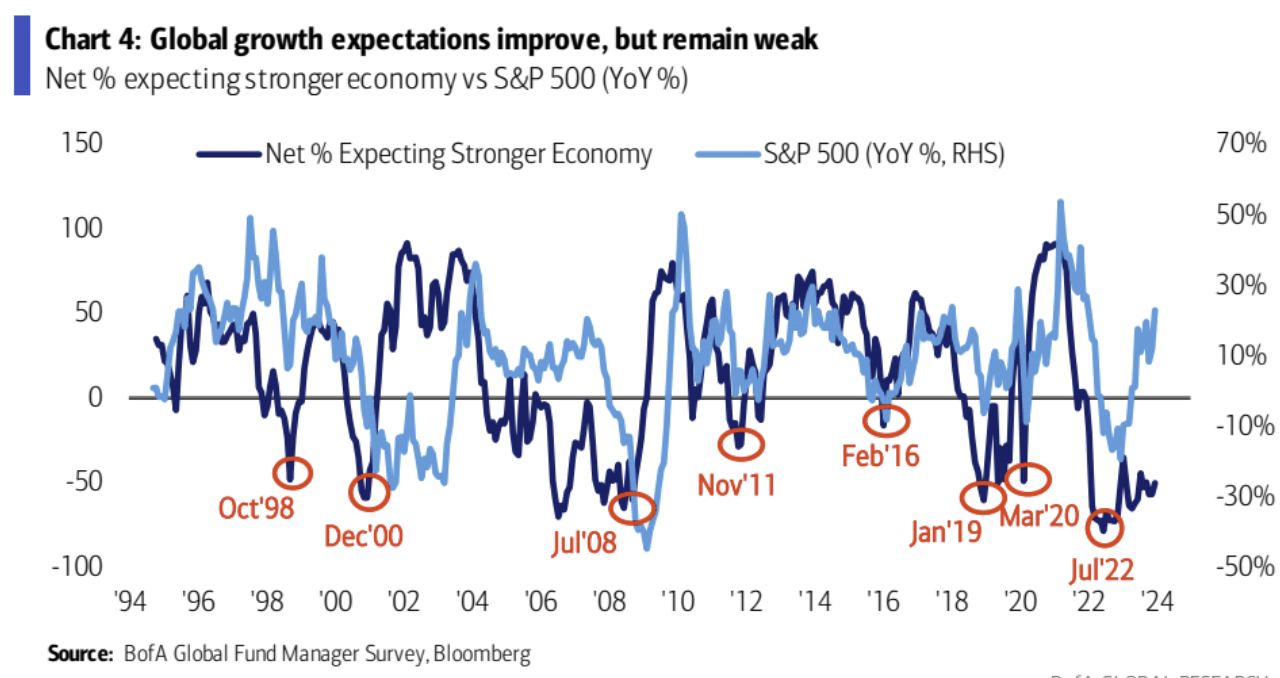
投资者对全球经济增长仍持悲观态度,但有所改善,预计全球经济放缓的可能性下降;
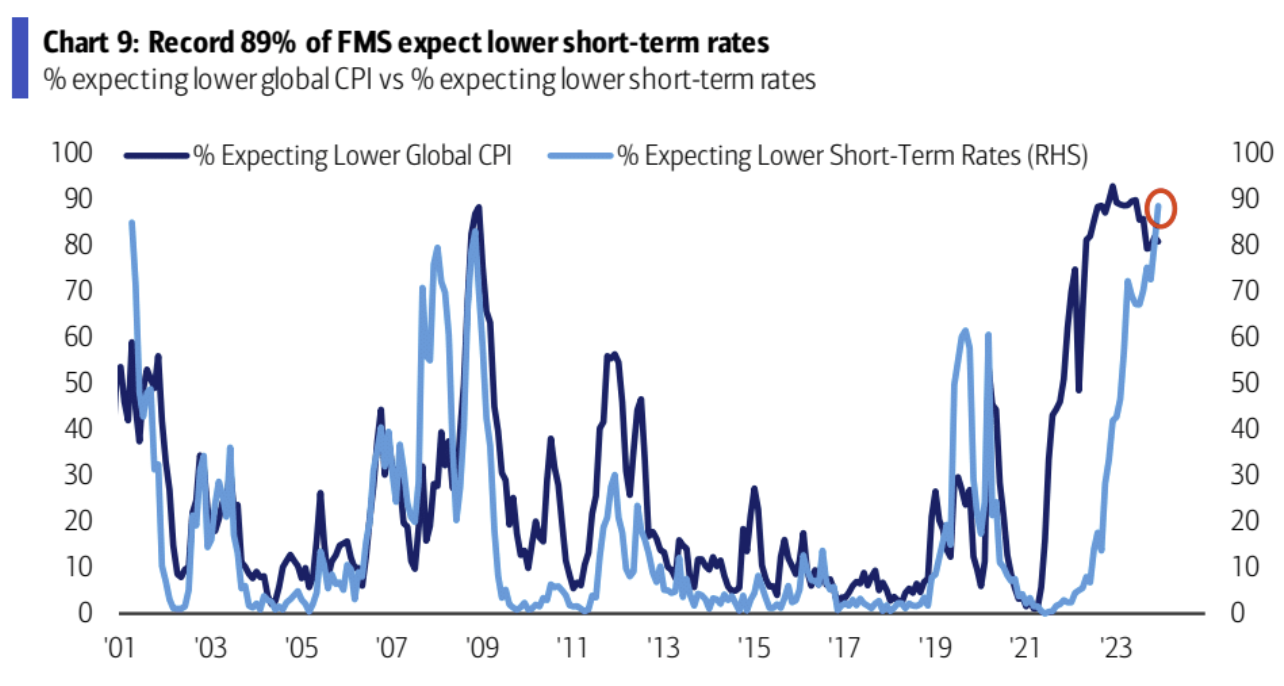
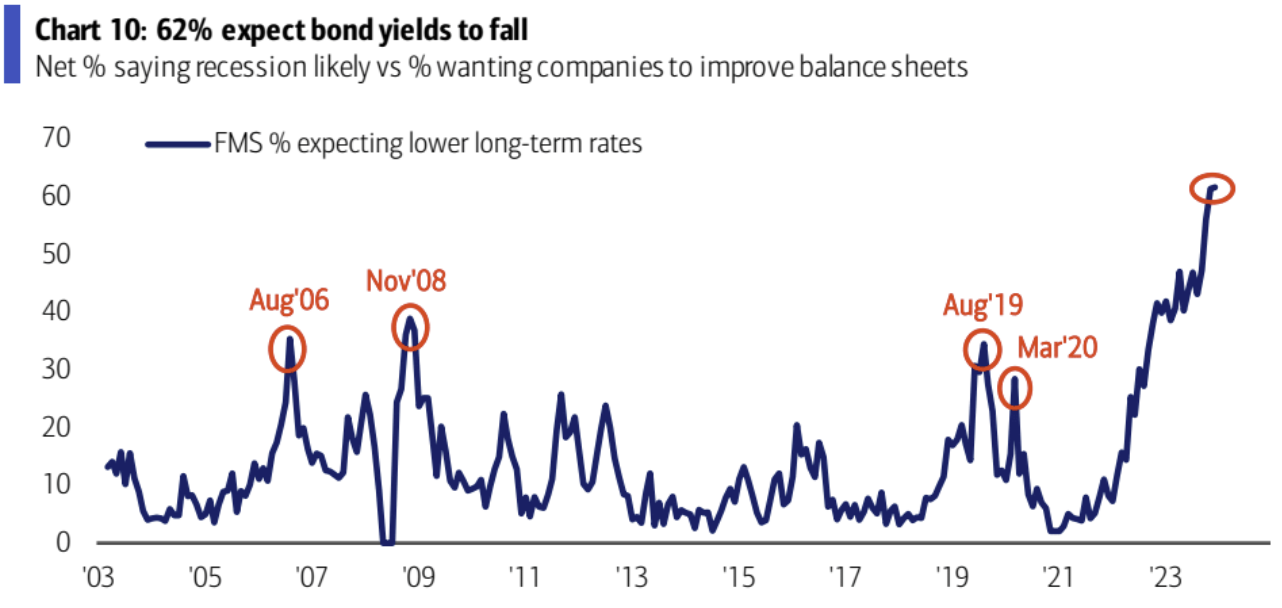
91% 的受访者认为美联储加息周期已经结束;89% 的受访者预计短期利率会下降,这是自 2008 年 11 月以来的最高比例, 62% 的受访者预计债券收益率会下降
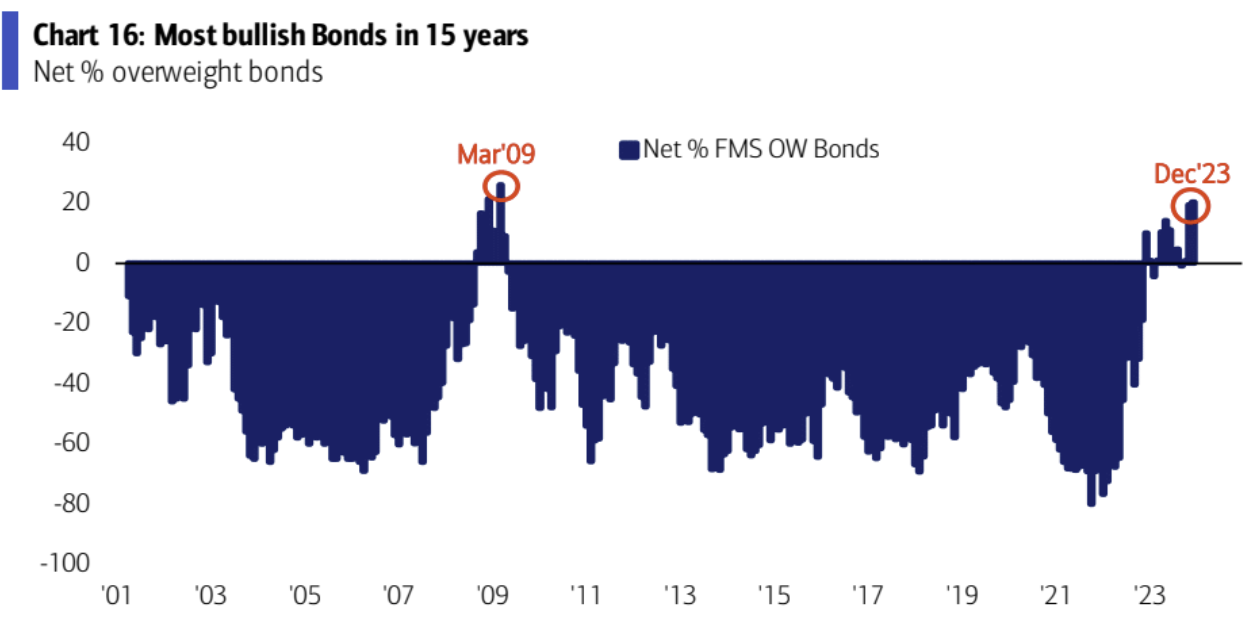
债券目前配置达到 20% 净多仓,创下 15 年来最高:
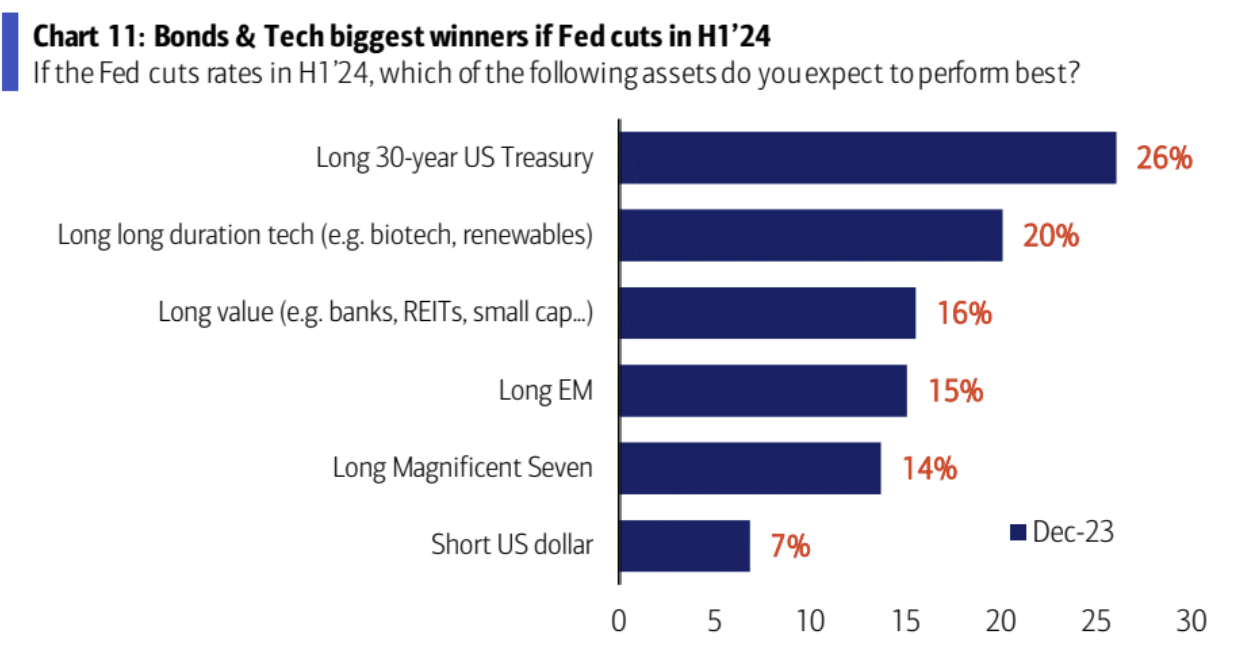
若 Fed 一季度就降息,最看好的交易,首先是长久期国债,其次是长期科技股(例如生物技术,可再生能源),然后是长期价值(例如银行、房地产投资信托基金、小盘股……):
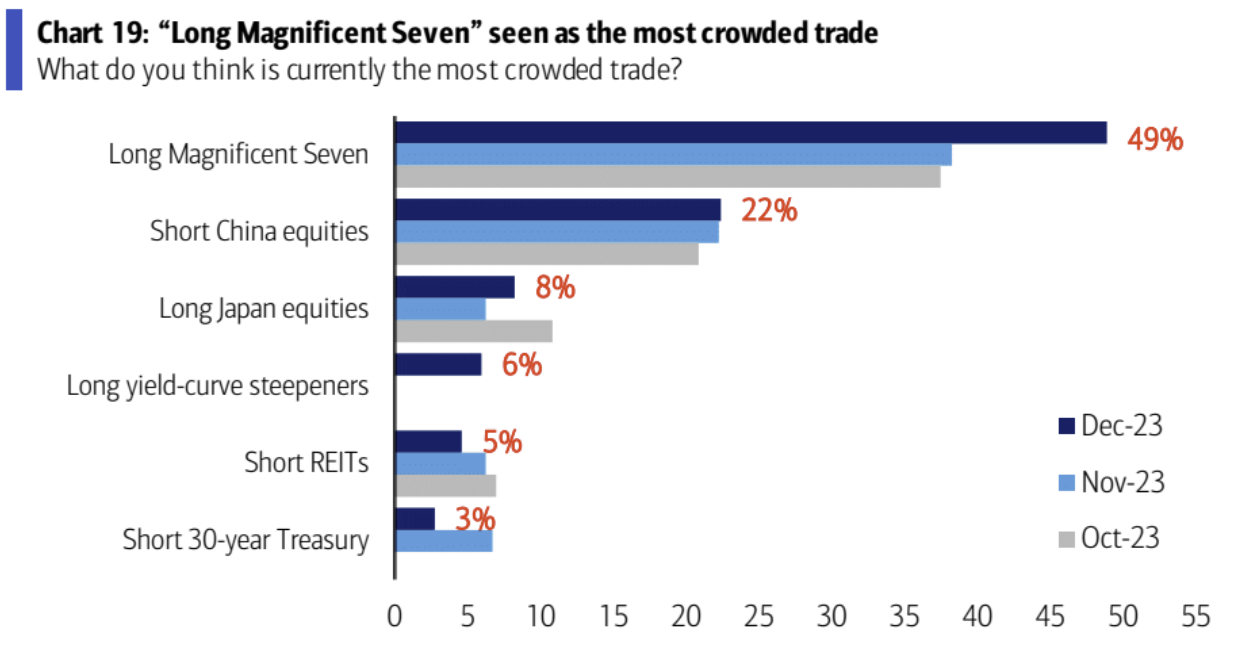
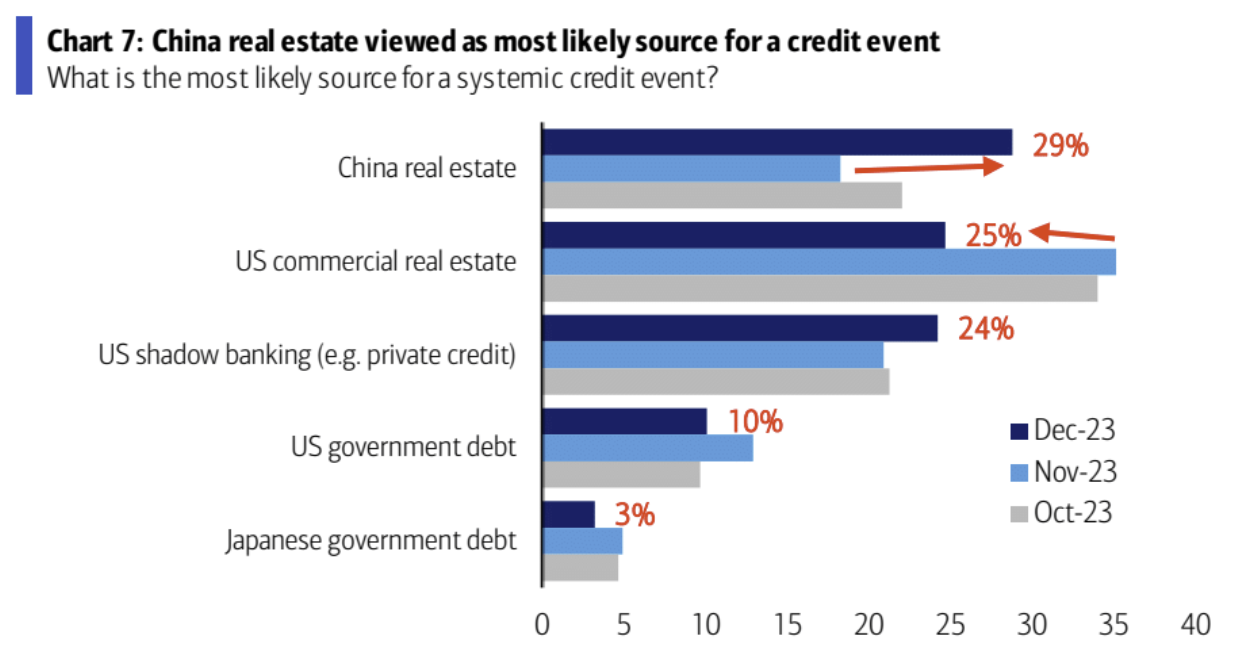
最拥挤的交易头寸是做多“Magnificent 7 ”( 49% )和做空中国股票( 22% );中国房地产被视为最有可能的系统性信用事件( 29% ):