从历史数据看,BTC在春节期间是否会有「红包行情」?
声明:本文仅是历史数据的回溯分析,并不构成任何投资建议。
春节临近,A 股市场已经开启“红包行情”。根据《财联社》的报道,截至 1 月 16 日,今年两市已有近 180 只个股累计涨幅超 20% ,本周上证指数更是跳空高开后轻松突破 3200 点整数关口,创近期新高。而在加密市场,各类资产同样纷纷打开“上涨模式”,市场总市值已回升至 9688.10 亿美元,扭转了过去 3 个月以来的横盘趋势。其中,根据 CoinMarketCap 的数据,截至 1 月 19 日,BTC最近 7 天的涨幅达到了 14.01% ,目前,已连续 5 天站稳 20000 美元整数关口。
Wind 数据显示,最近 20 年,A 股在春节前后 5 个交易日的上涨概率均有 80% ,“红包行情”大概率会贯穿整个春节。那么,加密市场是否同样存在类似的“红包行情”?“红包行情”会持续多久?BTC 在春节期间的赚钱效应如何?
为此,PANews 数据新闻栏目 PAData 回顾了 BTC 最近 5 年春节期间的市场数据,同时还回顾了近期热门代币最近 3 年春节期间的市场数据,统计发现:
1 )最近 5 年,BTC 在春节期间年年都有“红包行情”,涨幅最小也有 5% 左右,最大则超过 16% 。以此推测,今年 BTC 在春节期间出现“红包行情”的概率也非常大。
2 )除夕当天买入 BTC,此后任意一天卖出的平均收益率最高,达到 9.4% 。另外,如果在初四前买入,此后任意一天卖出的平均收益率也都能超过 6.7% ,但如果在初五以后买入,那么此后任意一天卖出的平均收益率就会大幅下跌至 2% 以下,且亏损的概率会大幅提高。
3 )“红包行情”下,BTC 的日均最大振幅与平时相当,并没有表现是更小的振幅和更高的涨幅。其中,初四、年初十一和年初十二的日均最大振幅都超过了 7% ,单日波动较大。
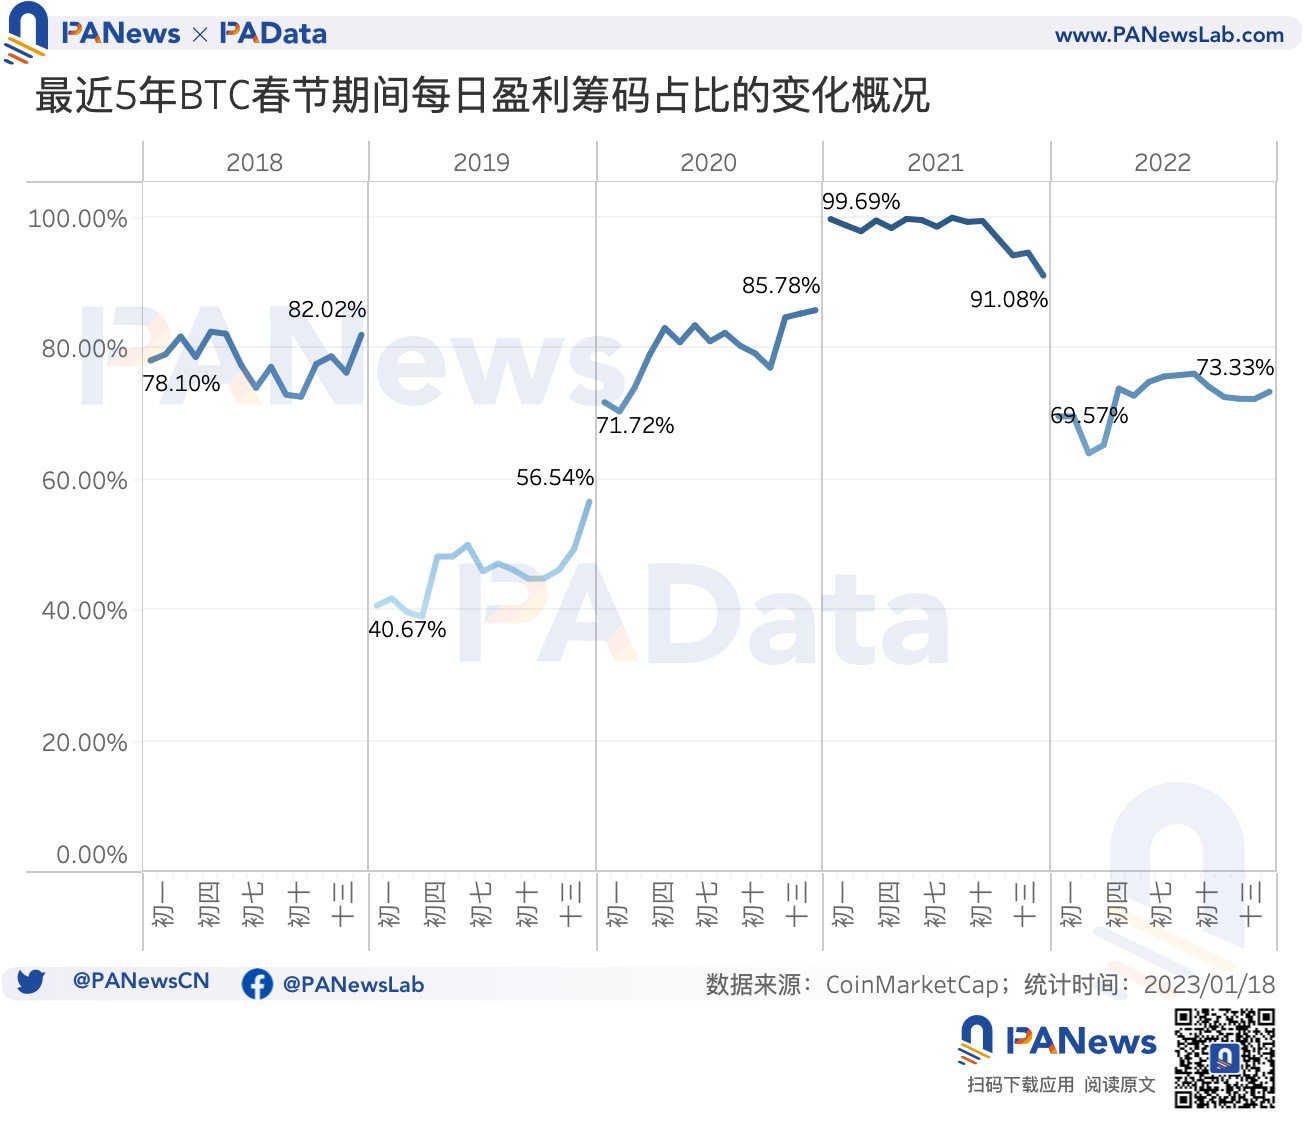
4 ) 2019 年和 2020 年春节期间,BTC 盈利筹码占比的涨幅则都增加了 15 个百分点左右。在初二到初四期间,盈利筹码占比的增长都比较明显。
5 )最近 3 年, 10 种样本热门资产如果在除夕以开盘价买入,在初六以收盘价卖出的话,平均收益率约为 16.79% 。如果在除夕以开盘价买入,在年初十四以收盘价卖出的话,平均收益率约为 20.01% 。但热门资产波动性大,部分资产在春节期间持币仍有亏损。
BTC 除夕买入后不同周期的平均收益超 9% ,春节期间仍要警惕单日高波动
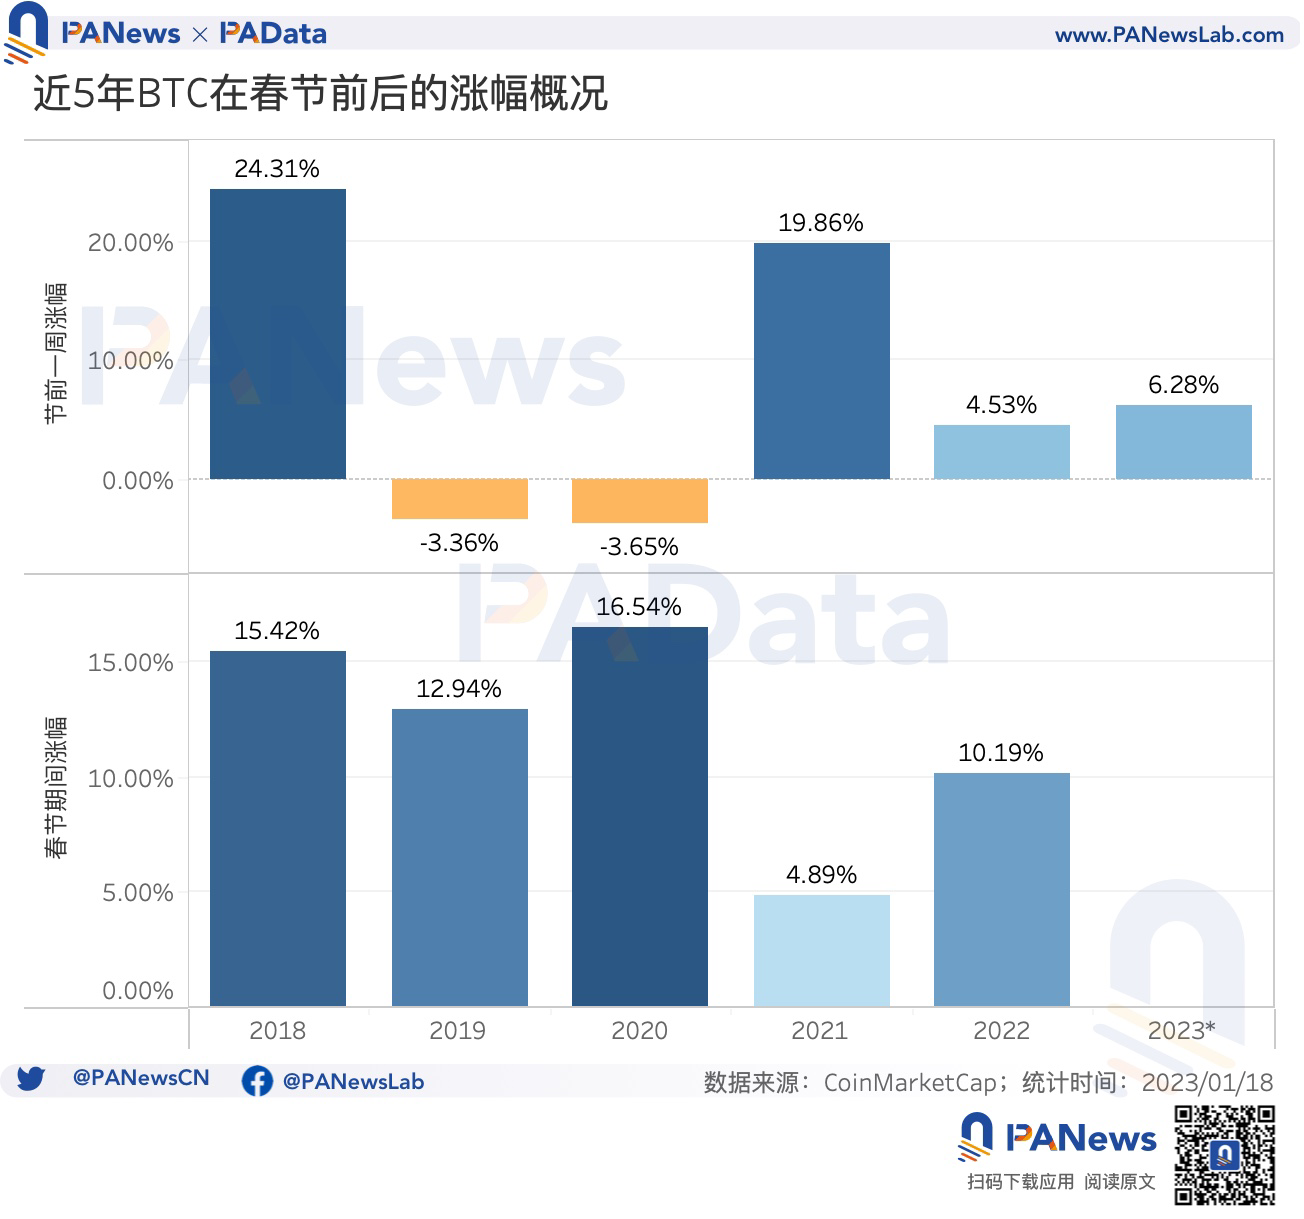
最近 5 年,BTC 在除夕前 7 天内(不含除夕当日)涨跌不一。其中,BTC 在 2018 年、 2021 年和 2022 年除夕前 7 天内币价上涨,而在 2019 年和 2020 年同期则下跌。如果从上涨趋势出现的次数来看,最近 5 年,BTC 春节前出现“红包行情”的概率为 60% ,而且节前“红包行情”的力度有下降趋势。今年,BTC 在春节前已经开始上涨,截至 1 月 17 日的除夕前 4 天内,涨幅约为 6.28% ,略高于去年。
但是,最近 5 年,BTC 在春节期间(除夕至年初十四)则年年上涨,“红包行情”的涨幅最小也有 5% 左右。其中,BTC 在 2018 年、 2019 年、 2020 年和 2022 年春节期间的涨幅都超过了 10% ,最高涨幅超过 16.5% 。从上涨趋势出现的次数来看,最近 5 年,BTC 春节期间出现“红包行情”的概率为 100% ,这意味着,以此推测,今年 BTC 在春节期间出现“红包行情”的概率也非常大。
假如在春节期间买入 BTC,那么投资者能在趋势行情下获得多大的“红包”呢?PAData 统计了自除夕开始,一直到年初十四,共历时 15 天的春节假期期间,BTC 不同持币周期的收益情况。下图纵向时间表示买入日期,买入价格为当天开盘价,横向时间表示卖出日期,卖出价格为当天收盘价,数值为最近 5 年同一交易周期的平均理论收益。
首先,如果以买入时间为观察标准(横向来看),那么,除夕当天买入 BTC,此后任意一天卖出的平均收益率最高,达到 9.4% 。另外,如果在初四前买入,此后任意一天卖出的平均收益率也都比较高,都能超过 6.7% 。不过,如果在初五以后买入,那么此后任意一天卖出的平均收益率就会大幅下跌,最高不超过 2% ,且如果在初七、初九、初十、年初十一买入的话,此后任意一天卖出的平均收益率均为负,也即有很大概率会亏损。
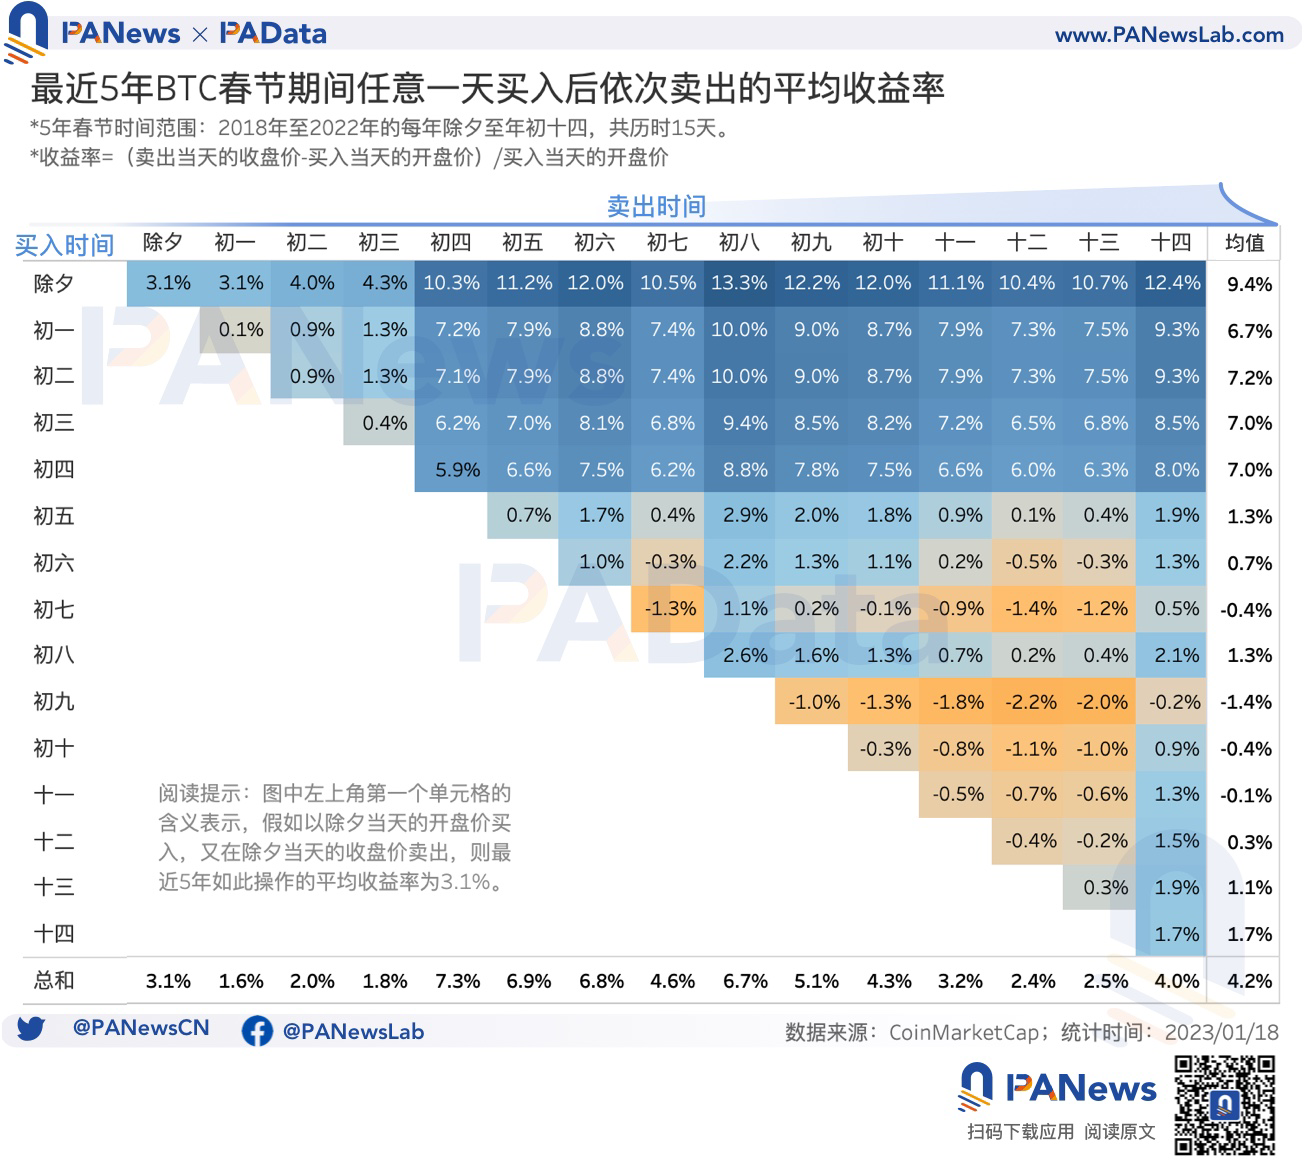
其次,如果以卖出时间为观察标准(纵向来看),那么无论此前哪天买入,在初四当天卖出的平均收益率最高,约为 7.3% 。另外,无论此前哪天买入,在初五、初六和初八当天卖出的平均收益率也比较高,能达到 6.8% 左右。
最后,如果不以某一买卖日期为观察标准,即将所有时间周期放在一起比较,那么,最近 5 年平均收益最高的交易模式是,在除夕当天以开盘价买入,在初八当天以收盘价卖出,如此交易的平均收益率约为 13.3% 。另外,在“除夕——初四”“除夕——初五”“除夕——初六”“除夕——初七”“除夕——初九”“除夕——初十”“除夕——十一”“除夕——十二”“除夕——十三”“除夕——十四”“初一——初八”“初二——初八”这 12 个交易模式近 5 年的平均收益率也都超过了 10% 。但值得注意的是,如果在初六以后买入,那么 45 种交易模式中有 23 种近 5 年的平均收益率都为负,也即亏损的概率达到 51% 。
不过,在春节期间的“红包行情”下,投资者仍要警惕单日高波动造成的风险。根据统计,最近 5 年春节期间(除夕至年初十四)的日均最大振幅差异较大, 2018 年和 2021 年都达到了 8.1% 左右,而 2019 年、 2020 年和 2022 年则都不到 4.5% 。
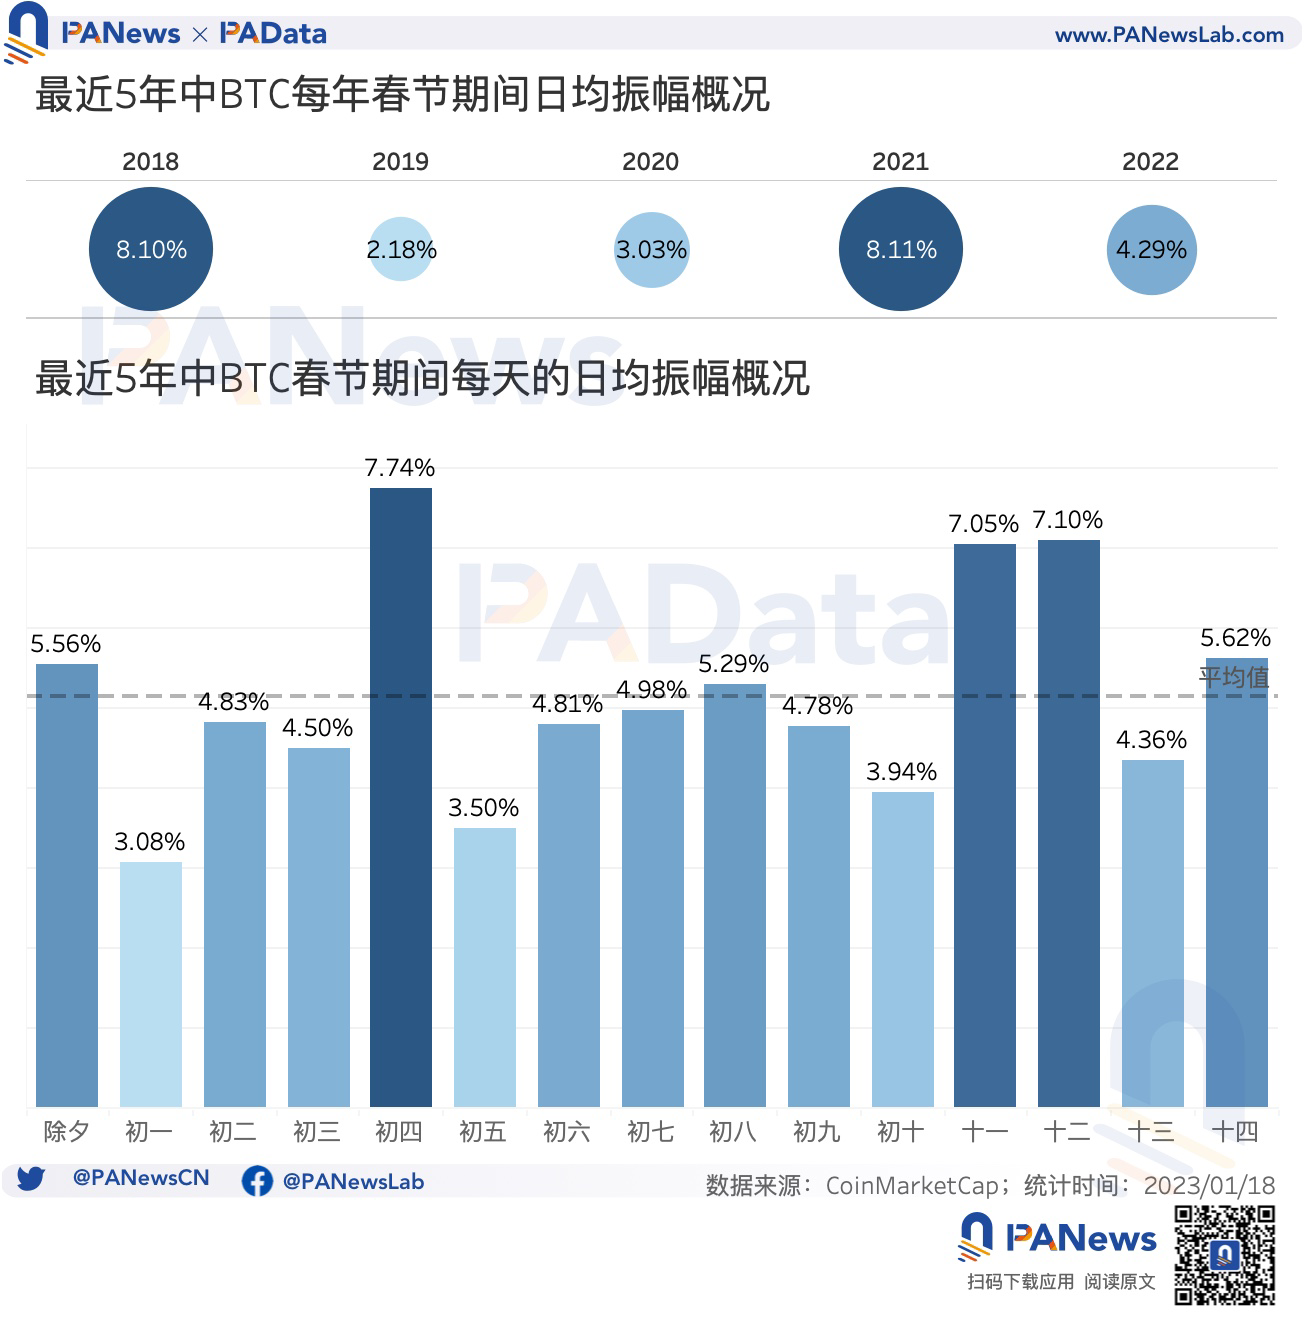
从单日的近 5 年日均最大振幅来看,春节期间的均值为 5.14% 。这一水平与 PAData 过往多次观察到的 BTC 季度日均最大振幅接近,即“红包行情”下,BTC 的一段时间内的日均振幅与平时相当,并没有表现是更小的振幅和更高的涨幅。其中,初四、年初十一和年初十二近 5 年的日均最大振幅都超过了 7% ,属于单日波动较大的时间。而初一、初五和初十近 5 年的日均最大振幅都在 5% 以下,属于单日波动较小的时间。
在“红包行情”中,处于盈利状态的筹码在增加吗?这在一定程度上能表现盈利地址的相应变化。可以看到,在 2018 年、 2019 年、 2020 年和 2022 年这 4 年中,春节期间的盈利筹码占比处于总体增长趋势,但是, 2018 年和 2022 年涨幅都不太明显,都只增加了约 4 个百分点,而 2019 年和 2020 年的涨幅则都很明显,都增加了 15 个百分点左右。综合来看,在初二到初四期间,盈利筹码占比的增长都比较明显,此后有所波动。
近期热门代币最近 3 年春节期间平均收益达 20% ,但日均振幅超过 BTC 的 2 倍
BTC 作为加密市场中市值占比最大的资产,其上涨通常代表着大盘上涨,即其他代币也很有可能出现上涨。因此,除了回溯 BTC 过去 5 年的“红包行情”以外,PAData 还回溯了近期热门资产过去 3 年的春节行情。
热门资产指最近 7 天涨幅最高的 30 种资产和搜索量最高的 30 种资产,去重后共录得 52 种。包括 WKC、AGIX、MANA、FXS、HNT、FTT、CVX、SAND、FET、APT、COMP、CRV、SOL、AAVE、AVAX、SHIB、OP、CSPR、FTM、NEAR、FLOW、ENJ、ICP、GALA、PI、KAVA、SNX、JASMY、IMX、FIL、XRPC、HOT、HEX、LRC、HBAR、CELO、XTZ、BTC、DOT、CRO、ETH、QUACK、BONK、QNT、MATIC、XOLO、DOGE、ADA、BNB、DPR、LUNC、XRP。这些资产最近 7 天内的币价涨幅在 7% -200% 之间,平均涨幅约 34% 。
PAData 进一步在涨幅最高和搜索量最高的资产中选择了各自排名前 5 的资产(如果市值过小则省略后递推选择后续排名的资产)作为观察样本,以期透过样本为展望其他热门资产提供一定的基础。
根据统计,最近 3 年, 10 种样本热门资产如果在除夕以开盘价买入,在初六以收盘价卖出的话,平均收益率约为 16.79% 。其中, 2020 年样本资产在此种交易模式下的平均收益率为 9% , 2021 年为 15% , 2022 年为 21% ,呈逐年增长趋势。
最近 3 年, 10 种样本热门资产如果在除夕以开盘价买入,在年初十四以收盘价卖出的话,平均收益率约为 20.01% 。其中, 2020 年样本资产在此种交易模式下的平均收益达 37% , 2021 年约 19% , 2022 年为 16% ,呈逐渐下降趋势。
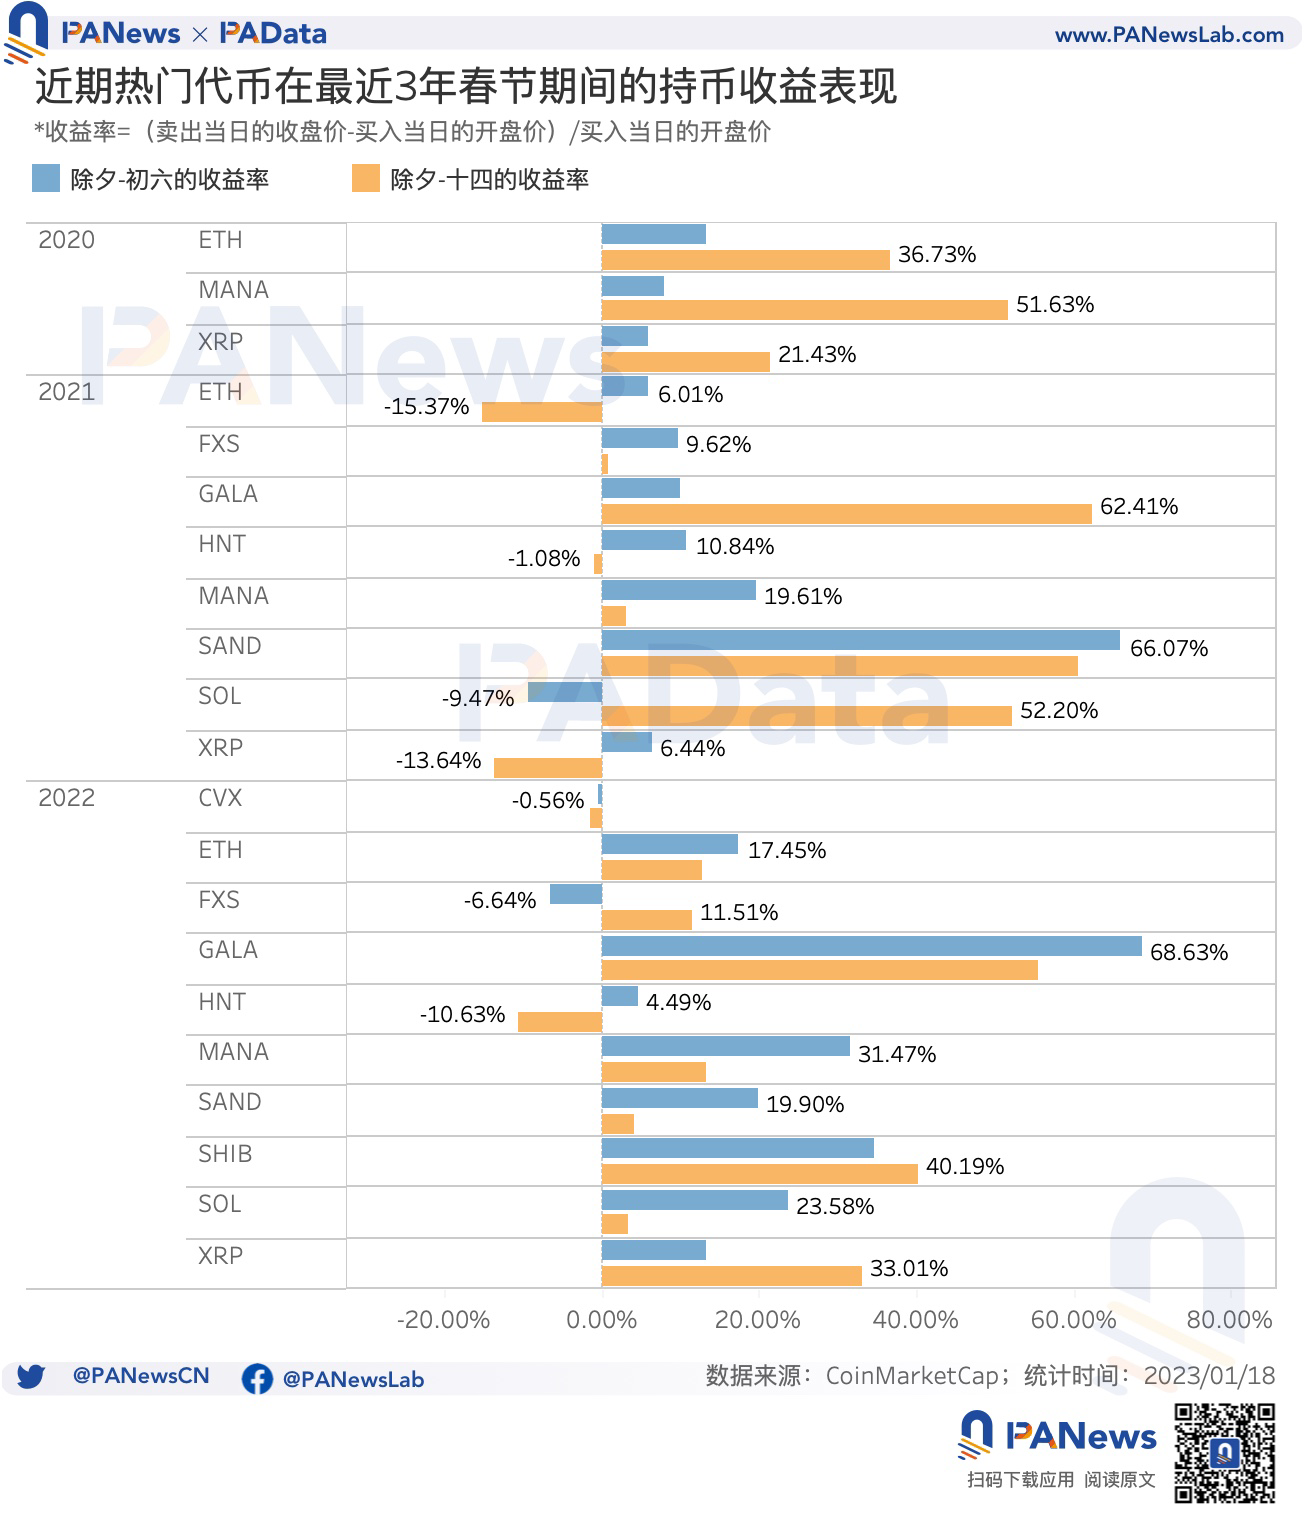
总的来看,最近 3 年春节期间,MANA、GALA、SAND、SHIB 这 4 种资产在“除夕——初六”“除夕——年初十四” 2 种交易模式下的收益都是正的,而 ETH、HNT、SOL、XRP、CVX、FXS 这 6 种资产在 2 种交易模式中存在 1 种收益为负的情况。热门资产“红包行情”的稳定性不高,这或受到热门资产的波动较大的影响。
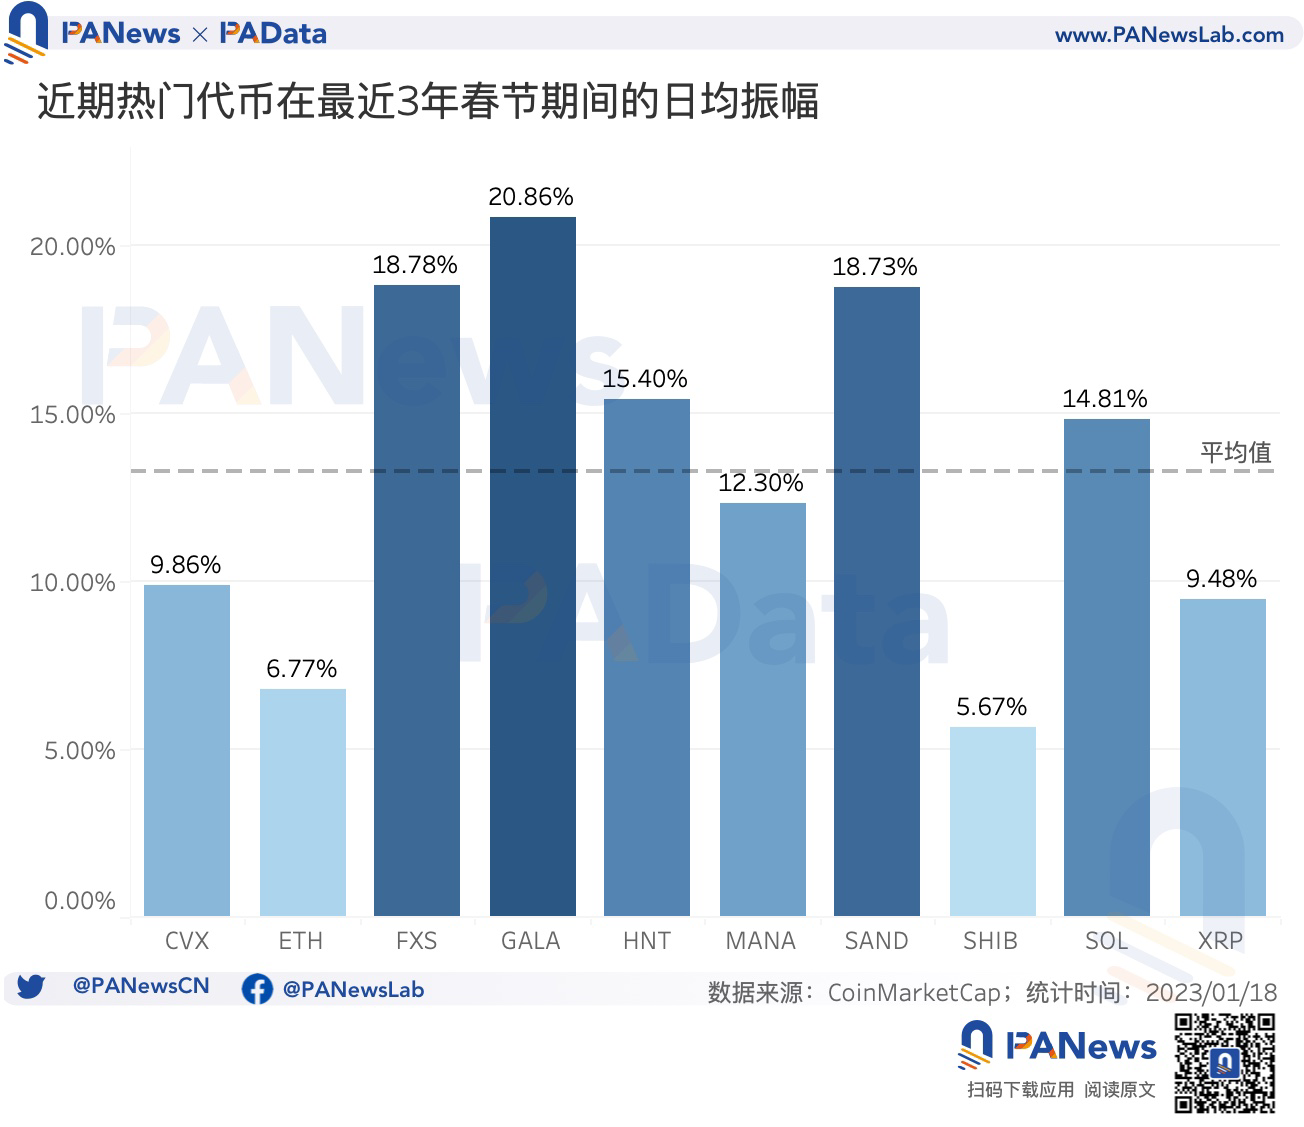
根据统计, 10 种样本热门资产最近 3 年春节期间的日均最大振幅约为 13.27% ,大约是 BTC 的 2.5 倍左右。其中,FXS、GALA 和 SAND 最近 3 年春节期间的日均最大振幅都超过了 18% ,显著高于其他资产。可见,热门资产的波动性显著高于 BTC,其“红包行情”下的投资风险也可能高于 BTC。