Bitcoin's shallowest bear market: Market-wide silence, spot volume hits a new low since 2019


- Core Thesis: The current crypto market is in a state of "tactical pause" under macro pressure. Treasury yields surpassing crypto carry trade returns have led to the exit of marginal buyers, presenting a bear market characterized by the shallowest depth and insufficient duration, awaiting a macro policy shift and key price level breakthroughs.
- Key Elements:
- The 2-year US Treasury yield is higher than the federal funds rate, with the market pricing in rate hikes. The appeal of traditional assets now exceeds crypto carry trades, as capital is being "paid to stay" in cash.
- Bitcoin spot trading volume has fallen to its lowest since 2019, with exchange fund flows nearly stagnant. Sell-side order book depth is thinning, but buy orders are consistently accumulating within a 2% to 20% range below the current price.
- Measured by the drawdown from the all-time high and the distance from the 200-day moving average, this bear market is the shallowest on record, with its duration only about three-quarters of typical previous bear markets.
- The cost basis distribution is dense around $62,000-$68,000. The short-term holder cost basis at $69,000 acts as key resistance, while the long-term holder cost basis above $83,000-$86,000 forms a supply wall.
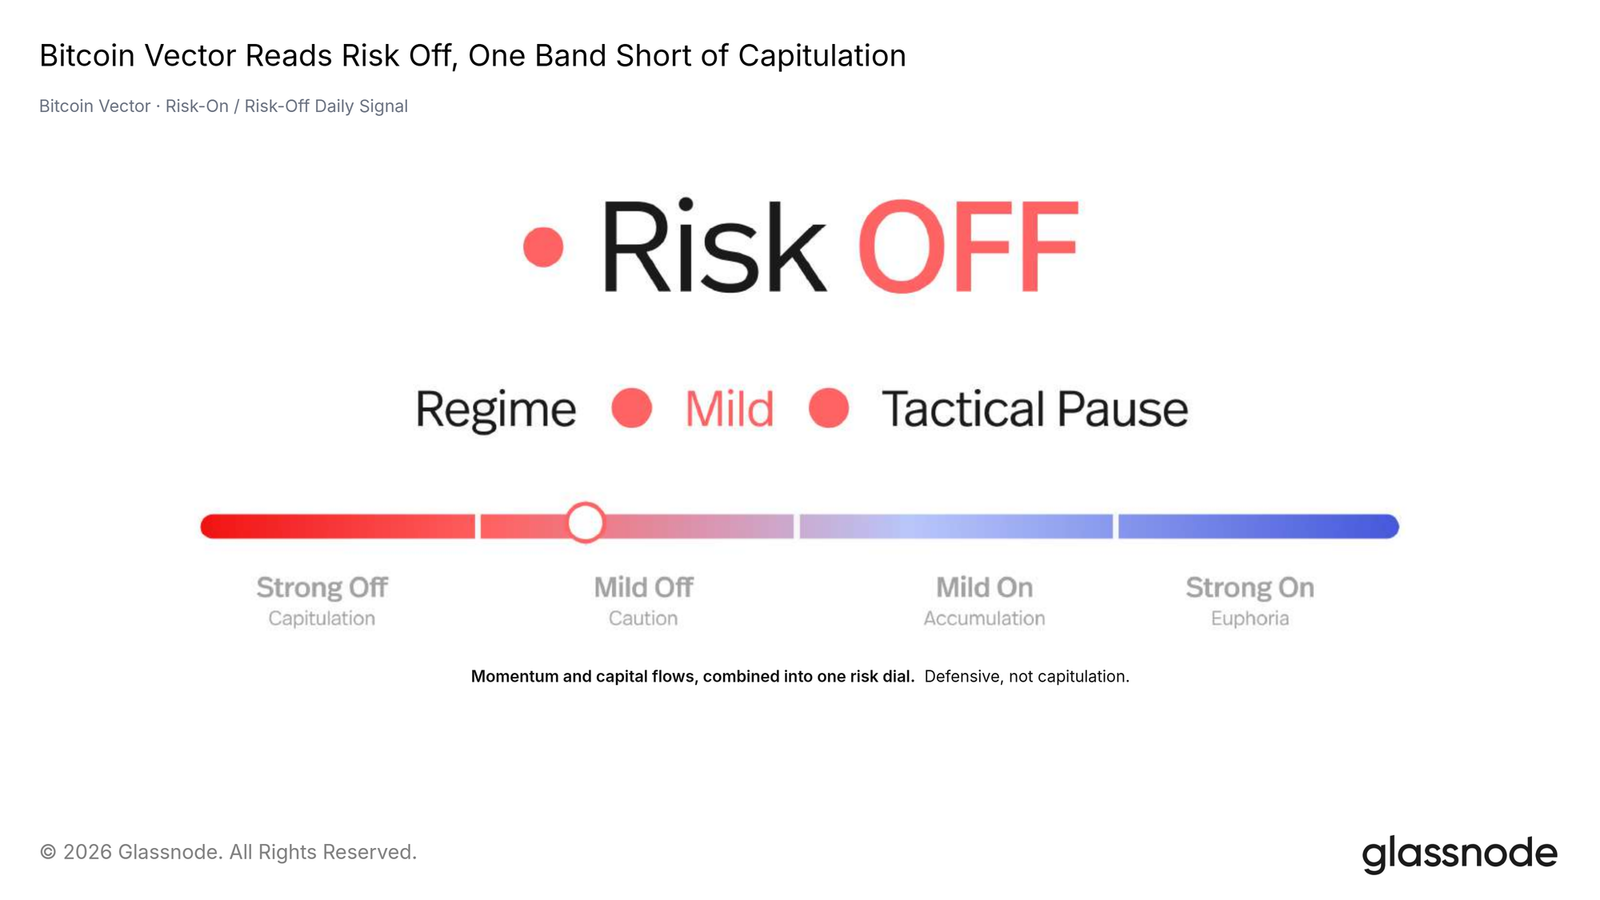
- Glassnode's Bitcoin vector reads "Risk Off," with the model characterizing this phase as a "tactical pause" rather than an extreme capitulation signal.
Original Author: glassnode
Original Translation: AididiaoJP, Foresight News
Treasury yields exceed crypto carry trades for only the second time, driving downstream markets into silence: spot trading volumes hit their lowest since 2019, exchange fund flows are nearly stagnant, and the sell-side of the order book has thinned considerably. This pullback is exceptionally shallow and has not yet matched the duration of previous bear markets.
Summary
- The bond market has stopped pricing in rate cuts and is now pricing in rate hikes.
- Treasury yields have surpassed crypto carry trades, explaining why marginal buyers are choosing to park in cash.
- Spot is sitting on the heaviest cost-basis shelf on the chart, with a breakeven line at $69,000 above.
- By depth measures, this is the shallowest bear market on record, and its duration has not yet reached previous cycles.
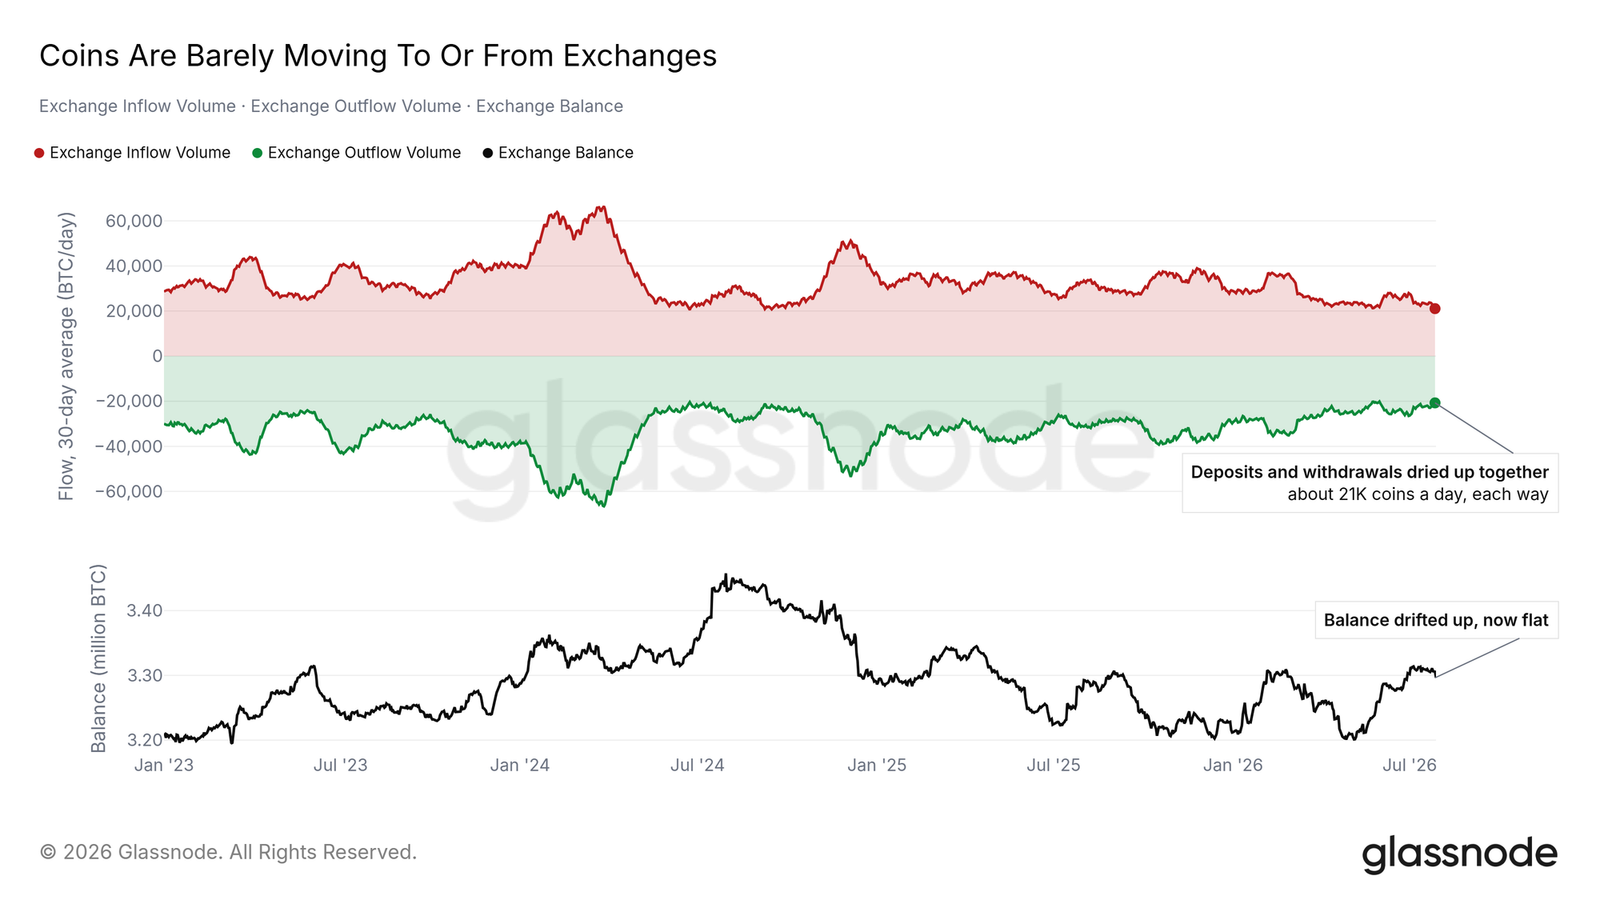
- Exchange fund flows, spot volumes, and ETF buying have all gone quiet simultaneously.
- Hedging positions were sold at the rebound highs and have started flowing back within a week.
- Buy orders are waiting well below the spot price, while the sell-side has thinned. The vector reading is Risk Off.
Macro Insights
Leading Edge Relinquished
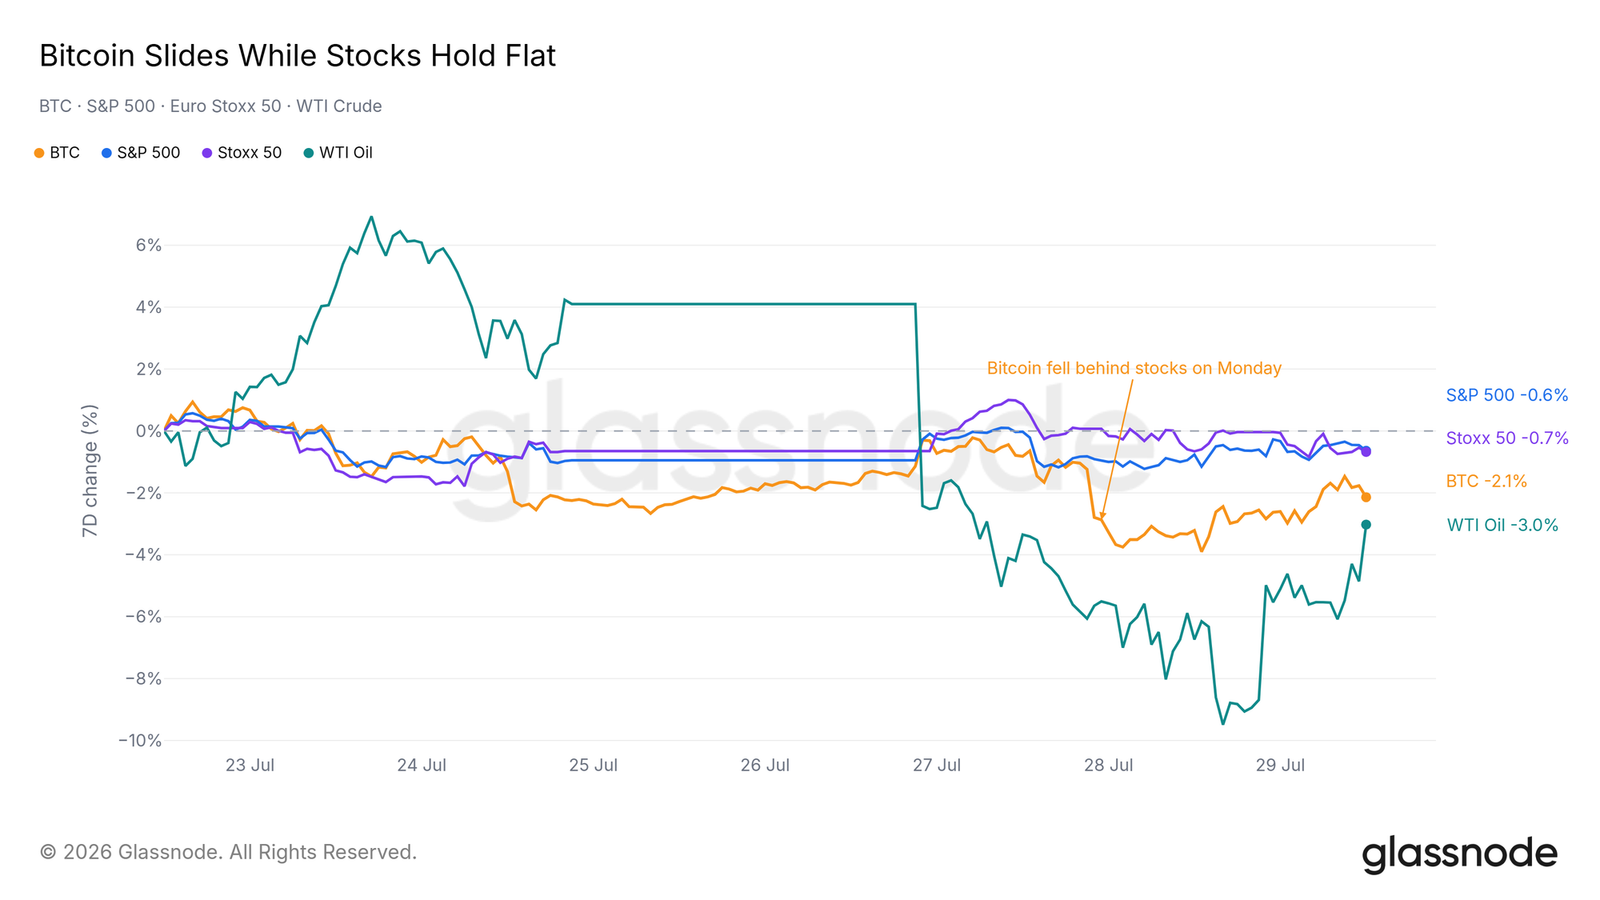
Last week, Bitcoin outperformed equity indices, absorbed the oil shock (stocks barely moved), and both closed higher. This relative strength has faded this week. Bitcoin declined throughout the week while US and European stocks treaded water. The turning point came on Monday: Bitcoin has not matched equities since that trading day. Oil also gave back last week's gains, making it the weakest performer of the four.
One week of relative weakness does not constitute a regime change. However, it does remove one of the few supports from June's recovery—when Bitcoin was bought on days with no equity market action.
The Bond Market is Already Pricing in Rate Hikes
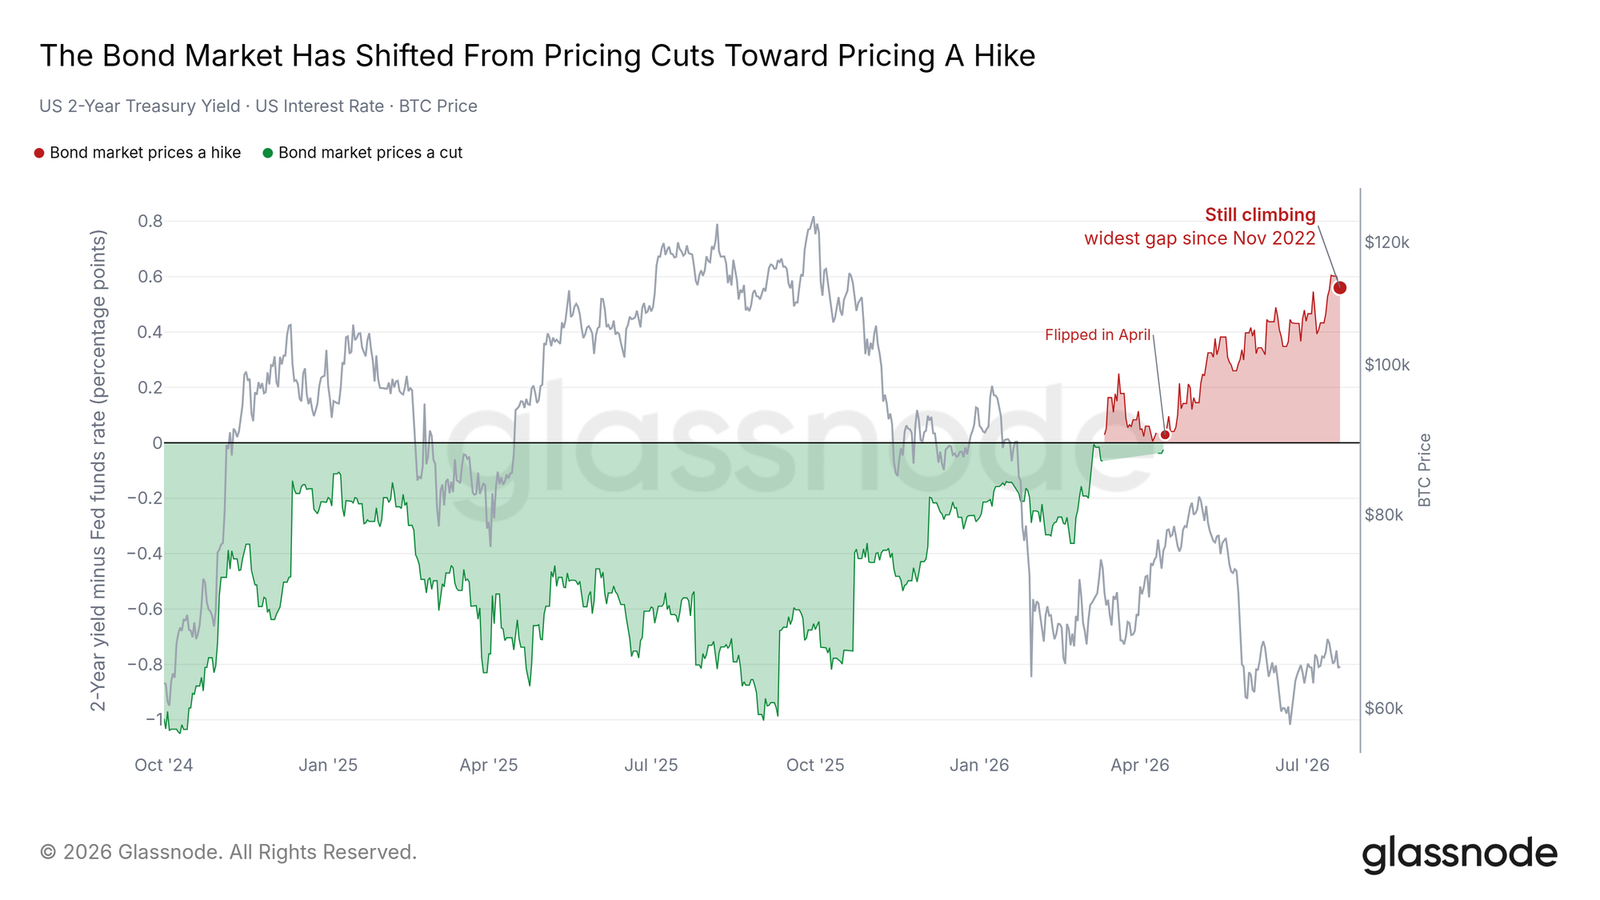
The FOMC makes its decision today, but the bond market has already made up its mind. The 2-year Treasury yield (the cleanest read on policy path) has been above the federal funds rate since April, and the gap between them is the widest since November 2022. This is not pricing waiting for a cut; it leans towards the next move being a hike.
A rate cut today would catch most positions off guard, though it would naturally align with the tame core inflation data mentioned in last week's report. Market reaction matters more than the decision itself: if positive surprises still fail to hold bids, it speaks more to the absence of marginal buyers than to the decision itself.
Where Have the Buyers Gone
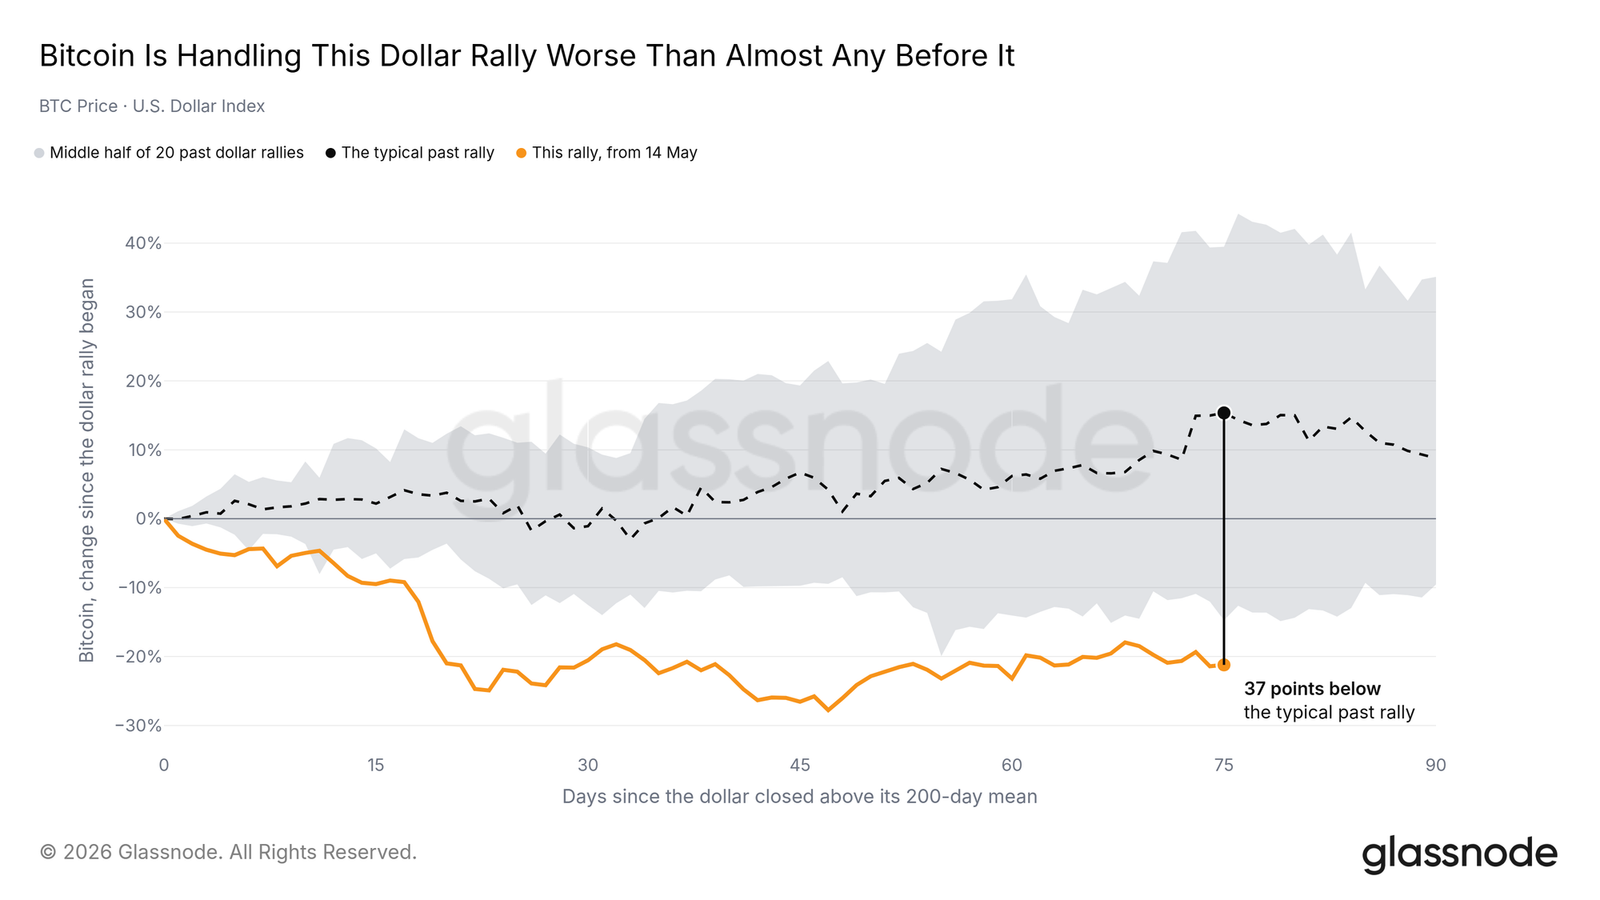
The dollar has been strengthening since May, and Bitcoin's digestion of this dollar rally is nearly the worst on record. In typical precedents since 2015, Bitcoin would have risen by this stage. This time, it is deeply in negative territory, with only three out of the last 20 similar rallies being worse.
The second channel is more mechanical. The three-month futures basis (anchoring the cash-and-carry yield for institutions in crypto markets) has been below the 2-year Treasury yield since February. Historically, only one period has lasted this long—from August 2022 to January 2023, ending at the cycle bottom.
When treasury yields exceed the basis, the desks providing leverage, depth, and volume to the market have little reason to stay. Many of the on-chain and off-chain phenomena discussed below can be traced back to this spread.
On-Chain Insights
Standing on the Heaviest Shelf
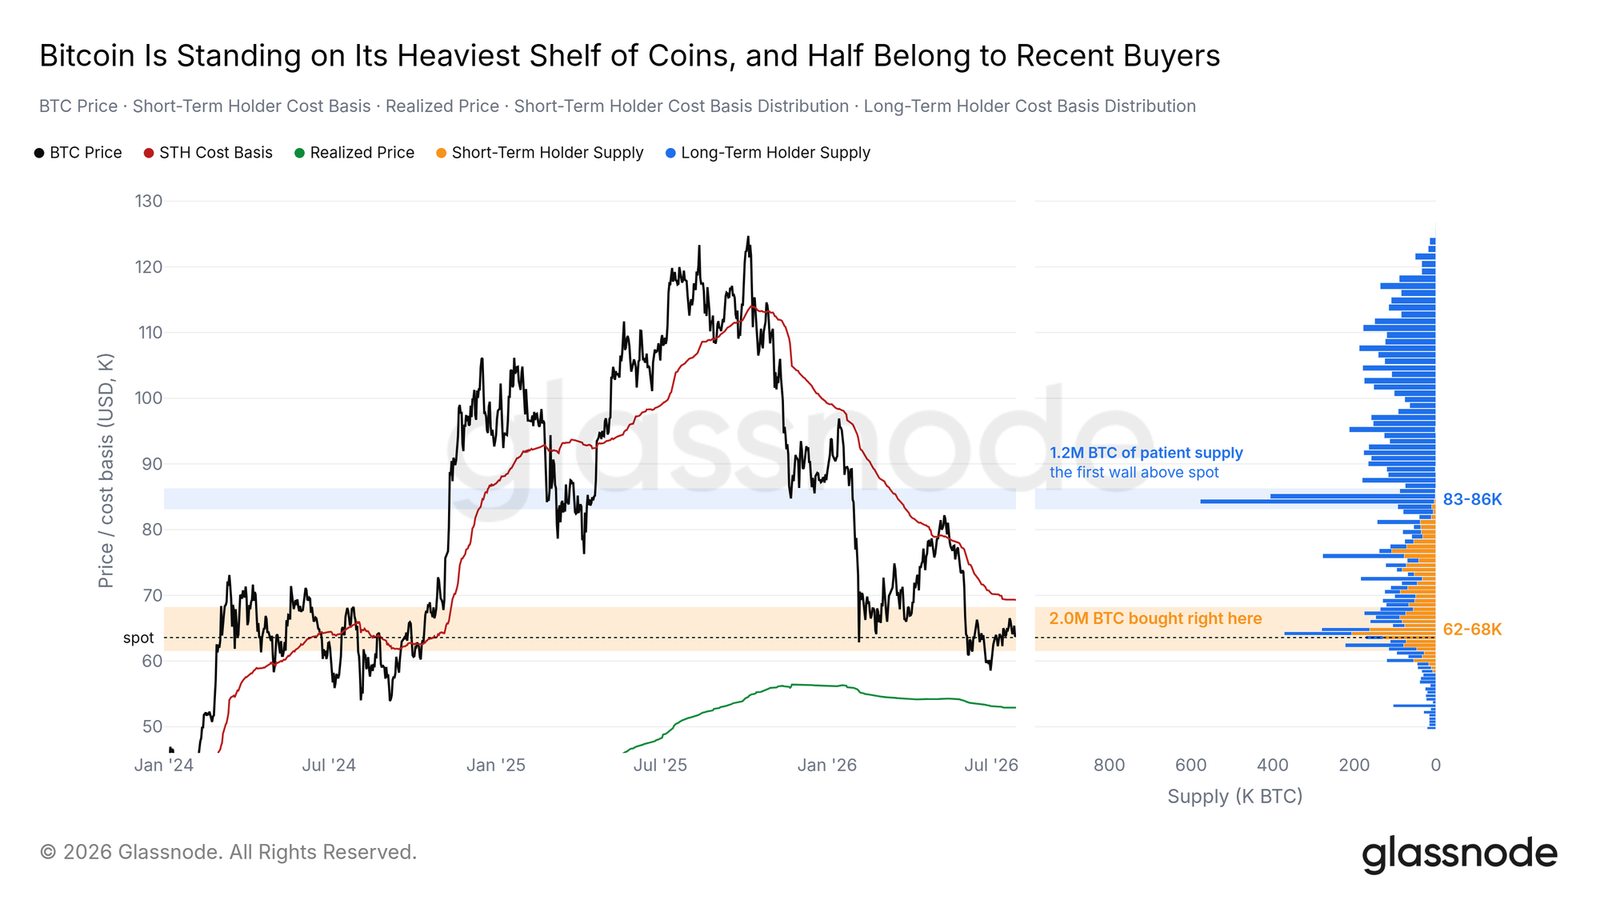
Bitcoin is trading within the heaviest single cluster on the cost basis distribution chart—roughly the $62,000 to $68,000 range, where more coins have changed hands than at any other point on the chart. This range is split nearly in half. Half belongs to short-term holders who bought during this year's decline; half belongs to long-term holders who have held through the journey.
The long-term holder half is patient supply, typically behaving like a floor. The short-term holder half is more sensitive, and most are in unrealized loss, making it the first supply to move on a bounce. Above, the short-term holder cost basis sits at $69,000, still the key line for the next leg; the real supply wall further up is the long-term holder barrier between $83,000 and $86,000.
Shallow Depth, Time Not Yet Served
Two metrics measuring this bear market tell the same story. Relative to the 200-day moving average, no previous bear market has kept price so close to the trend: this cycle's deepest discount is still far shallower than the mildest drawdowns of past cycles. Measured by the drawdown from the all-time high, the picture is similar—previous bear market bottoms were all well below this cycle's trading range so far.
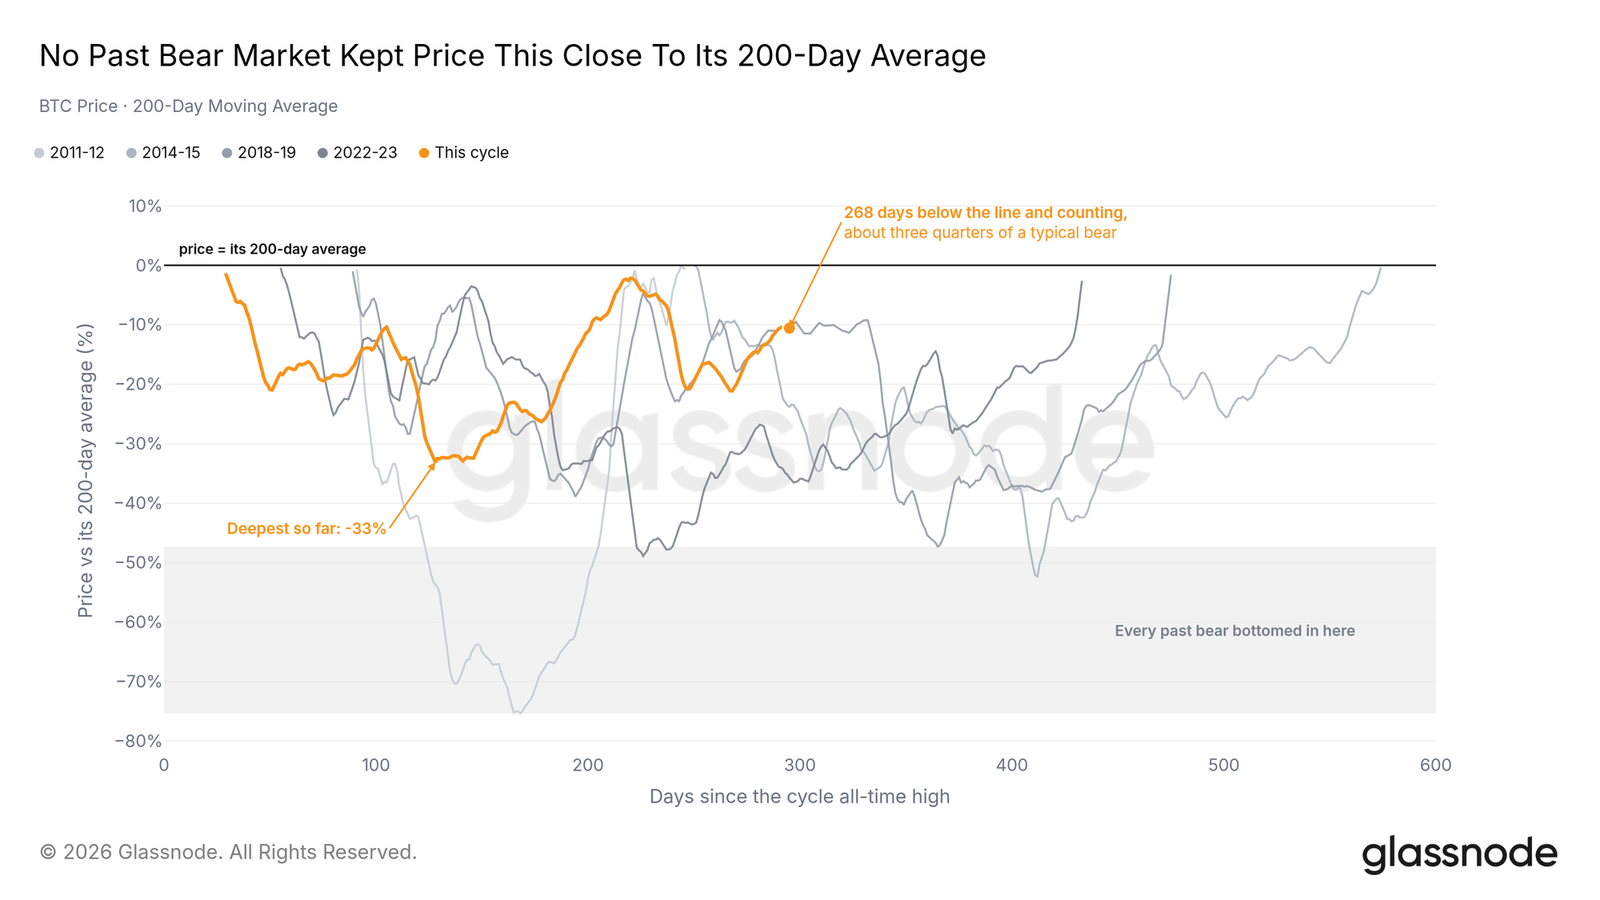
Looking at the 200-day perspective, time tells the other half of the story. Bitcoin has spent roughly three-quarters of the time below this moving average compared to typical previous bear markets, most of which lasted longer. Such a mild drawdown, having not yet completed the time required by previous cycles, supports patience in waiting rather than rushing to call a bottom—especially for those still operating on the four-year cycle map.
Exchange Outflows Slowing
Deposits and withdrawals from exchanges are both thinning. Both ends are currently running at roughly the same moderate pace, representing one of the quietest aggregate flows in the past three years, far below the 2023-2025 normal. Balances tell a similar story from the other side: they have slowly recovered since the April low and have been largely flat since early July.
This reads more as apathy than distribution or accumulation—a pattern often seen in the quiet mid-section of a bear market. So little on-chain movement means there is almost no ready supply to absorb demand once it changes.
Off-Chain Insights
ETF Buying Goes Idle
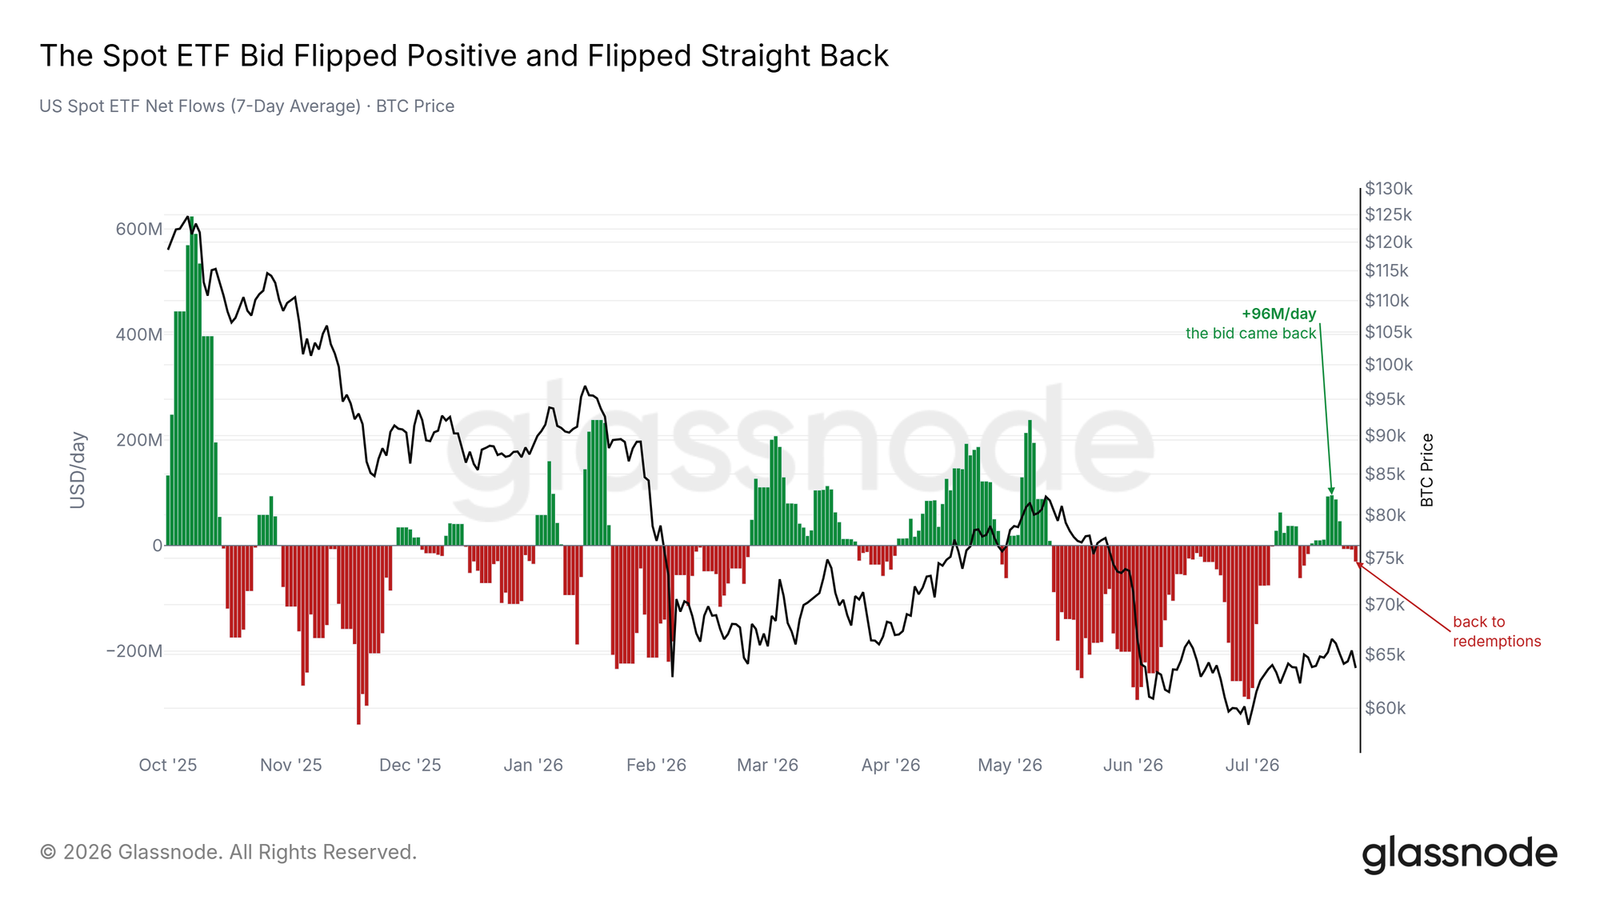
US spot ETF flows turned positive in mid-July, only to reverse sharply within a week. Net inflows are slightly negative again. Compared to the redemption waves in June and early July, current outflows are nearly negligible.
The institutional channel is neither dumping nor pumping. After last week's flip, what really matters is persistence rather than scale, and persistence has not materialized.
Euphoria at the Highs
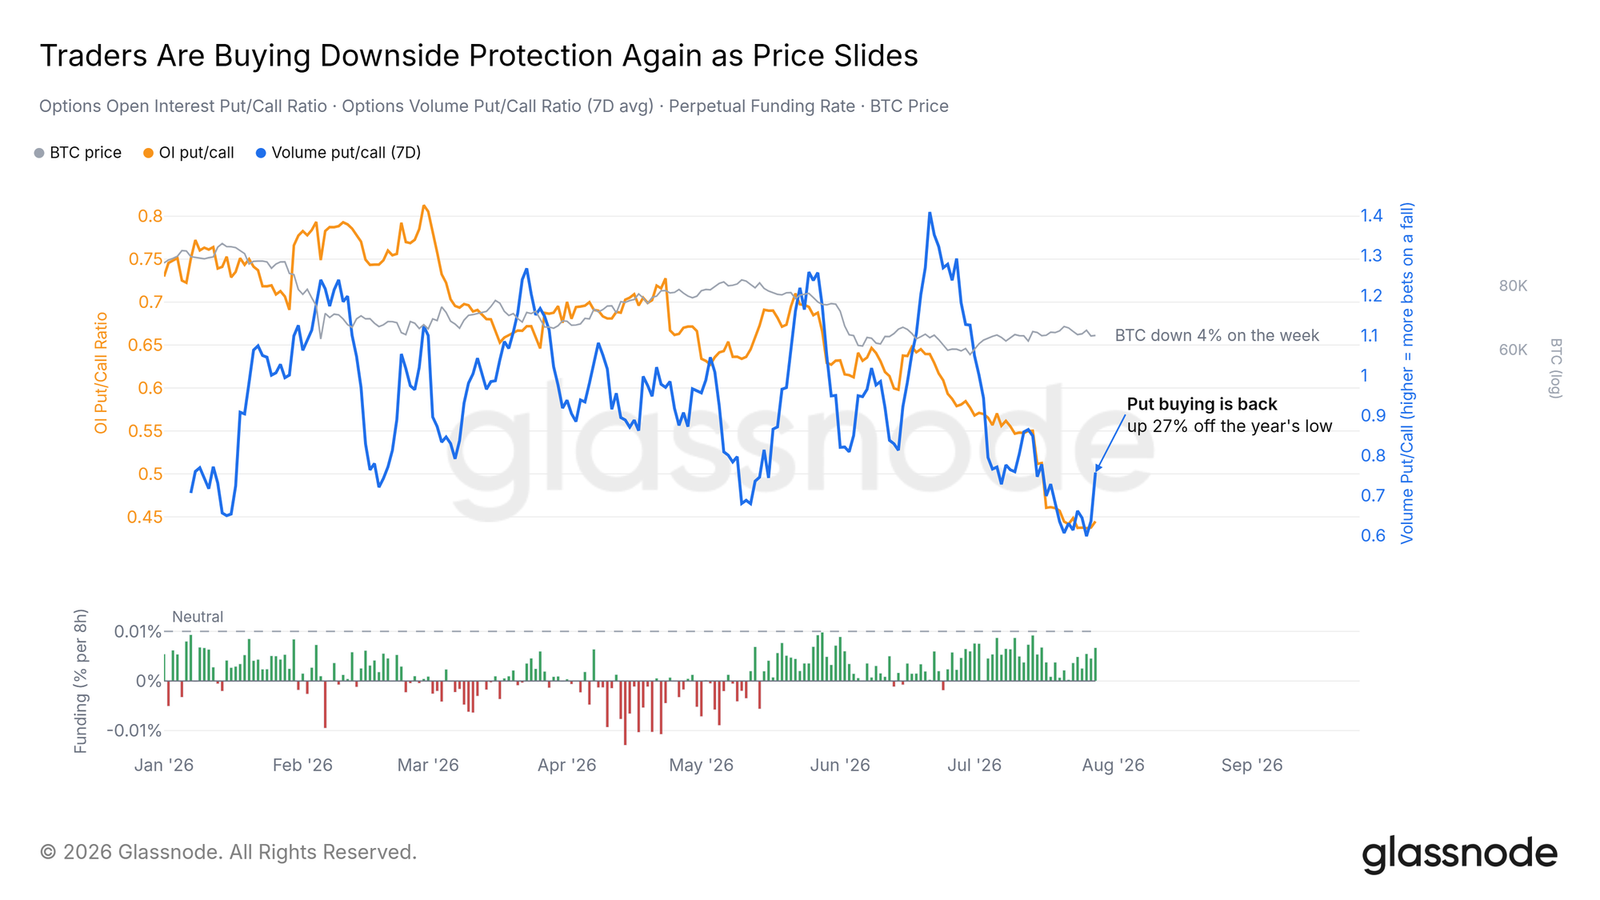
The cost of downside protection collapsed to near zero on July 21—the same day Bitcoin hit a local high following its rebound from the June low. Hedging positions were sold into the top, and the deleveraging accompanying the bounce left the market directly exposed to the subsequent decline.
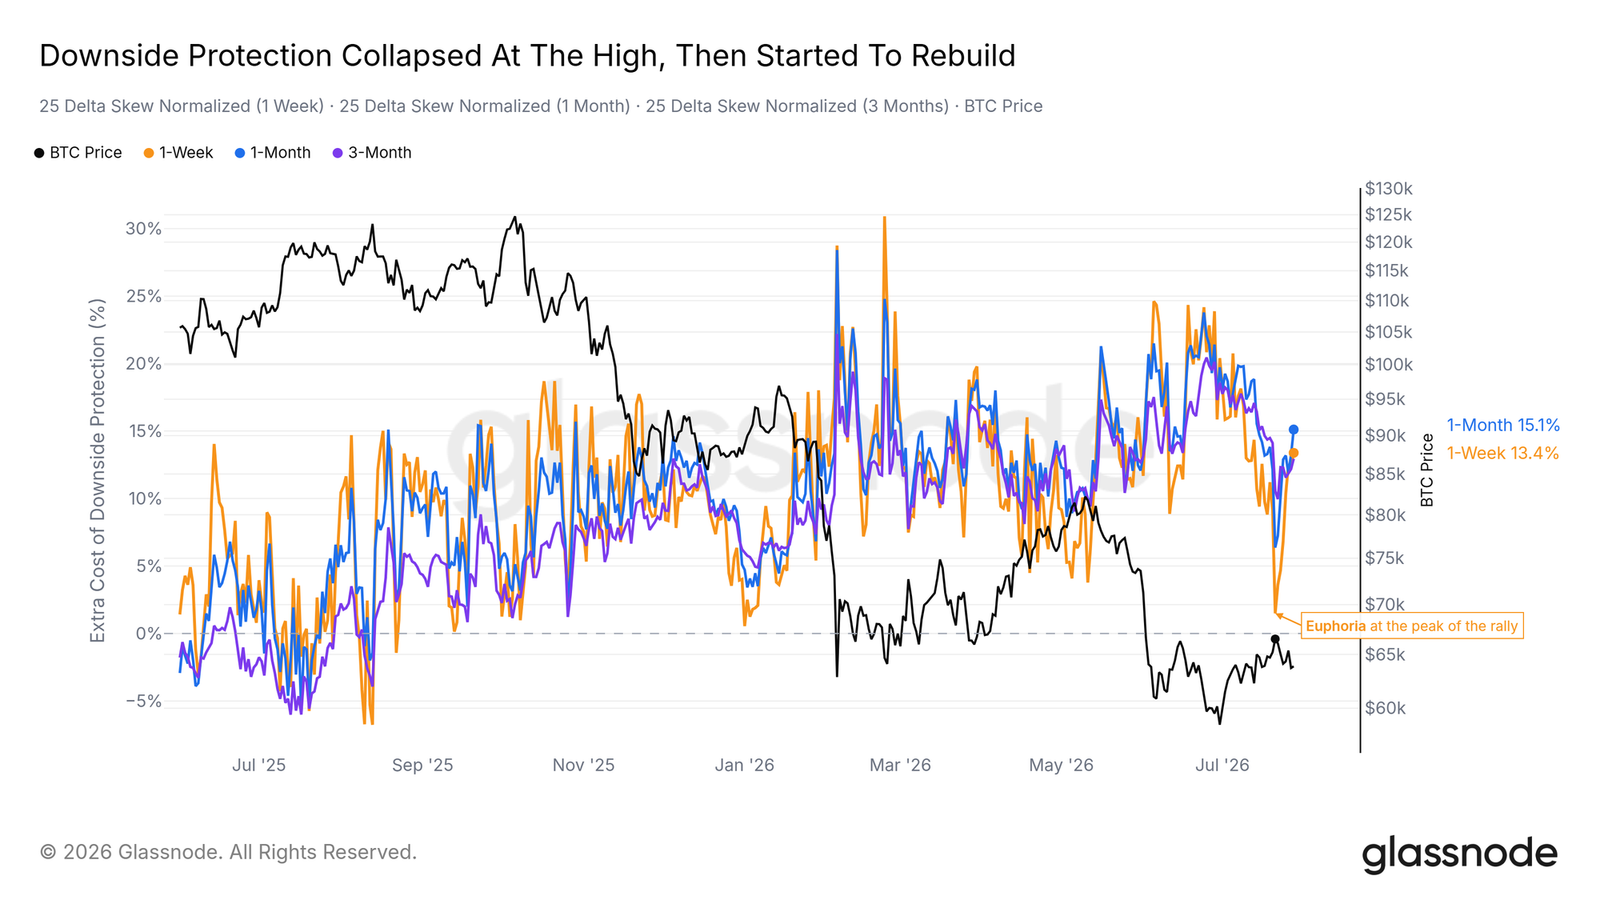
That week has proven costly for those positions. Skew has recovered from its low, and flows followed suit: the put/call volume ratio, after hitting a year-to-date low, climbed sharply as the price fell; perpetual futures funding rates have been pinned below neutral all month.
Open interest offers a more cautious reading. The put/call open interest ratio appears to have bottomed at the same time, but has barely moved from that low. Without the positioning structure following suit, this is only repositioning, not a change in stance.
Budget Shifts to Puts
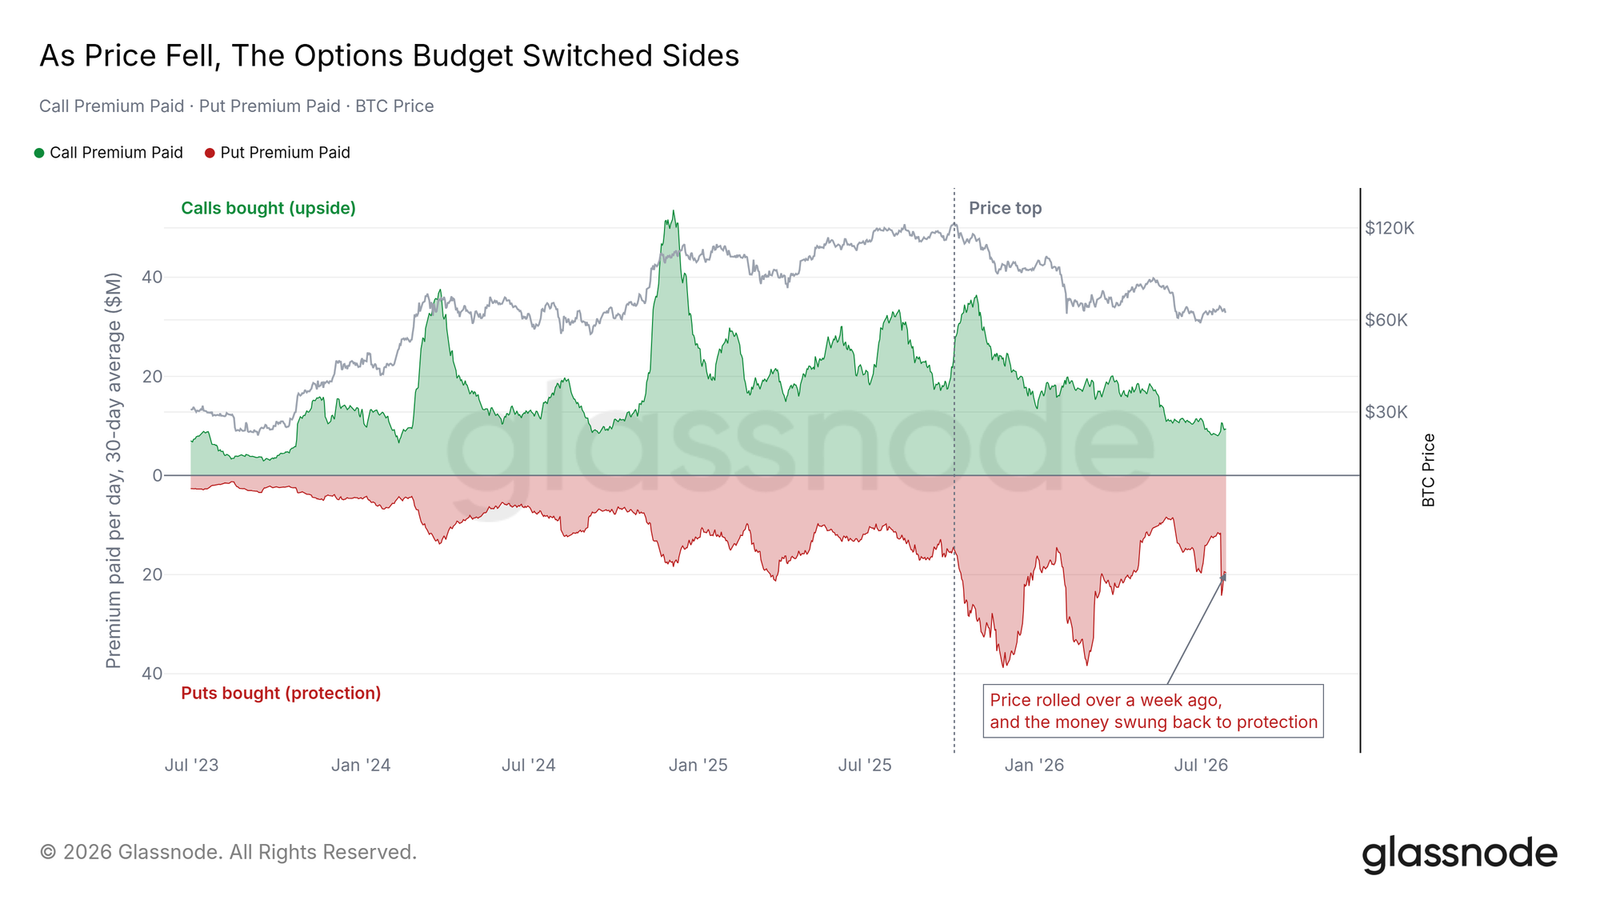
Option buyers paid for upside during the rally; since the price peaked a week ago, budgets have shifted back to puts, although one outsized put trade dominated the tail end of this shift. The real change is on the call side—upward spending has fallen sharply relative to last year's pace. This does not look like panic hedging.
Volatility pricing agrees. The entire implied volatility curve is compressed near the bottom of its range, with the six-month tenor almost never lower: option traders rarely price in such quiet expectations for the next half year.
Quietest Tape Since 2019
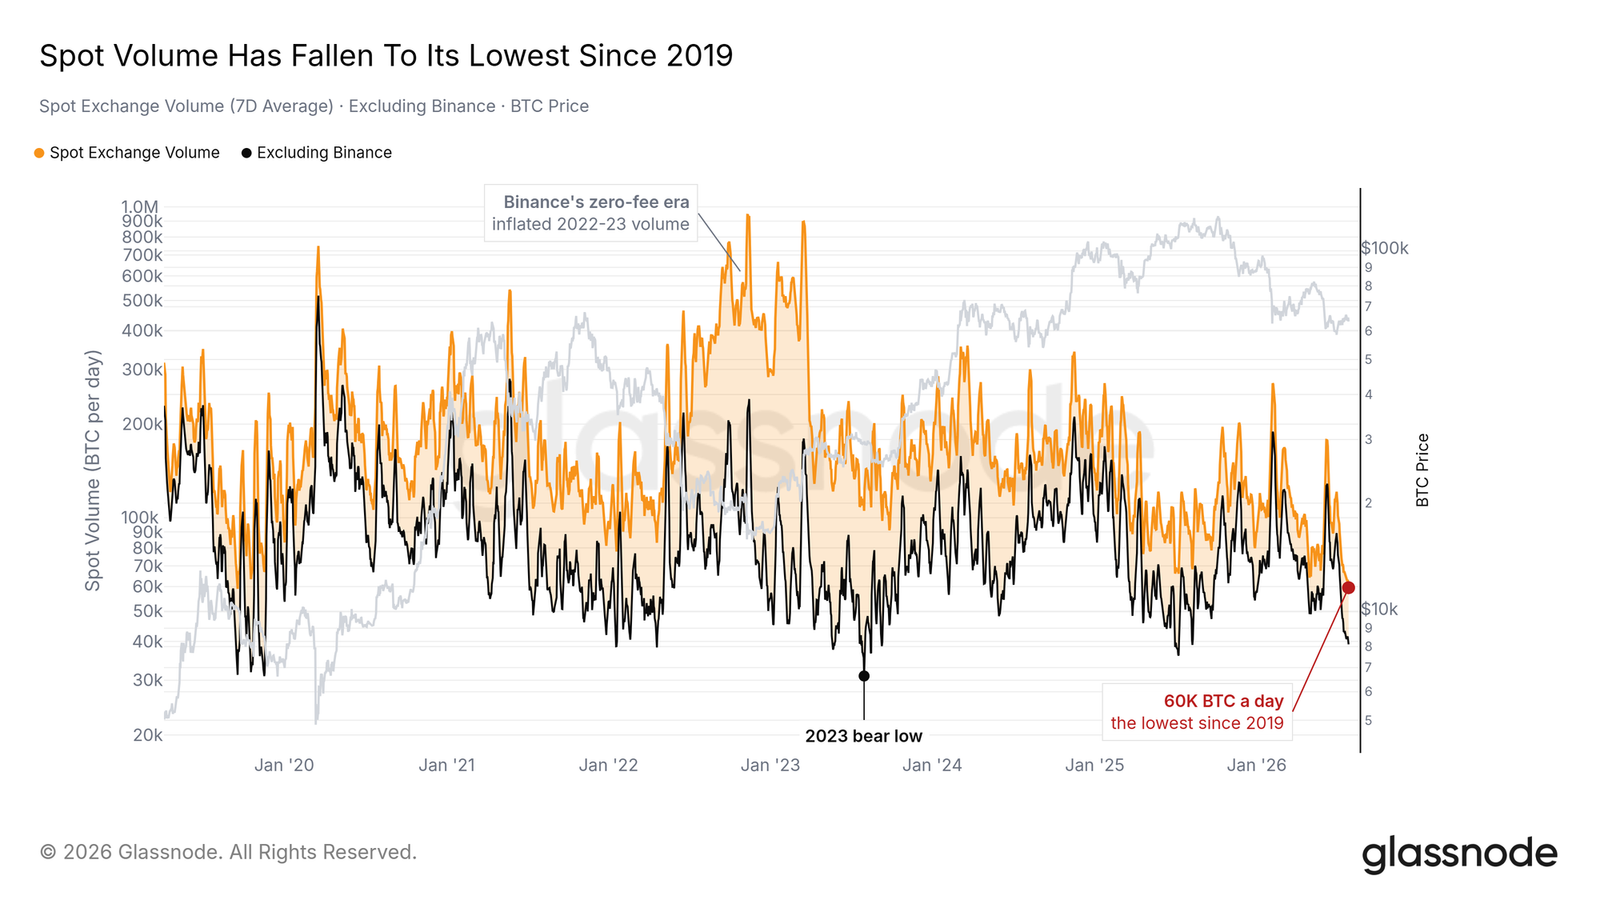
Measured in coins rather than dollars (so price declines do not flatter the data), spot trading volumes have fallen to their lowest since 2019. Excluding Binance (whose zero-fee promotions inflated tracked volumes in 2022-2023), the picture is similar, though still above the deepest trough of the last bear market.
Low volume itself is not a directional signal, but more a description of who is still present. When cash is being paid to wait, a significant portion seems to have chosen to do exactly that.
Buyers Waiting Below
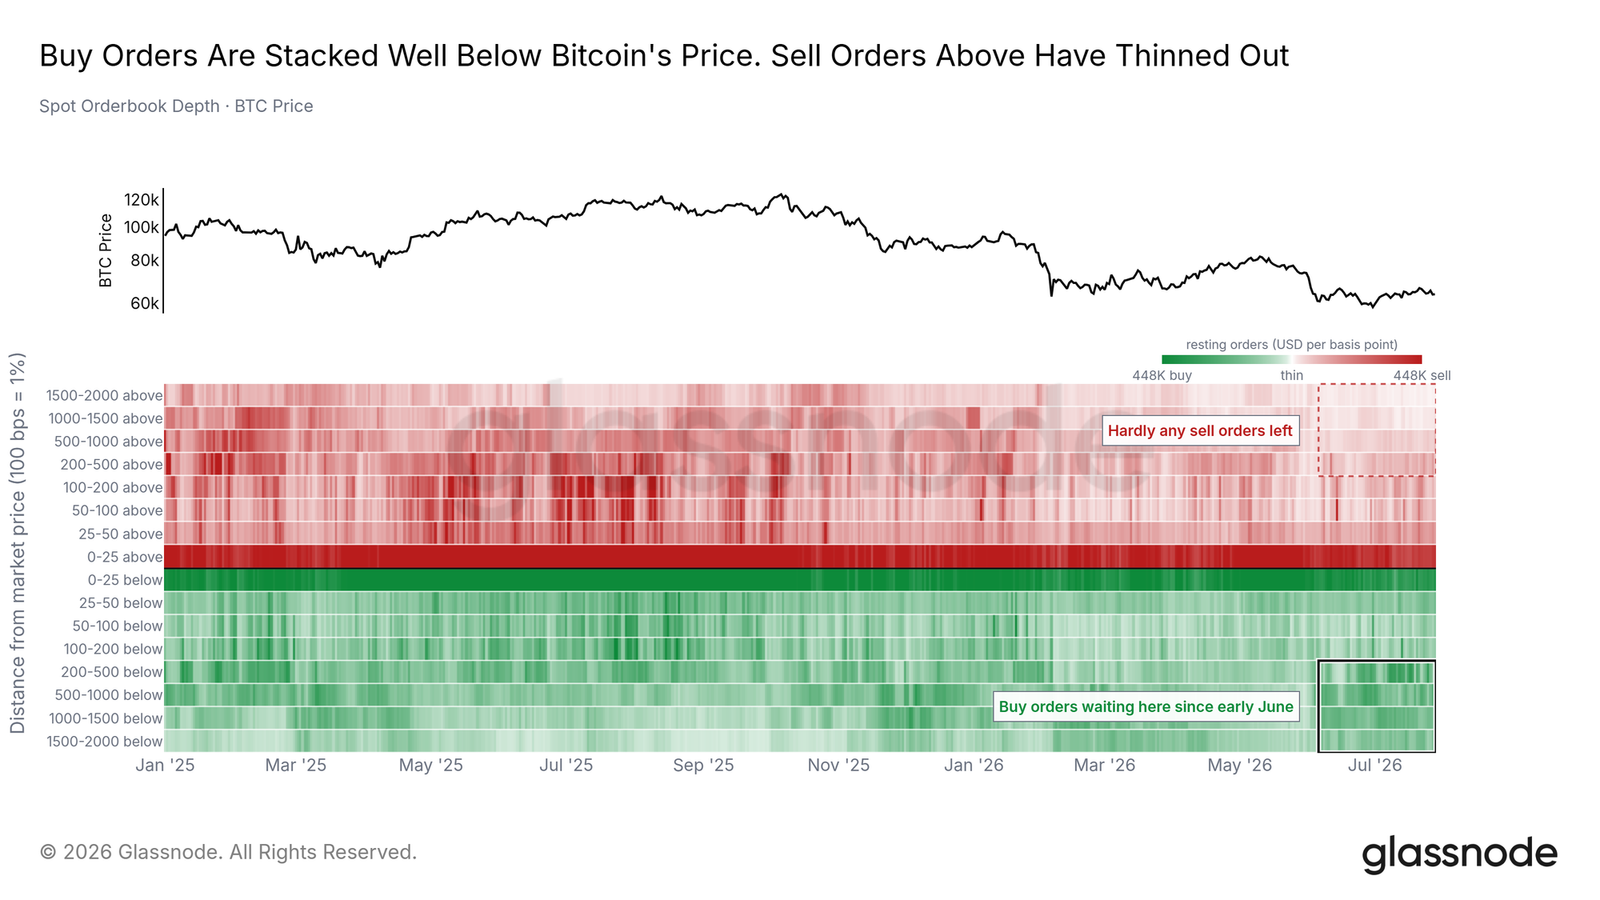
The order book shows that capital has not left but stepped back. Since early June, bids have been consistently accumulating in the 2% to 20% range below the spot price, refreshing day after day. Above the price, the sell-side has thinned considerably, with resting sell orders in the same range near their thinnest level in the past month.
Buyers seem willing to enter, just not at current levels; and there is little supply left to hinder an upward move. A thin order book is a double-edged sword, often the way quiet markets accelerate suddenly.
Final Verdict
The Vector Remains on Hold
The Glassnode Bitcoin vector reads as Risk Off: mild rather than extreme, one notch above the capitulation zone, a model calling it a tactical pause. A defensive rather than capitulatory signal is the practical embodiment of all the phenomena described above.
The macro environment pays capital to wait, the on-chain and off-chain surfaces have fallen silent, and the models scoring them are not asking anyone to jump in early. A single bounce is unlikely to change this; what changes it is the regime itself.
Conclusion
The current regime appears unchanged, with its roots upstream in the crypto market. When treasury yields exceed the basis trade and the dollar remains strong, marginal buyers are paid to stay in cash, and the downstream surfaces read the same signal: spot volumes are at multi-year lows, exchange fund flows are nearly stagnant, and the sell-side has thinned. By depth, this is the shallowest bear market on record; by the clock of previous cycles, it is not yet complete. Improvement will start with policy and manifest as a reclamation of the $69,000 short-term holder cost basis accompanied by a return of volume, alongside the ETF channel switching from idle to buying. If the $62,000 to $68,000 shelf is lost while exchange inflows awaken, this thesis is invalidated.