Bitcoin Bottoming in Progress: Long-Term Holder Selling Pressure Eases, ETF Outflows Slow


- Core Thesis: The Bitcoin market bottom is currently being established. Capitulatory selling from long-term holders is cooling, buy-side absorption of the June lows is underway, pushing prices to test key resistance from below. However, the recovery lacks follow-through from spot buying, and a breakout requires more confirming signals.
- Key Factors:
- Bitcoin's reaction to weak inflation data was stronger than that of major stock indices, indicating seller exhaustion and buyers awaiting a catalyst. The macro-driven logic is shifting from risk appetite to liquidity.
- Profit-taking by long-term holders has decreased significantly, with their selling dominated by loss-making positions. This is a classic characteristic of the late bear market phase. The entity-adjusted realized loss metric has retreated from cycle peaks.
- During the June lows, a broad and strong wave of buying occurred (ranging from small retail to large wallets), effectively absorbing the sell-side pressure. However, buying intensity has weakened as prices stabilized, leaving the market in a wait-and-see mode.
- The short-term holder cost basis, near $69,000, represents the next significant resistance level. An initial test of this level is likely to provoke a strong reaction. Above it, there is a substantial cluster of trapped buyers waiting to break even.
- The outflow pace of spot ETFs in the US has moderated from the extreme levels seen in June. The trend points towards stabilization but has not yet reversed. Institutions appear to be in a state of having stopped fleeing but not yet started buying.
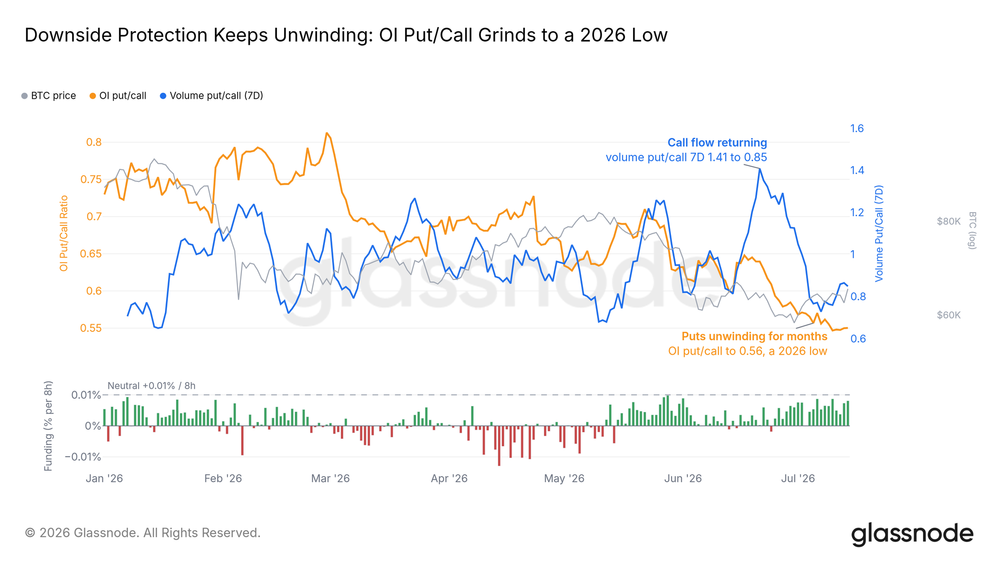
- Bearish bets are being exited in the derivatives market (the put/call ratio has dropped to a yearly low). However, this unwinding has not translated into spot buying. Funding rates are near neutral, lacking signals of excessive bullish leverage.
- The Bitcoin volatility index is near its one-year low. The market is in a compressed state. Historically, this has often been the backdrop preceding the next decisive directional move.
Original Author: Glassnode
Original Translation: AididiaoJP
Bitcoin's bottom is still being built, but its characteristics are quietly shifting. The capitulation selling by long-term holders is beginning to cool, buying demand has successfully absorbed the June lows, and the price is gradually recovering, challenging the zone that previously suppressed it.
Executive Summary
- The market has started testing the resistance level above.
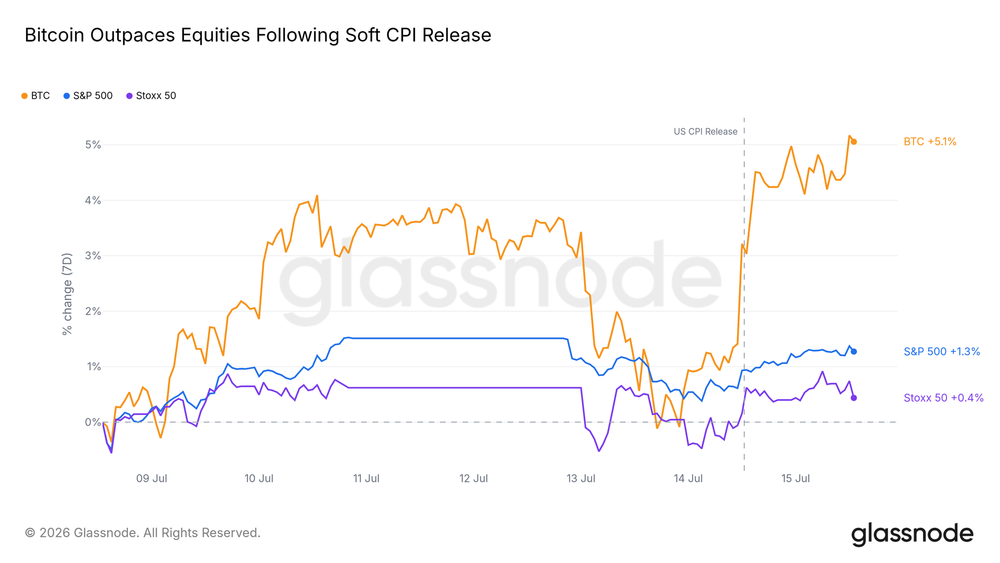
- Bitcoin's reaction to the weak inflation data was far stronger than any major stock index, marking its most positive response to positive news in weeks.
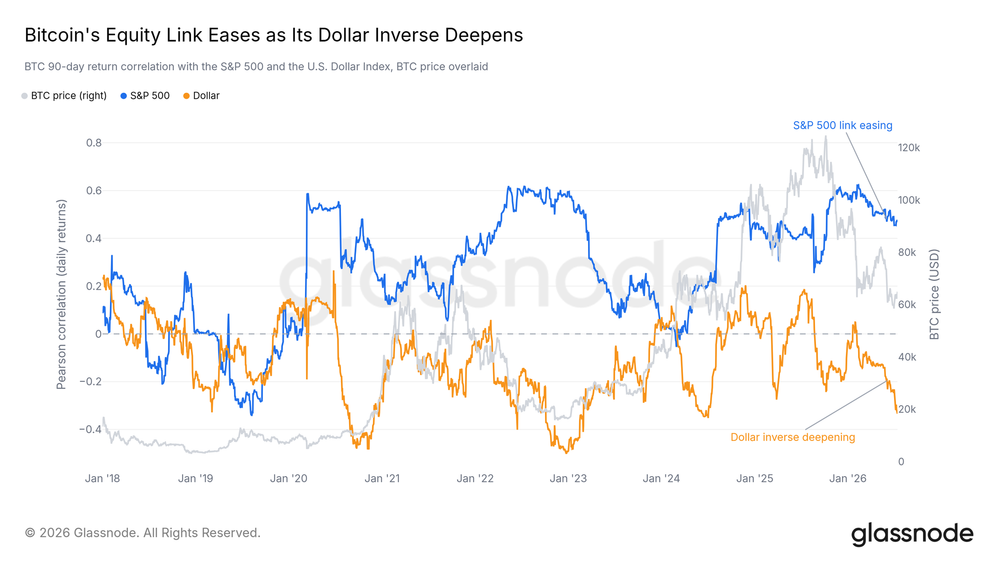
- The correlation with the stock market is loosening, while the inverse link with the US dollar is deepening further—the current driving factor is liquidity, not risk appetite.
- Selling by long-term holders—the primary source of sell pressure this year—has receded from its peak.
- Profit-taking has significantly declined, and buying demand has fully absorbed the selling at the June lows, reducing the supply pressure facing each rally.
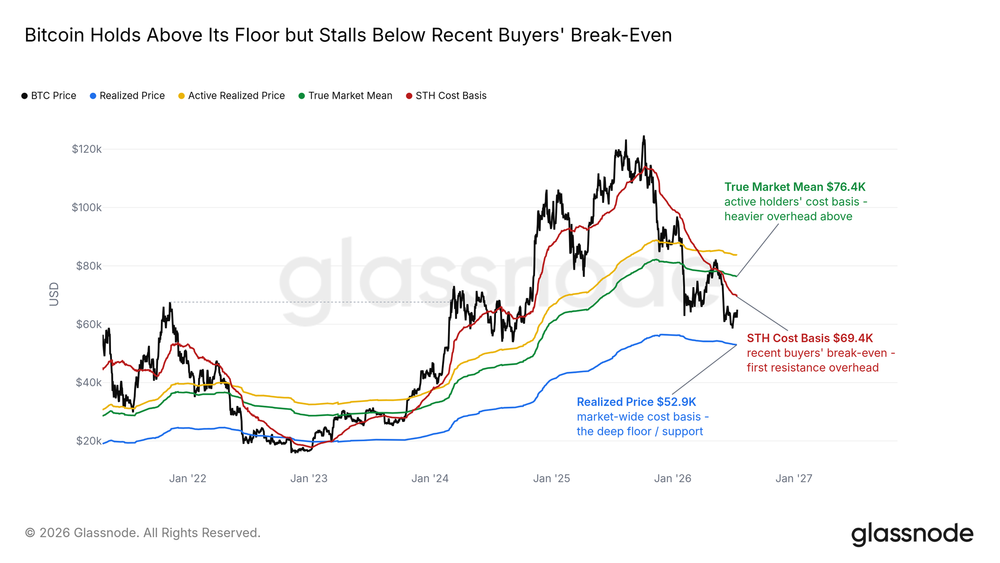
- The cost basis for short-term holders is near $69,000. This breakeven line for recent buyers will form the next key resistance; a strong reaction is expected there.
- Derivatives traders are unwinding bearish positions, but spot buying has yet to follow suit, which remains the missing piece in the current recovery.
Macro Insights
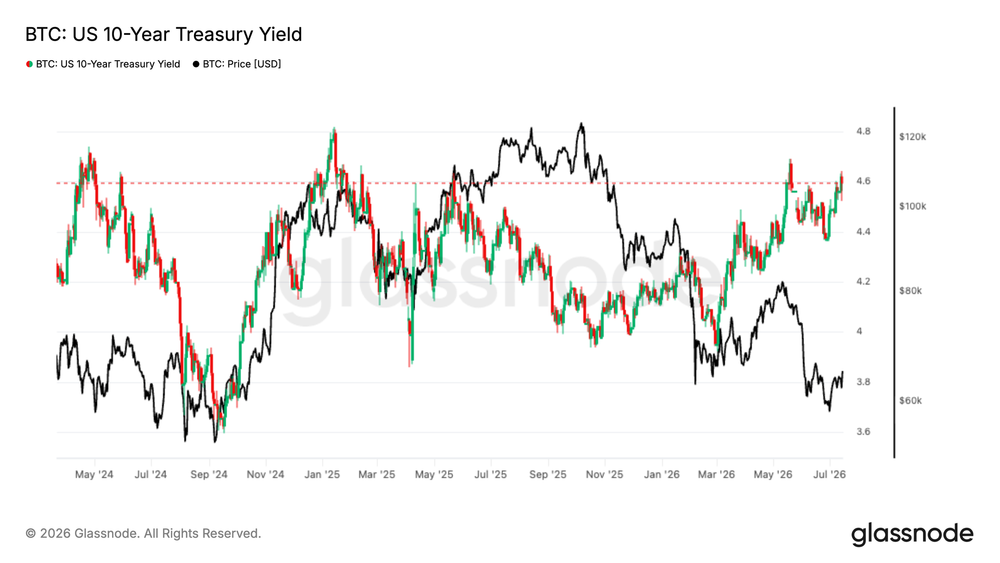
The pressure Bitcoin faced this quarter is essentially a story of real interest rates, not risk aversion. The 10-year real yield has risen to highs near 2026 levels, and the US dollar has held above its 200-day moving average since May. However, broader risk assets have shown no strain: equities are near highs, credit spreads are tight, and volatility remains subdued.
Bitcoin Leading the Rally
Following the release of moderate inflation data on Tuesday, Bitcoin's gains outpaced all other major assets. It jumped quickly after the data release and significantly outperformed US and European stock markets throughout the week. After a month of sideways trading at lower levels, the market is starting to respond positively to positive news again.
This sensitivity itself is a signal: a market that rallies eagerly on a single inflation data point often indicates that sellers are exhausted and buyers are merely waiting for a reason.
Shift in Macro Driving Logic
Underneath the rally, the drivers for Bitcoin are changing. Since winter, its correlation with US equities has been weakening, while its inverse relationship with the US dollar has deepened. Bitcoin is increasingly behaving less like an equity proxy and more like an asset that strengthens when the dollar weakens.
It hasn't completely left the risk asset category, but the influence of the dollar and liquidity channels now outweighs equity market sentiment. If the macro environment eases from here, this channel is the most likely to transmit the effect first.
On-Chain Insights
Between Floor and Ceiling
The cost basis chart precisely depicts the current position. Bitcoin's price is above the market-wide Realized Price—a natural bottom support in bear markets—while remaining below the short-term holder cost basis (near $69,000), which is the average entry price for buyers over the past five months. The current recovery is climbing towards this breakeven resistance, above which many trapped buyers are waiting to break even.
The first touch of this level will likely trigger a strong reaction, as the group most inclined to sell are those about to break even. A successful reclaim would open up space for the recovery; rejection would mean the range-bound pattern continues.
Sellers Stop Taking Profits
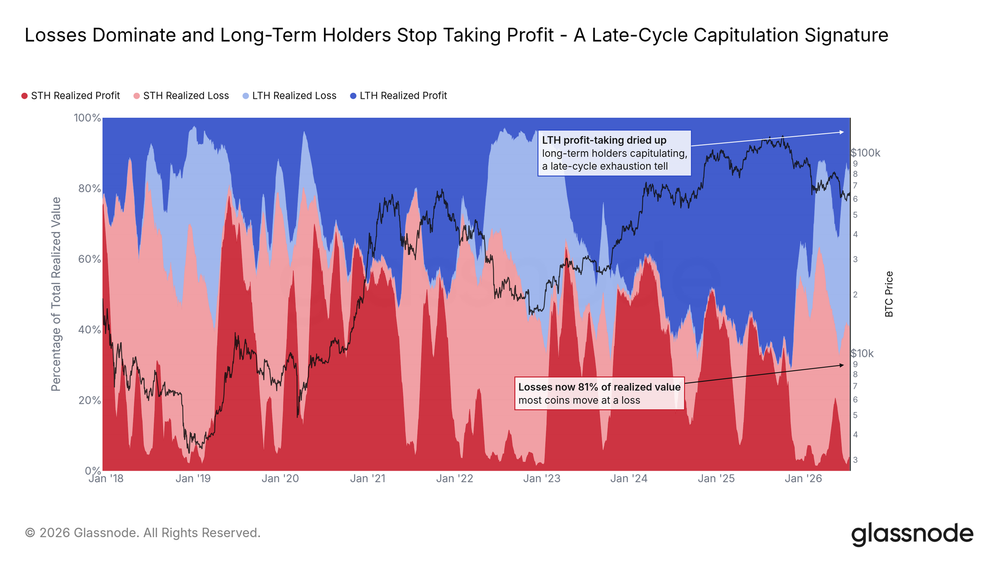
The Realized Profit/Loss Ratio for long-term vs. short-term holders classifies all on-chain selling into four categories: veterans vs. newcomers, selling in profit or at a loss. For most of this cycle, profit-taking by long-term holders dominated the sell side. Now, this flow has nearly dried up; the selling from veterans is predominantly at a loss.
Selling at a loss by both groups constitutes the main on-chain transaction characteristic—a typical late-stage bear market signal. The key change is that the share of selling from long-term holders has stopped growing. The wave of sell pressure that met every rally since the start of the year is no longer expanding.
Capitulation Selling Begins to Cool
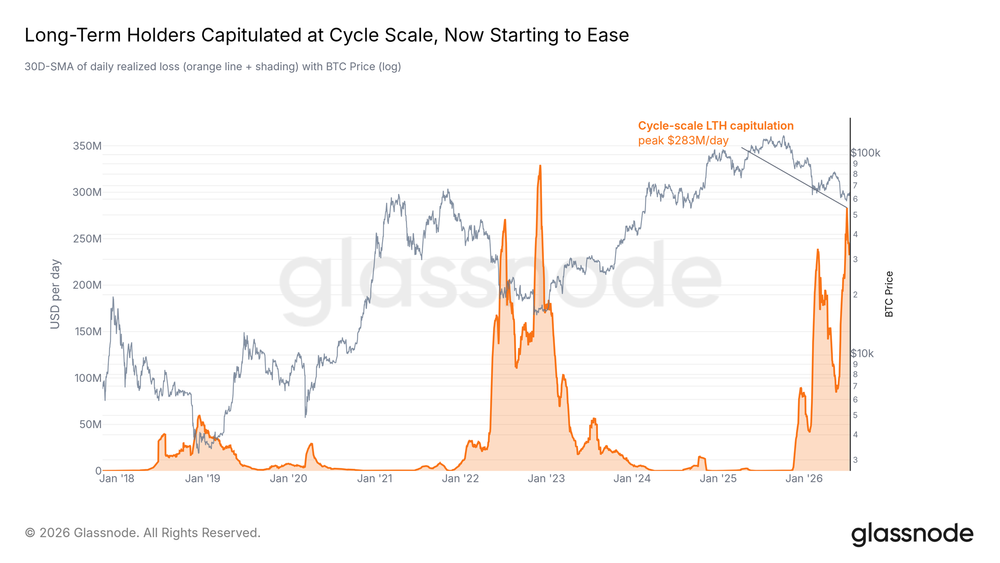
This capitulation rhythm is currently the most important indicator. The entity-adjusted Realized Loss metric for long-term holders, which filters out internal transfers, truly reflects the amount veterans are relinquishing daily. It hit a cycle peak two weeks ago. In last week's report, we explicitly stated that the cooling of this metric is a prerequisite for any lasting recovery.
It has now started to decline. One decline does not prove complete exhaustion; new shocks could restart selling. However, this is the first time in this cycle that a core metric defining the bottoming process has shifted from rising to falling. The primary sellers driving this bear market are, at the margin, drying up.
Demand Absorbs Low-Point Selling
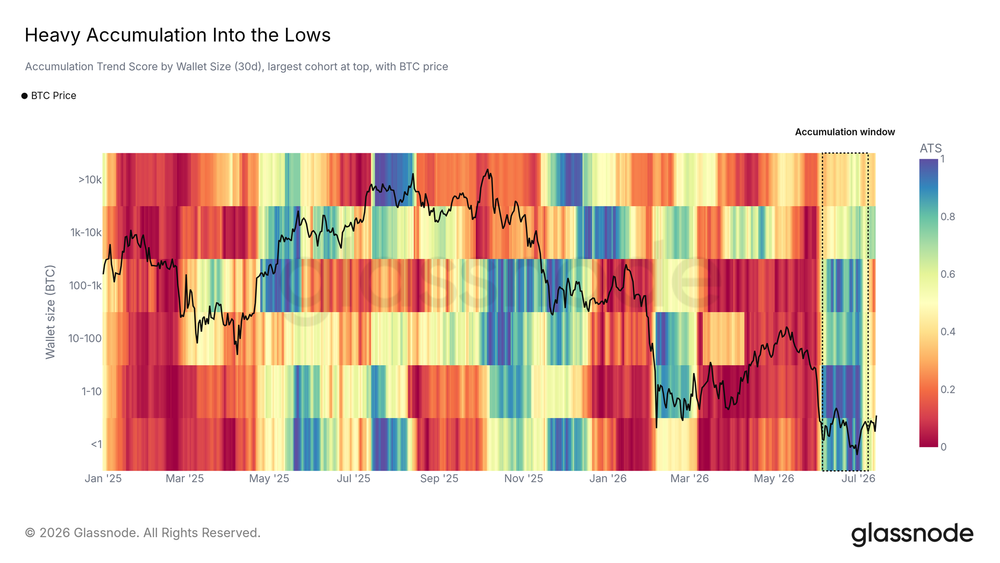
As veterans capitulated, buyers stepped in just in time. The Accumulation Trend Score broken down by wallet size shows a broad and strong wave of buying during the June lows, covering wallets from small to large. After the price stabilized, this intensity decreased, and the market entered a waiting mode.
The coins sold at the lows found takers. Whether these buyers can return with equal force during the next volatile move will determine if this bottom can hold.
Off-Exchange / Derivatives Insights
ETF Outflows Slow Down
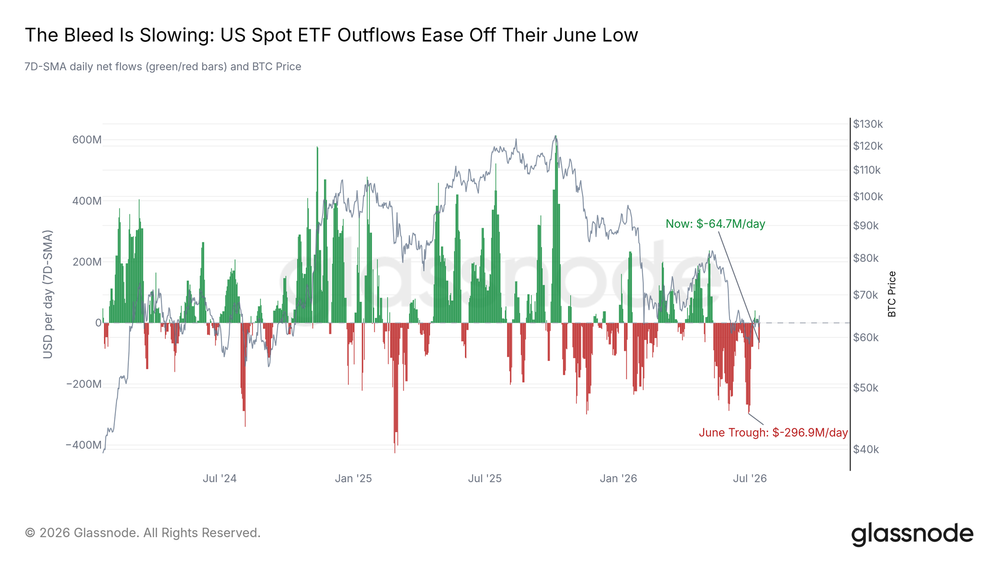
US spot ETFs tell the same story of easing but unresolved pressure. Redemption pressure has fallen significantly from the extreme June levels, with the trend pointing toward stabilization. However, the channel isn't fully repaired yet: one day this week saw the largest single-day outflow in weeks, partially reversed the following day.
Until genuine inflows return and hold steady, this remains a market where institutions have stopped fleeing but haven't started buying.
Bears Give Up Resistance
The derivatives market has moved in the opposite direction for weeks. The put/call ratio for options has dropped to its lowest point this year, as traders let bearish protection expire; the perpetual funding rate is only slightly above neutral, far from crowded long levels. Bearish bets are quietly and steadily being exited.
However, this unwinding hasn't translated into actual buying. Position adjustments by futures and options traders do not equate to capital entering the spot market, and this is the clearest warning sign for the current recovery.
Panic Premium Eases
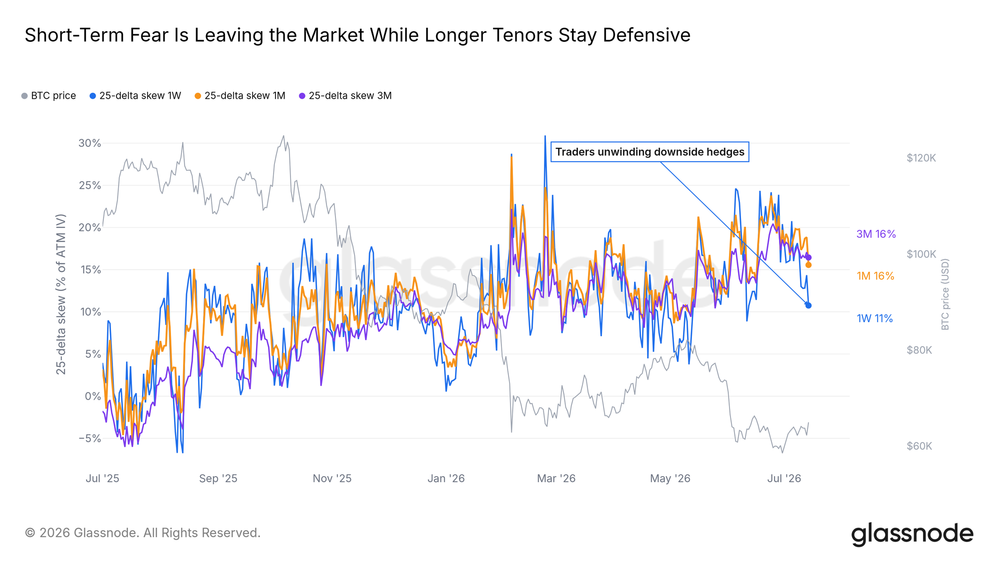
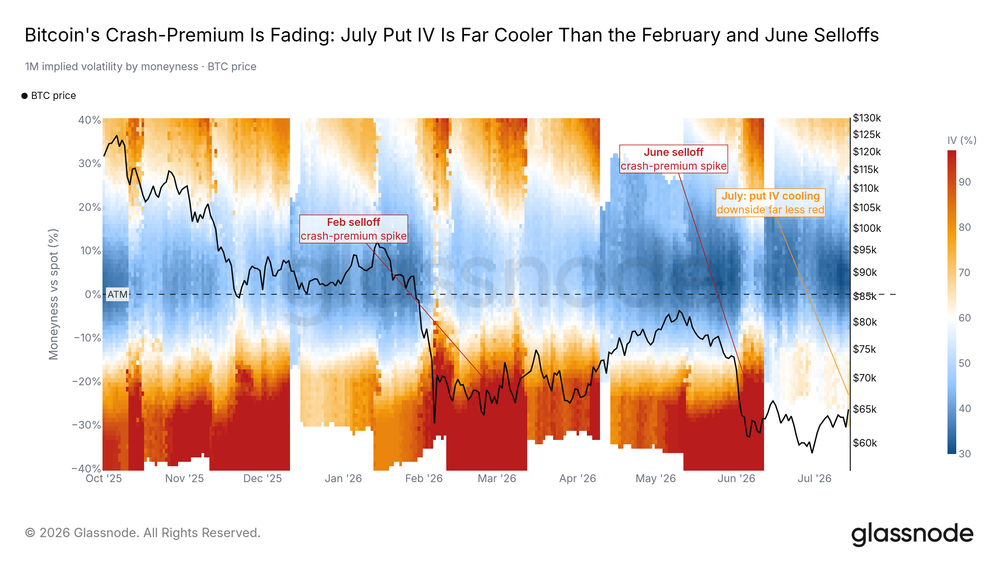
The premium for crash protection in the options market (measured by 25-Delta Skew) surged during the June sell-off but has since consistently declined, now far below the extreme February levels. The hedging cost for each pullback is significantly lower than a month ago.
Demand for protection persists—as it should when the low hasn't been confirmed—but the overall direction is normalizing.
Approaching Max Pain
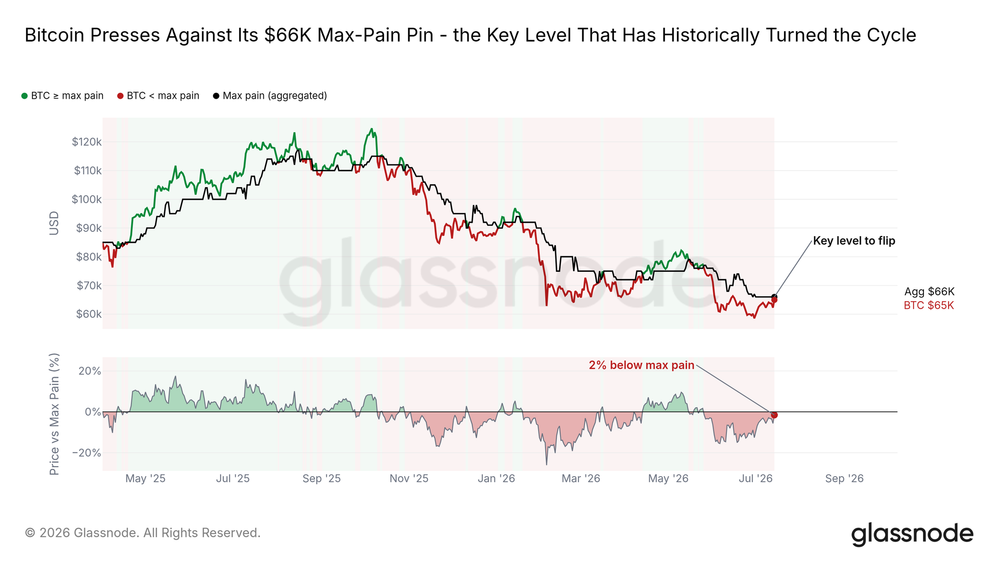
Max Pain, the price at which the largest share of open options expires worthless, has been a gravitational point for the spot price this year. Bitcoin is currently just below this level and challenging it for the first time in weeks.
Historically, reclaiming Max Pain often coincides with a shift to a more favorable market environment, although the transition takes time. Cleanly holding above this level would be the first structural signal for an upward breakout from the range; rejection would confirm the cautious sentiment still priced into the options market.
Cost of Crash Protection Declines
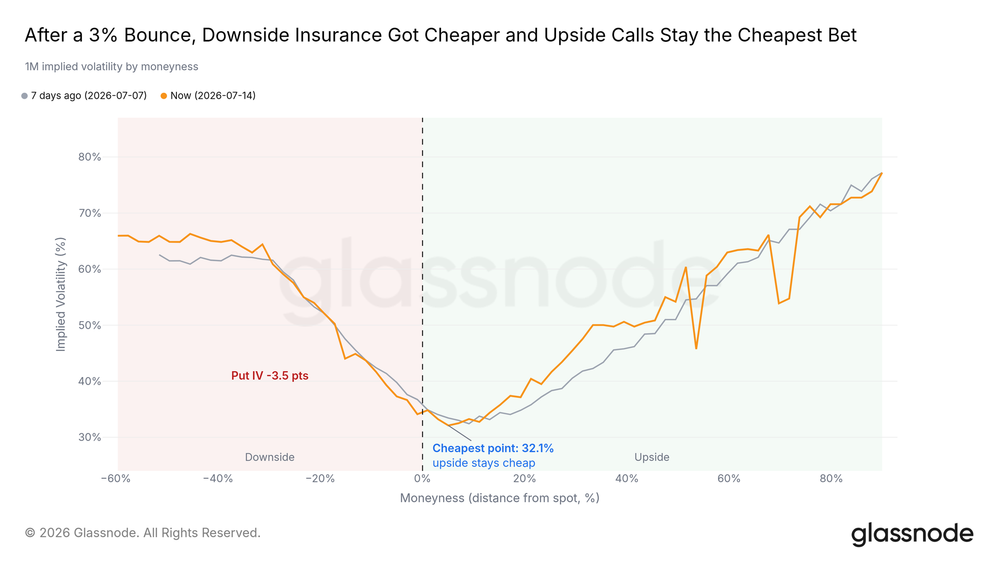
The absolute cost of protection also confirms the easing trend. During the recovery, the price of one-month crash protection has steadily declined, indicating reduced hedging demand. The market still pays a premium for the downside, but it's far lower than the levels seen at the lows.
Volatility Enters a Quiet Period
A longer-term perspective shows how calm the market has become. The Bitcoin Volatility Index (DVOL) is near its one-year low, and the deep bearish pressure that erupted in February and June has faded from the volatility surface. Such compression is rarely long-lasting; it often forms the backdrop before the next decisive move.
Conclusion
The bottom is still being built, and this week it began to respond. Long-term holder capitulation has receded from its peak, profit-taking has dried up, and the June lows were absorbed by widespread buying. Bitcoin reacted more strongly to positive macro news than other assets, is approaching Max Pain from below, and is nearing the short-term holder cost basis above—which will be the first real test for the recovery.
Confirmation signals are still absent: ETF outflows are slowing but not reversing, derivatives unwinding lacks spot market follow-through, and volatility compression awaits a catalyst. The key signal that would change the assessment is spot-driven buying pushing the price to effectively break and hold the short-term holder cost basis. If losses for long-term holders accelerate again, or if the price gets knocked back near the realized price, the market will return to range-bound trading.
The foundation has been laid, but the follow-through has yet to arrive.