
Buying BTC is Worse Than Buying the Nasdaq? That Statement Has an Expiration Date
- Core Thesis: The recent narrative on social media that "US tech stocks outperform Bitcoin" suffers from significant selection bias, with its conclusions dependent on a specific time window. Through multi-starting-point comparative analysis, Bitcoin's returns still surpass the Nasdaq 100 in most cycles. Fundamentally, the two represent a difference between cyclical assets and trend assets.
- Key Components:
- Selection Bias: The Reddit comparison chart selected the window from May 2021 to May 2026, with the starting point coinciding with the peak of a Bitcoin bull market (approximately $48,000), while the Nasdaq 100 was on the eve of the AI rally, causing the latter to lead.
- Multi-Window Comparison: Across five key starting points, Bitcoin outperformed the Nasdaq 100 in March 2020 (up 1,279%), November 2022 (up 400%), and January 2024 (up 82%). It only lagged in the two windows starting May 2021 and October 2025.
- Volatility Structure Differences: Bitcoin is a cyclical asset, with historical bull-bear drawdowns reaching 75%-85%. The Nasdaq 100 is a trend-following asset with smoother movements and relatively stable long-term return ranges.
- Leverage Characteristics: Bitcoin moves in the same direction as US stocks but with 3-5x amplified magnitude. In 2022, when the S&P 500 fell 19%, Bitcoin dropped 65%. In 2024, when the S&P rose 24%, Bitcoin surged 135%.
- Current Cycle Position: Bitcoin is down 37% from its October 2025 high of $126,000, placing it in a cyclical undervalued zone. Historical experience suggests that narratives like "buying BTC is worthless" are often loudest near the cycle bottom.
Original Author: Ku Li, TechFlow by Deep Tide
Esteemed U.S. stock traders have had a rather comfortable half-year.
The S&P 500 and the Nasdaq 100 have alternately hit record highs, the narrative around AI capital expenditure has grown ever larger, and account net worth has risen accordingly. In contrast, Bitcoin has pulled back from $126,000 in October of last year to around $80,000, a drop of 37%. For those holding it, the experience likely boils down to just two words:
Agony.
This emotional gap is fermenting on social media into a new narrative: Investing in U.S. tech stocks is simply better than buying Bitcoin, and most of the time it is.
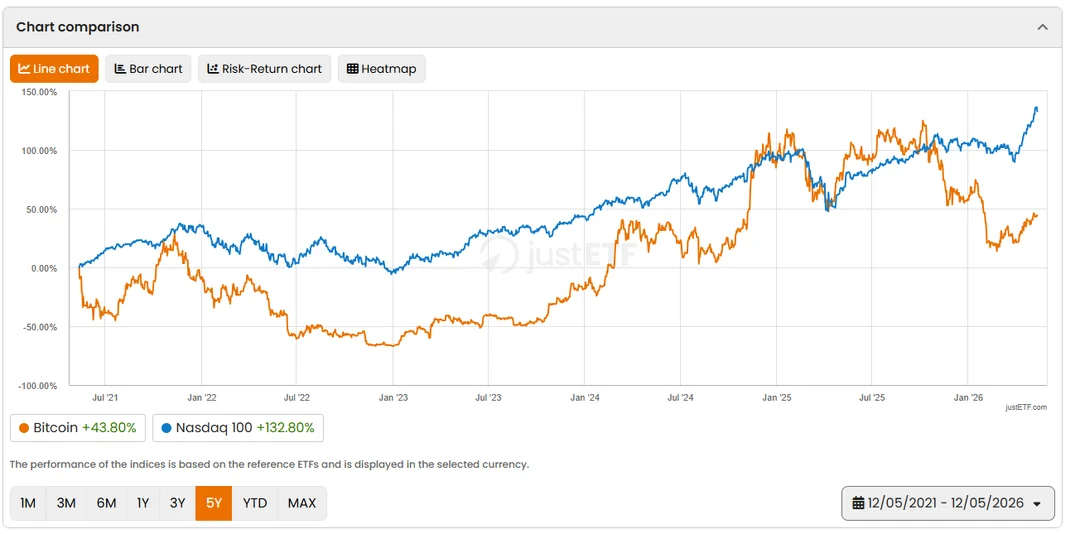
In today's crypto section on Reddit, one post has even personified this sentiment. A user posted a comparison chart showing that over the past 5 years, the Nasdaq 100 has risen 132.8%, while Bitcoin has only increased by 43.8%.
It's important to note that this chart uses the European DD/MM/YYYY date format. The actual window is from May 12, 2021, to May 12, 2026, and is based on a Euro-denominated ETF.
From 2021 to the present, the U.S. dollar has appreciated by approximately 18% against the Euro. From a Euro perspective, the gains of U.S. dollar-denominated assets are further amplified by this exchange rate effect. Converted to the naked dollar value, the Nasdaq 100's increase over the same period is about 121%, while Bitcoin's is about 43%. The gap remains significant.
The original poster's summary struck an even more painful chord, "What's going on? I guess the answer is that AI changed everything."
Bloomberg also ran a similar report in February of this year, with an even more blunt headline: "Bitcoin's Five-Year Returns Underperform S&P 500, Nasdaq 100, and Gold."
Investing Has an Expiry Date
The 5-year window for the chart above starts in December 2021.
At that time, Bitcoin had just fallen from its cycle high of $69,000 to around $48,000, while the Nasdaq 100 was at about 16,300 points, and the AI narrative had yet to begin. This means the starting line for Bitcoin was set on a high plateau at the end of a bull market, while the starting line for the Nasdaq was set on the eve of a super-cycle in AI.
Emotionally, it's understandable to promote U.S. stocks as being stronger than BTC; but is it really true when you stretch the data out a bit longer? If you shift the starting point forward or backward by a few months or years, the outcome of the contest flips dramatically.
We conducted a simple small statistical analysis. In the following five time windows, the endpoint is uniformly set to May 2026 (BTC ~$80,000, Nasdaq 100 ~29,000 points). The starting points correspond to five key nodes in the crypto and macro markets:
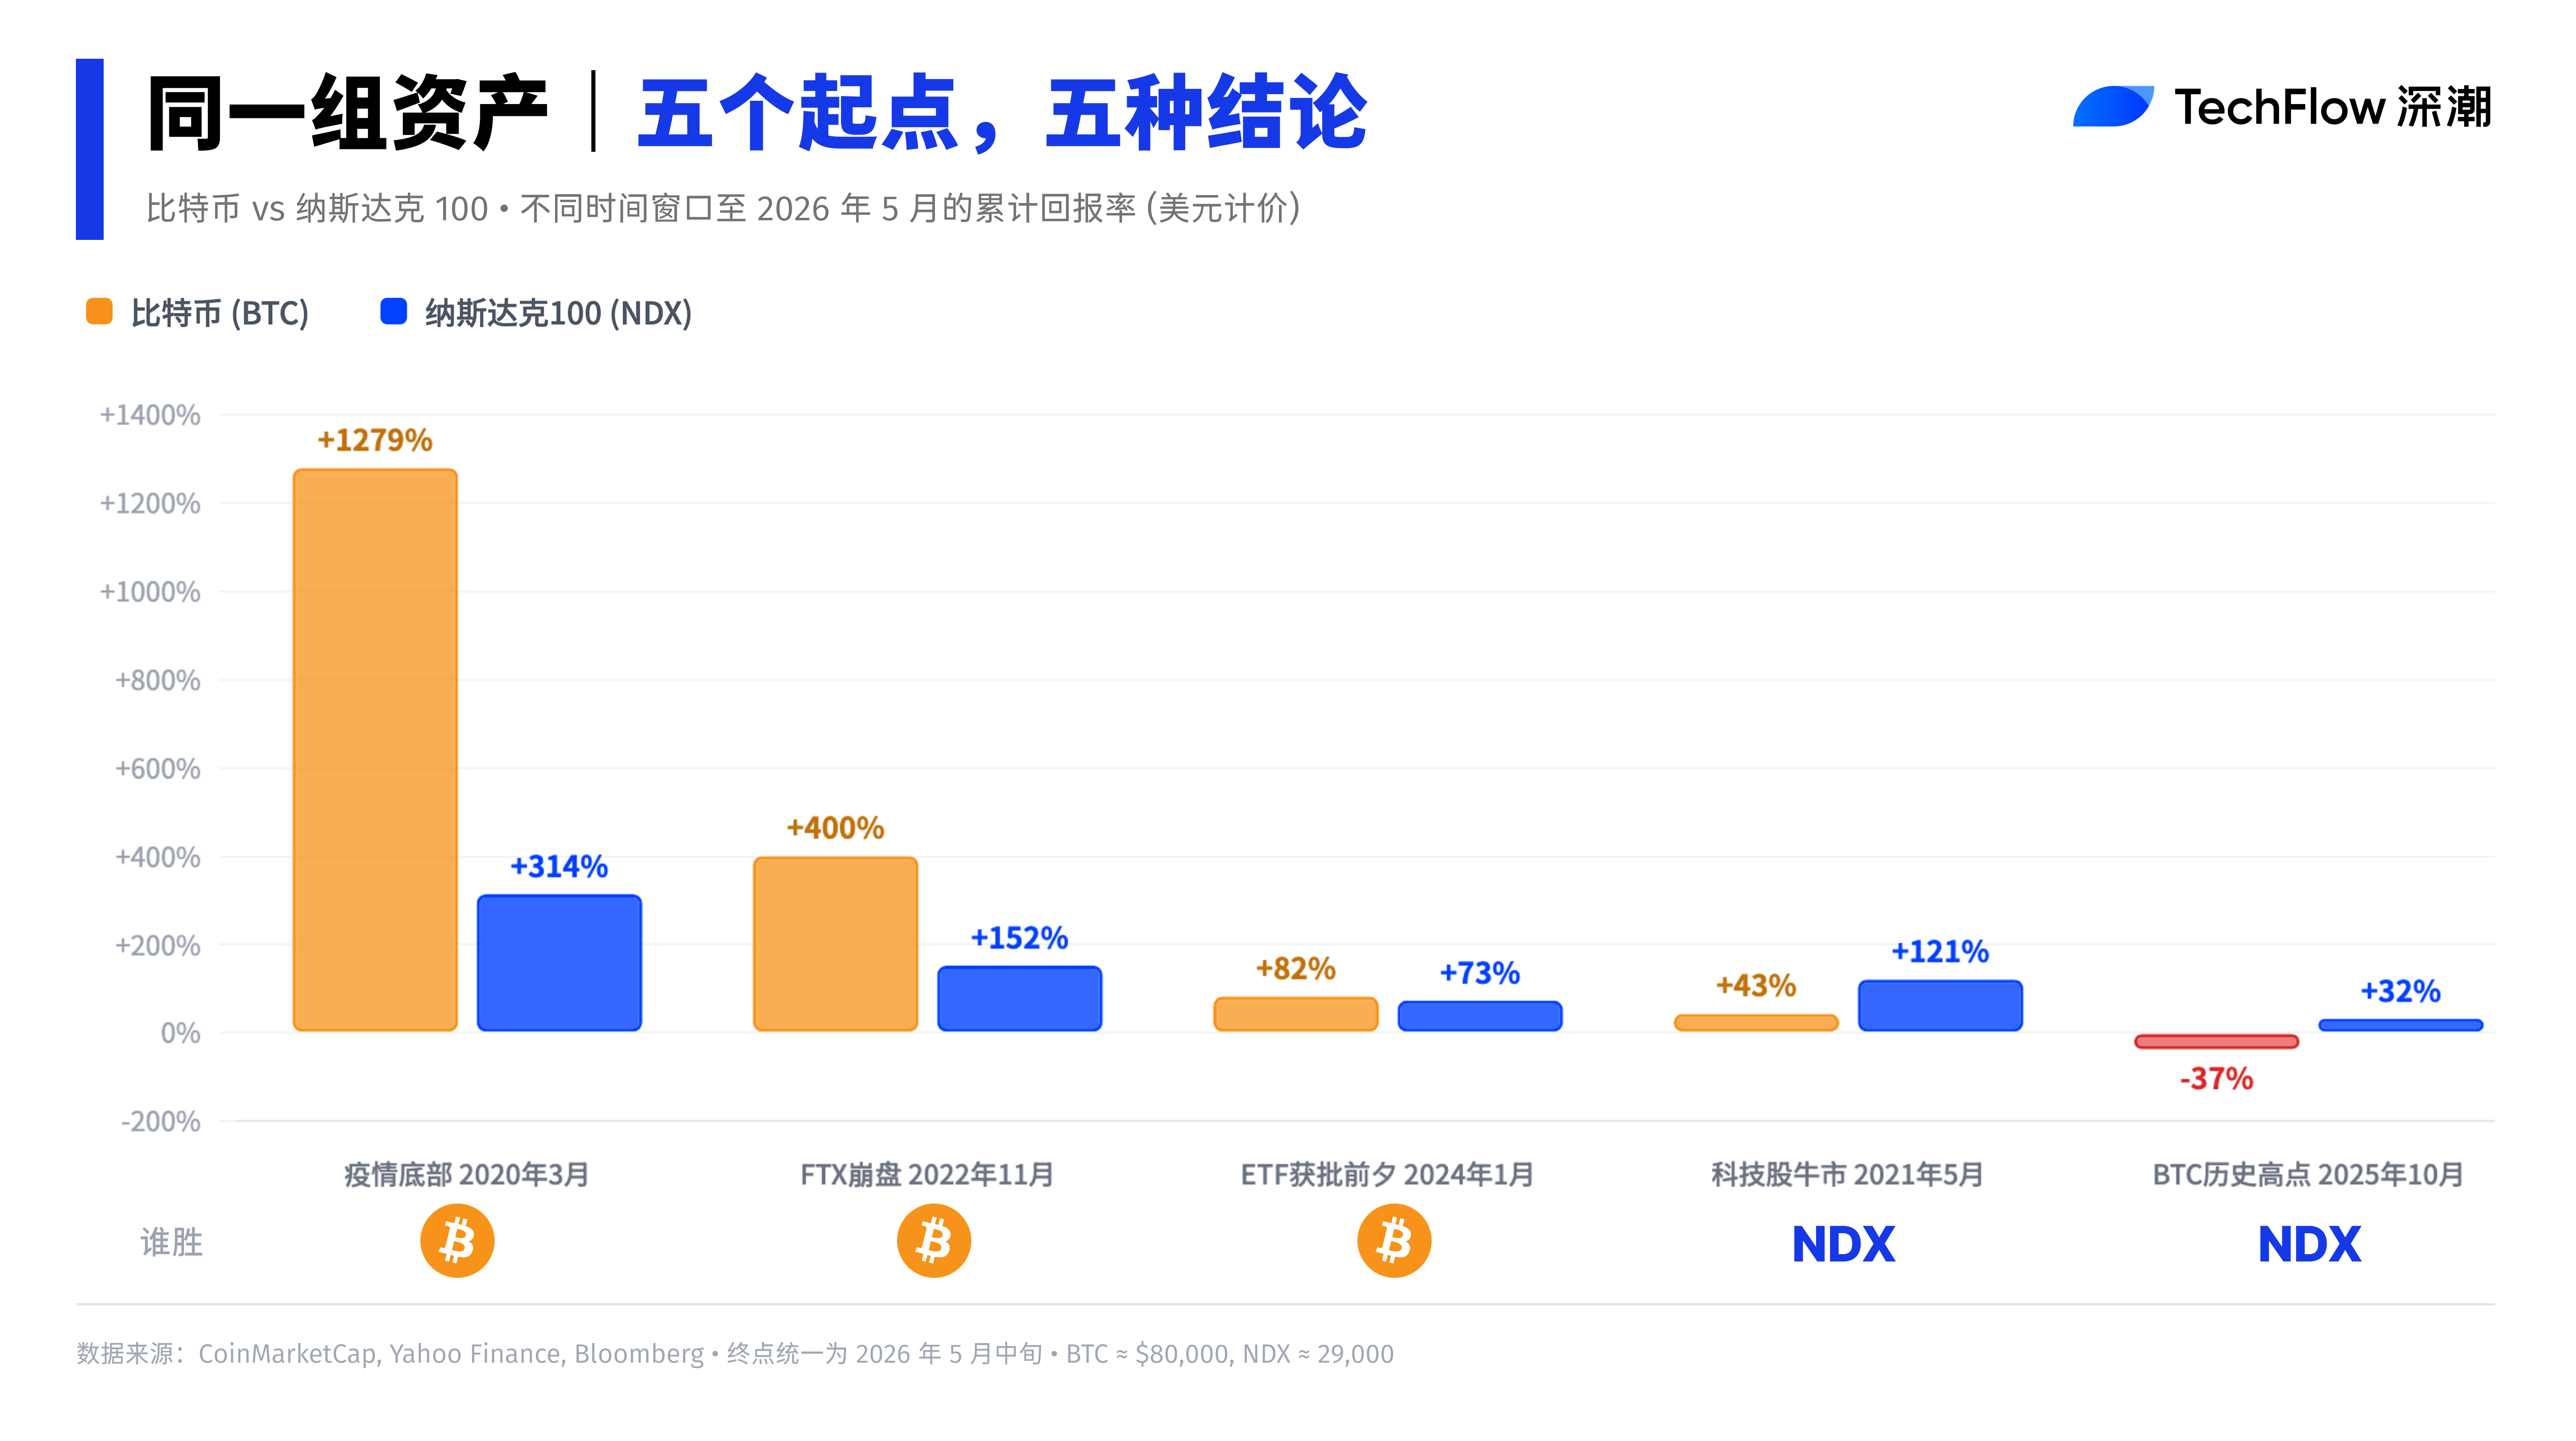
Pandemic Bottom (March 2020) → Present:
Bitcoin rose from about $5,800 to $80,000, a gain of approximately 1,279%. The Nasdaq 100 rose from about 7,000 points to 29,000 points, a gain of approximately 314%. Bitcoin's return is over 4 times that of the Nasdaq.
FTX Collapse Bottom (November 2022) → Present:
Bitcoin rose from about $16,000 to $80,000, a gain of approximately 400%. The Nasdaq 100 rose from about 11,500 points to 29,000 points, a gain of approximately 152%. Bitcoin's return is still 2.6 times that of the Nasdaq.
Eve of Bitcoin ETF Approval (January 2024) → Present:
Bitcoin rose from about $44,000 to $80,000, a gain of approximately 82%. The Nasdaq 100 rose from about 16,800 points to 29,000 points, a gain of approximately 73%. They are roughly neck-and-neck, with Bitcoin slightly ahead.
Current Cycle for Tech Stocks (May 2021) → Present:
Bitcoin rose from about $48,000 to $80,000, a gain of approximately 67%. The Nasdaq 100 rose from about 16,300 points to 29,000 points, a gain of approximately 78%. The Nasdaq is in the lead.
Bitcoin All-Time High (October 2025) → Present:
Bitcoin fell from about $126,000 to $80,000, a decline of approximately 37%. The Nasdaq 100 rose from about 22,000 points to 29,000 points, a gain of approximately 32%. The Nasdaq is significantly ahead, and the direction is completely opposite.
So the conclusion is: out of five windows, Bitcoin wins in three, and the Nasdaq wins in two. The window chosen by the Reddit post happens to be one of the most favorable for the Nasdaq.
Cyclical Assets vs. Trend Assets
The difference in sensitivity to starting points between Bitcoin and the Nasdaq 100 stems from their fundamentally different volatility structures.
The Nasdaq 100 is composed of 500 large, non-financial corporations, backed by cash flow and earnings, exhibiting a long-term upward trend. Even after experiencing a 33% drawdown in 2022, its recovery has been relatively steady.
Choosing almost any non-extreme starting point yields long-term returns within a relatively stable range.
Bitcoin, on the other hand, is a quintessential cyclical asset. Historically, every bull-bear cycle has seen peak-to-trough drawdowns between 75% and 85% (as seen in 2014, 2018, and 2022). The pullback from October 2025 to early 2026 has also reached about 50%.
This dramatic volatility means that where the starting point falls within the cycle almost entirely determines the final return figure.
An analysis on Nasdaq.com put it more bluntly: Bitcoin is essentially a leveraged version of the S&P 500.
In 2024, the S&P rose 24%, Bitcoin rose 135%; in 2023, the S&P rose 26%, Bitcoin rose 147%; in 2022, the S&P fell 19%, Bitcoin fell 65%. The direction is the same, but the magnitude is amplified by 3 to 5 times.
This implies that choosing a starting point precisely at the top of a Bitcoin cycle to conclude that "stocks outperform Bitcoin" is statistically almost inevitable. The reverse is also true.
BTC Currently Might Be in a 'Cyclical Undervaluation Zone'
Leaving aside the starting point game, the current market structure itself warrants attention.
After peaking in October 2025, Bitcoin underwent a classic cyclical correction. In February 2026, it briefly fell to around $65,000 before rebounding to roughly $80,000, still about 37% below its high. Meanwhile, the Nasdaq 100 has been hitting new highs, fueled by continued expansion in AI capital expenditure.
This divergence is not uncommon historically. During Bitcoin's rally from $3,000 to $12,000 in 2019, it was largely decoupled from the S&P 500. In 2022, both fell sharply together, with their correlation briefly spiking to 0.92. The correlation between the crypto market and U.S. stocks is dynamic and cyclical, not a fixed positive correlation.
Alex Thorn, Head of Research at Galaxy Digital, offered an interesting perspective in December 2025:
If measured by 2020 dollar purchasing power, the nominal high of $126,000 for Bitcoin actually never exceeded $100,000. Cumulative inflation from 2020 to 2025 has been about 24%. This introduces a systematic bias to any nominal price comparisons made across different years.
At a time when Bitcoin is 37% below its all-time high and U.S. stock indices are simultaneously setting new record highs, the narrative that "stocks outperform Bitcoin" naturally dominates social media.
But historically, each time this narrative has been loudest, it has also typically marked the bottom area of a Bitcoin cycle. Following the FTX collapse in late 2022, similar "Bitcoin is dead" rhetoric was rampant, only for Bitcoin to surge from $16,000 to $126,000 in the following 18 months.
Monday morning quarterbacking is easy; placing a bet ahead of time is hard. Arguing over which asset has performed better has no micro-level significance. Any conclusion that "A is always superior to B" drawn from a single time window cannot withstand the test of shifting the starting point.
Each era has its champion, but through generations, the real challenge remains timing and taking profits.


