
159加密协议实测:除了Hyperliquid,有回购机制的代币都在亏钱
- Core Insight: Revenue scale is the key determinant of token returns, rather than the value accrual mechanism itself; protocols with average daily revenue exceeding $500,000 deliver average returns superior to those with no revenue, revealing that the market actually rewards business fundamentals rather than mechanism design.
- Key Elements:
- Protocols with active value accrual (49 tokens) posted an average one-year return of -55%, while pure governance tokens (48 tokens) saw -65%, but the gap narrows after excluding top-performing projects.
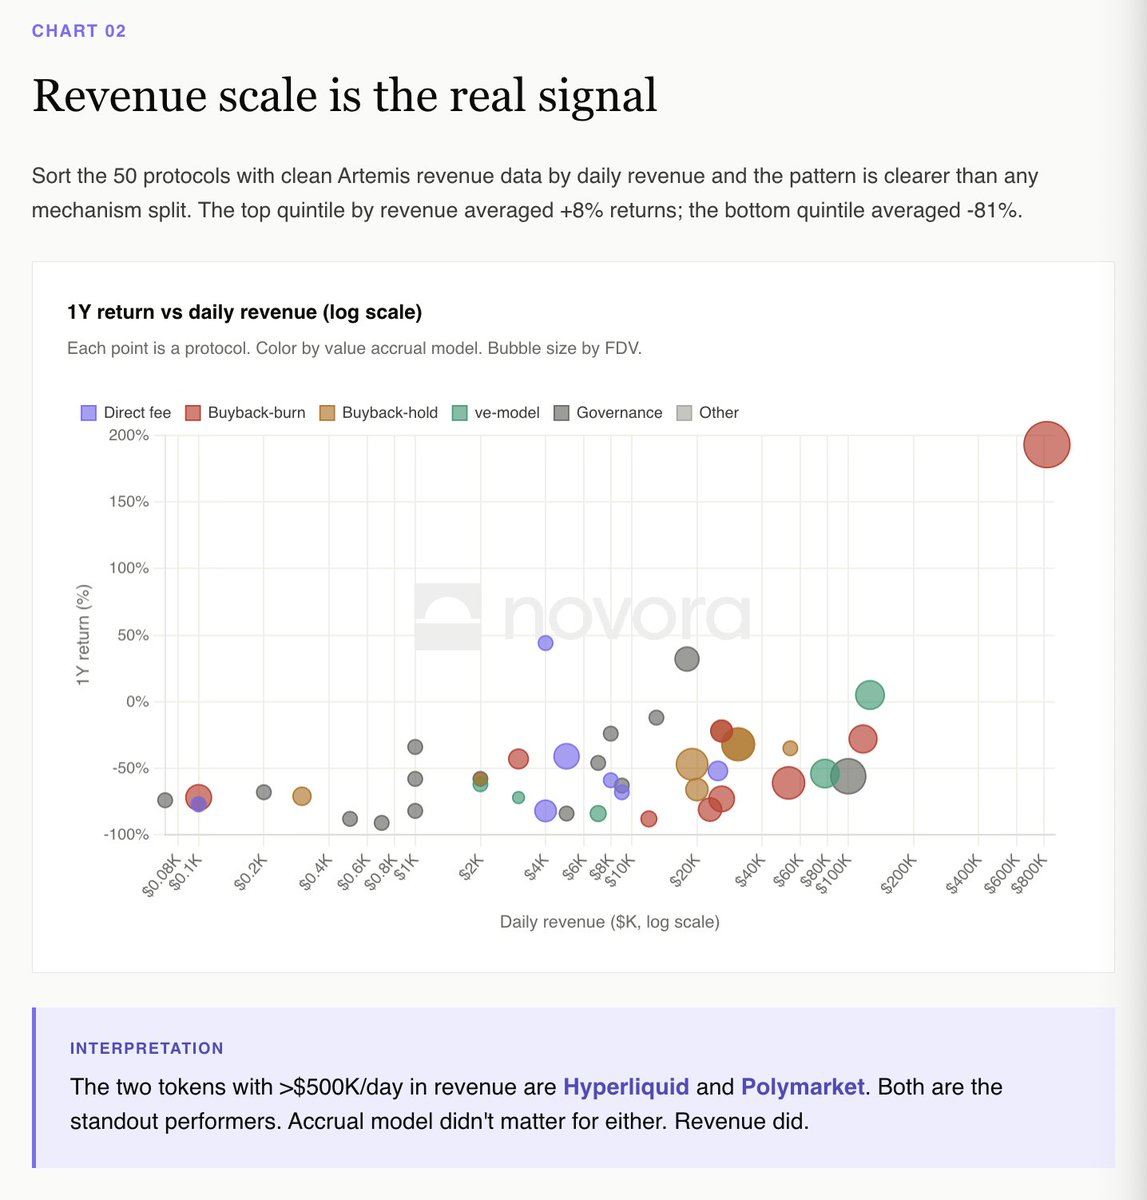
- The top quintile of protocols by daily revenue achieved an average return of +8%, whereas the bottom quintile recorded -81%; revenue scale is a more predictive factor than mechanism classification.
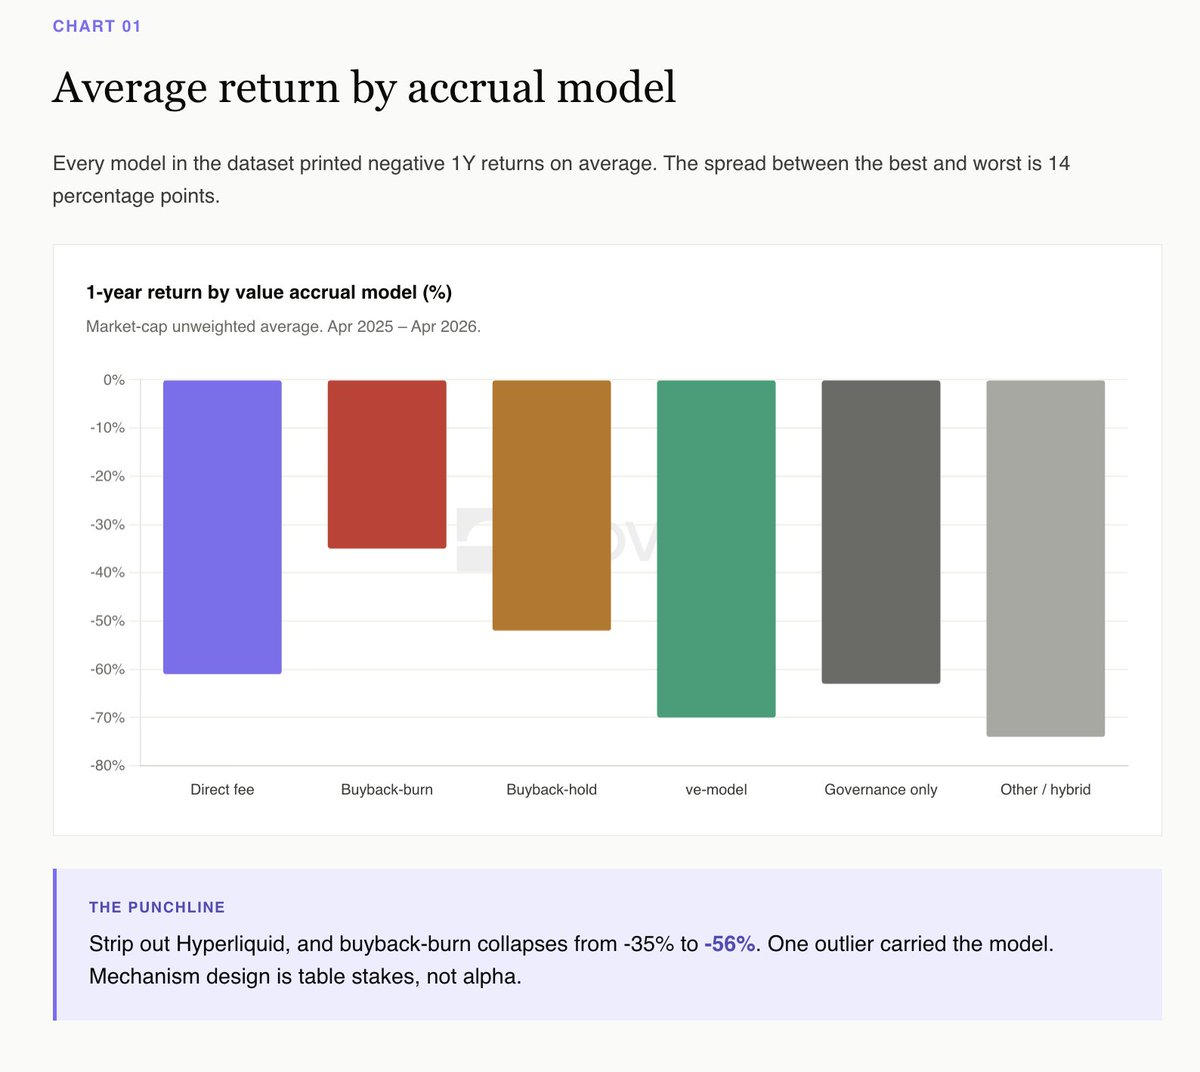
- The buyback and burn category averaged a return of -35%, but drops to -56% after excluding Hyperliquid (+193%), indicating data is significantly skewed by a single project.
- The only ve-model token with a positive return, Aerodrome (+5%), relies on the continuous influx of the Base ecosystem; other ve-tokens registered declines ranging from -54% to -84%.
- The hybrid category (including 62 tokens such as point programs, RWAs, and memecoins) posted an average return of -71%, where the lack of cash flow support led to price collapses after airdrop unlocks.
- Among 135 protocols with available data, only five posted positive returns over the past year, with a median return of -66%.
Original Author: Connor King
Original Translation: TechFlow
Key Takeaway: This article tested six token value accrual mechanisms across 159 protocols, finding that revenue scale matters more than mechanism design—protocols with daily revenue over $500,000 averaged +8% returns, while the bottom quintile averaged -81%. More critically, many seemingly "winning" mechanisms reverse immediately when one or two top projects are removed, offering direct insights for investors selecting tokens.
We mapped six value accrual mechanisms across 159 tokens and tested which ones actually translate into returns for token holders.
Most of the narratives around token value accrual in the crypto industry are wrong.
Research Setup
Two weeks ago, we published the "2026 Investor Relations and Token Transparency" report. One of the findings: 38% of crypto protocols have active value accrual, while 62% return no value to token holders.
This article is a companion analysis. We took a dataset of 159 protocols, classified each token by its accrual mechanism, and pulled 1-year price performance from Artemis. The question: which mechanisms actually translate into returns?
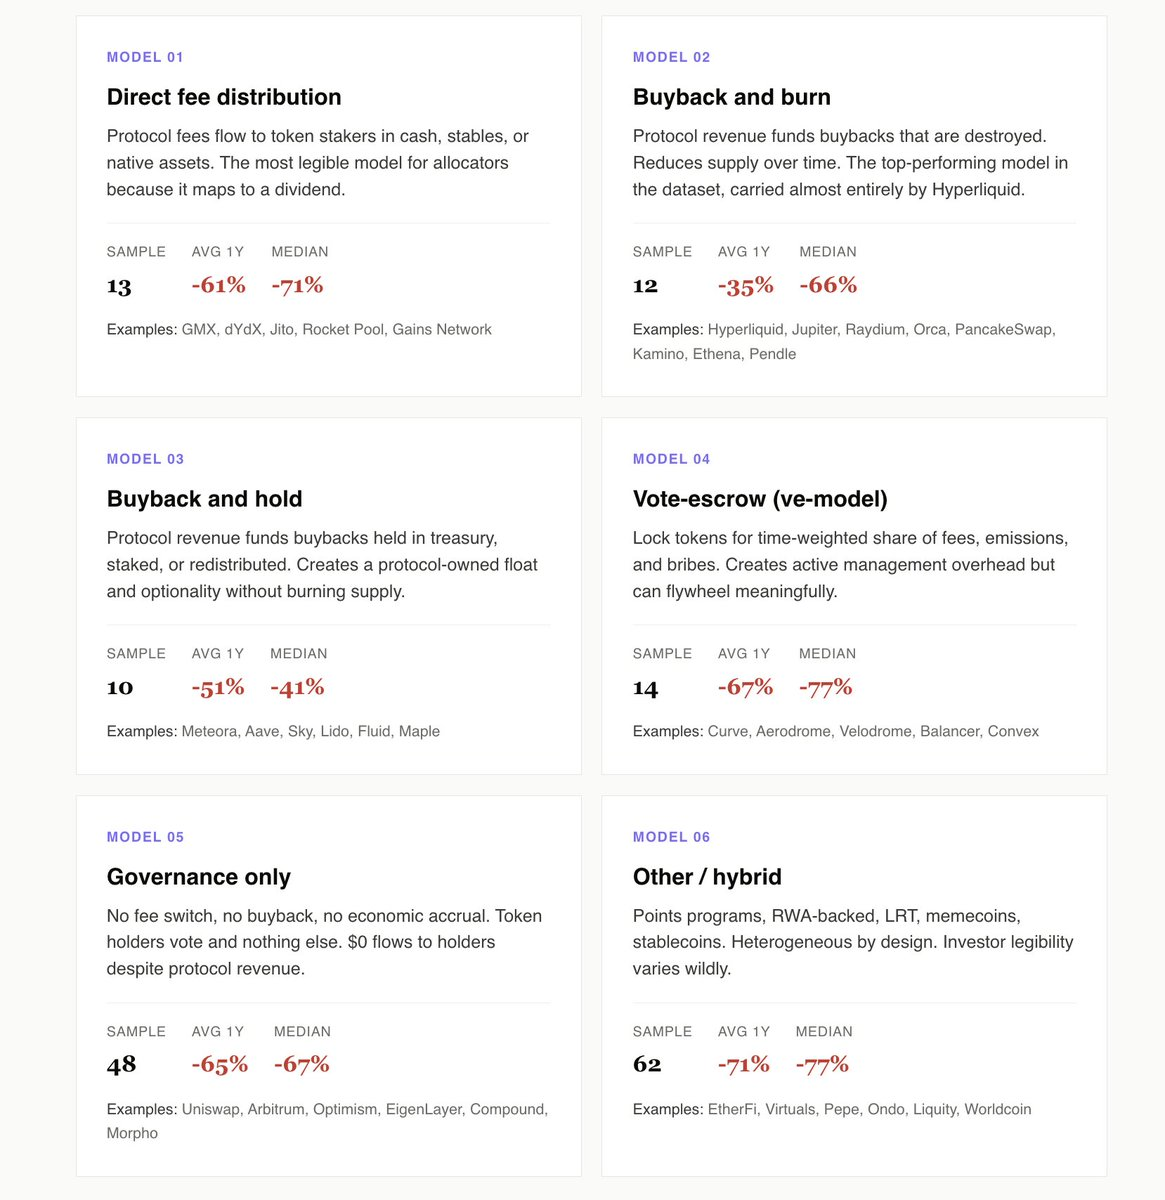
We identified six models: Direct Fee Distribution, Buyback & Burn, Buyback & Hold, Vote-Escrow (ve Model), Pure Governance, and Other/Hybrid.
Here’s what we found:
Active Accrual Outperforms Pure Governance by 10 Percentage Points
The 49 protocols using Direct Fees, Buyback & Burn, Buyback & Hold, and ve Models posted an average return of -55% over the past year. The 48 pure governance protocols averaged -65%.
When limiting the scope to revenue-generating pure governance tokens like Uniswap, Arbitrum, and Morpho, the gap widens further. These protocols generate real revenue but distribute none of it to token holders. The opportunity cost is the most glaring element in the dataset.
Pure governance is the investor relations equivalent of a publicly traded company that neither pays dividends nor buys back stock. Eventually, allocators stop pretending it's a going concern and start pricing it as an option on management waking up.
Hyperliquid *Is* the Buyback & Burn Category
On the surface, Buyback & Burn won this year (averaging -35%), with Buyback & Hold coming in second (-52%). This looks like a clean win for burning.
But the story flips when you exclude Hyperliquid. Removing HYPE, Buyback & Burn averages -56%, and Buyback & Hold averages -52%. One token defines the entire category.
Meteora is the cleanest Buyback & Hold case. A $10 million buyback program, a Novora investor relations score of 95/100, and transparent treasury accumulation. It’s down about 40% this year, below the category median. Holding repurchased tokens in a transparent treasury preserves optionality and creates a visible, auditable supply. Burning destroys optionality in exchange for a marketing headline.
Revenue Scale is the Real Signal
Sorting 50 protocols with clear Artemis revenue data by daily revenue reveals a pattern clearer than any mechanism classification.
Protocols in the top revenue quintile averaged +8% returns. The bottom quintile averaged -81%.
The two protocols with daily revenue over $500,000 are Hyperliquid and Polymarket. Both are standout performers in the dataset. Their accrual models differ, but their revenue trajectories are the same.
The dYdX Paradox vs. The Hyperliquid Paradox
Direct Fee Distribution is the most readable model for institutional allocators because it maps cleanly onto dividends. dYdX runs the textbook version: 100% of trading fees to stakers, 75% of net income buybacks, and best-in-class investor relations infrastructure.
dYdX fell 82% over the past 12 months. The mechanism worked exactly as promised, but the business did not.
Hyperliquid is the opposite. Buyback and burn via the aid fund (99% of fees), zero traditional investor relations infrastructure, annual return of +193%.
If you’re an allocator, this is the clearest read in the dataset: you’re buying a share of a protocol’s revenue, and if that revenue falls, the token will fall too. The mechanism is table stakes. The revenue trajectory is everything.
ve Models Require Perpetual Bribes to Function
Aerodrome is the only ve-model token with a positive 1-year return (+5%) in the dataset. Its mechanism relies on inflows from the Base ecosystem to sustain the bribe market.
Velodrome, Curve, Balancer, and every smaller ve fork fell between -54% and -84%. The ve flywheel works, but it requires continuous new capital. When capital stops flowing in, the entire structure collapses.
This isn’t a criticism of the model. It’s an acknowledgment that ve tokens are leveraged bets on ecosystem inflows, not necessarily bets on pure protocol fundamentals.
Hybrid Category Averages -71%
Points programs, RWAs, LRTs, memecoins, stablecoins. 62 protocols. The most heterogeneous category in the dataset. Average 1-year return: -71%.
This is the final destination for most projects launched in 2024-2025: EtherFi, Renzo, Puffer, Usual, Virtuals, AI16Z, the entire LRT cohort, the memecoin cohort. These tokens trade on narrative and TGE airdrop activity, not on cash flow mechanisms. Once the airdrop unlocks are complete, there’s nothing left to support the price.
Investor readability is the fundamental problem. An allocator cannot underwrite a token whose accrual mechanism depends on a future narrative.
The Big Picture
Average 1-year returns by accrual model:
Buyback & Burn: -35% (driven by Hyperliquid; -56% without HYPE)
Buyback & Hold: -52%
Direct Fee Distribution: -55%
Pure Governance: -65%
Vote-Escrow (ve Model): -67%
Other/Hybrid: -71%
Of the 135 protocols with verifiable performance data, 5 were positive over the past year. Median return: -66%.
What This Means
The market does not pay a premium for good mechanism design, but it does penalize tokens with no mechanism at all.
The clearest empirical read from 2025 is: value accrual did not generate excess returns; revenue did. But the 48 pure governance tokens in the dataset show the cost of having no mechanism. When the market chooses between a token that pays you and a token that doesn’t, it picks the one that pays.
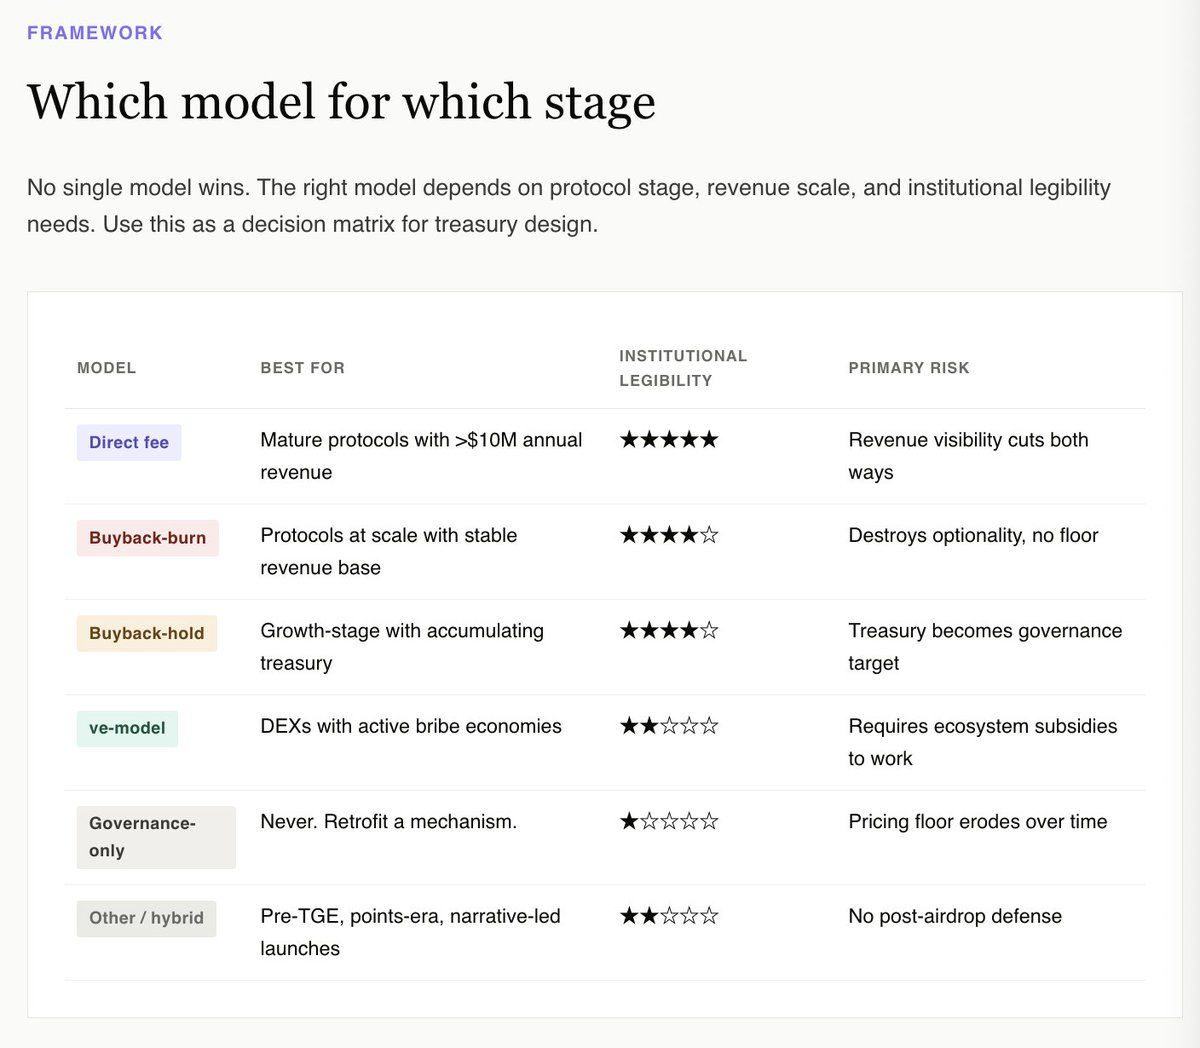
For treasuries, the right question isn’t which mechanism maximizes upside. The data suggests none reliably do. The right question is which mechanism makes this token look investable from an institutional allocator's fundamental perspective.
That perspective immediately rules out Pure Governance and Hybrid categories. It favors Buyback & Hold with transparent treasury disclosures, Buyback & Burn for scaled protocols (Hyperliquid), Direct Fee Distribution for mature revenue-generating protocols, and, for a narrow range of DEX-native tokens, ve models tied to active bribe markets.
For every other token, including most launched in the last 24 months, the honest answer is: retrofit a mechanism before the next unlock. Do it while you still have the option.
The full interactive report containing all 159 protocols and a filterable dataset is live:
https://www.novora.co/research/value-accrual-2026.html
This article is for informational purposes only and does not constitute financial, investment, or legal advice. All data has been verified against public sources as of April 2026. Novora may have advisory relationships with protocols mentioned in this report. Please always conduct your own research and consult qualified financial advisors before making investment decisions.


