
CoinW Research Weekly Report (March 30, 2026 - April 5, 2026)
- Core View: The cryptocurrency market this week showed a pattern of moderate overall gains but diverging on-chain activity. The total market cap grew by 3.37% to $2.45 trillion. However, daily transaction volumes on major public chains generally declined, with user activity and TVL performance varying. Market sentiment remains in the "Extreme Fear" zone.
- Key Elements:
- Market Indicators: The total cryptocurrency market cap rose by 3.37%. Bitcoin spot ETFs saw a net inflow of $22.34 million this week, while Ethereum spot ETFs experienced a net outflow of $71.17 million. The market fear & greed index stands at 14 (Extreme Fear).
- On-chain Data: Daily DEX volumes on major public chains generally fell, with BNB Chain (-32.65%) and Ton (-43.32%) showing significant declines. User activity diverged, with Solana's daily active addresses increasing by 8.34% to 4.036 million, while Aptos (-52.09%) and Ethereum (-10.54%) saw pullbacks.
- DeFi & Stablecoins: The total DeFi TVL increased by 1.89% to $94.524 billion, with Ethereum leading at a 57.03% share. The total stablecoin market cap decreased slightly by 0.39%, while USDC saw an issuance of 2.948 billion tokens.
- New Project Developments: Several innovative platforms emerged, such as the leveraged prediction trading platform OmenX, the Solana ecosystem Meme coin launch platform PumpCA, and the open prediction trading venue CADE Market.
- Industry Funding: RWA and stablecoin infrastructure attracted capital, e.g., The Better Money Company (stablecoin clearinghouse) secured $10 million in funding, and Valinor (on-chain private credit) raised $25 million.
Key Takeaways
The total global cryptocurrency market capitalization is $2.45 trillion, up approximately 3.37% this week from $2.37 trillion last week. As of press time, the cumulative total net inflow for U.S. Bitcoin spot ETFs is approximately $55.96 billion, with a net inflow of $22.34 million this week; the cumulative total net inflow for U.S. Ethereum spot ETFs is approximately $11.48 billion, with a net outflow of $71.17 million this week.
The total stablecoin market capitalization is $309.9 billion, down about 0.39% from $308.7 billion last week. Among them, the market cap of USDT is $184.07 billion, accounting for 59.39% of the total stablecoin market cap, unchanged from last week; followed by USDC with a market cap of $77.5 billion, accounting for 25.0% of the total stablecoin market cap, down about 0.26% from $77.7 billion last week; the market cap of DAI is $5.36 billion, accounting for 1.75% of the total stablecoin market cap, unchanged from last week.
According to DeFiLlama data, the total DeFi TVL this week is $94.524 billion, up about 1.89% from $92.769 billion last week. Divided by public chain, the three public chains with the highest TVL are Ethereum, accounting for 57.03%; Solana, accounting for 6.85%; and BNB Chain, accounting for 5.69%.
On-chain data weakened overall this week. Daily on-chain DEX trading volume generally declined, with Solana still leading at $0.92B (-14.42%), while Ethereum ($0.563B, -22.88%), BNB Chain ($0.528B, -32.65%), and Ton ($0.0012B, -43.32%) saw relatively significant drops. Transaction fees were generally stable, with only Solana ($0.004) and Sui ($0.00164) rising by 28.77% and 38.51%, respectively. User activity diverged significantly, with Solana's daily active addresses reaching 4.036 million (+8.34%) continuing to lead, Sui (284k, +14.38%) growing compared to last week, while Aptos (-52.09%), Ethereum (-10.54%), and Ton (-6.45%) declined. In terms of TVL, Ethereum remained firmly in first place at $54.47B (+3.17%), BNB Chain ($5.38B, +2.75%) saw slight growth, while Solana ($5.57B, -11.88%) and Aptos ($0.269B, -8.19%) declined.
New Projects to Watch: OmenX is an innovative leveraged prediction trading platform where users can convert various real-world events (including sports matches, financial prices, technological achievements, etc.) into tradable prediction markets on-chain. PumpCA is a Meme coin issuance and trading platform based on the Solana ecosystem, positioning itself similarly to a "meme launchpad," with the core goal of allowing users to quickly create, issue, and trade their own tokens. CADE Market is an open prediction/trading venue that allows users to engage in price speculation and liquidity trading around various events, topics, or assets.
Table of Contents
Key Takeaways
I. Market Overview
1. Total Cryptocurrency Market Cap/Bitcoin Dominance
2. Fear & Greed Index
3. ETF Inflow/Outflow Data
4. ETH/BTC and ETH/USD Exchange Ratios
5. Decentralized Finance (DeFi)
6. On-Chain Data
7. Stablecoin Market Cap and Issuance
II. Hot Money Trends This Week
1. Top 5 Gaining VC Coins and Meme Coins This Week
2. New Project Insights
III. Industry News
1. Major Industry Events This Week
2. Upcoming Major Events Next Week
3. Important Fundraising Last Week
IV. Reference Links
I. Market Overview
1. Total Cryptocurrency Market Cap/Bitcoin Dominance
The global total cryptocurrency market cap is $2.45 trillion, up approximately 3.37% this week from $2.37 trillion last week.
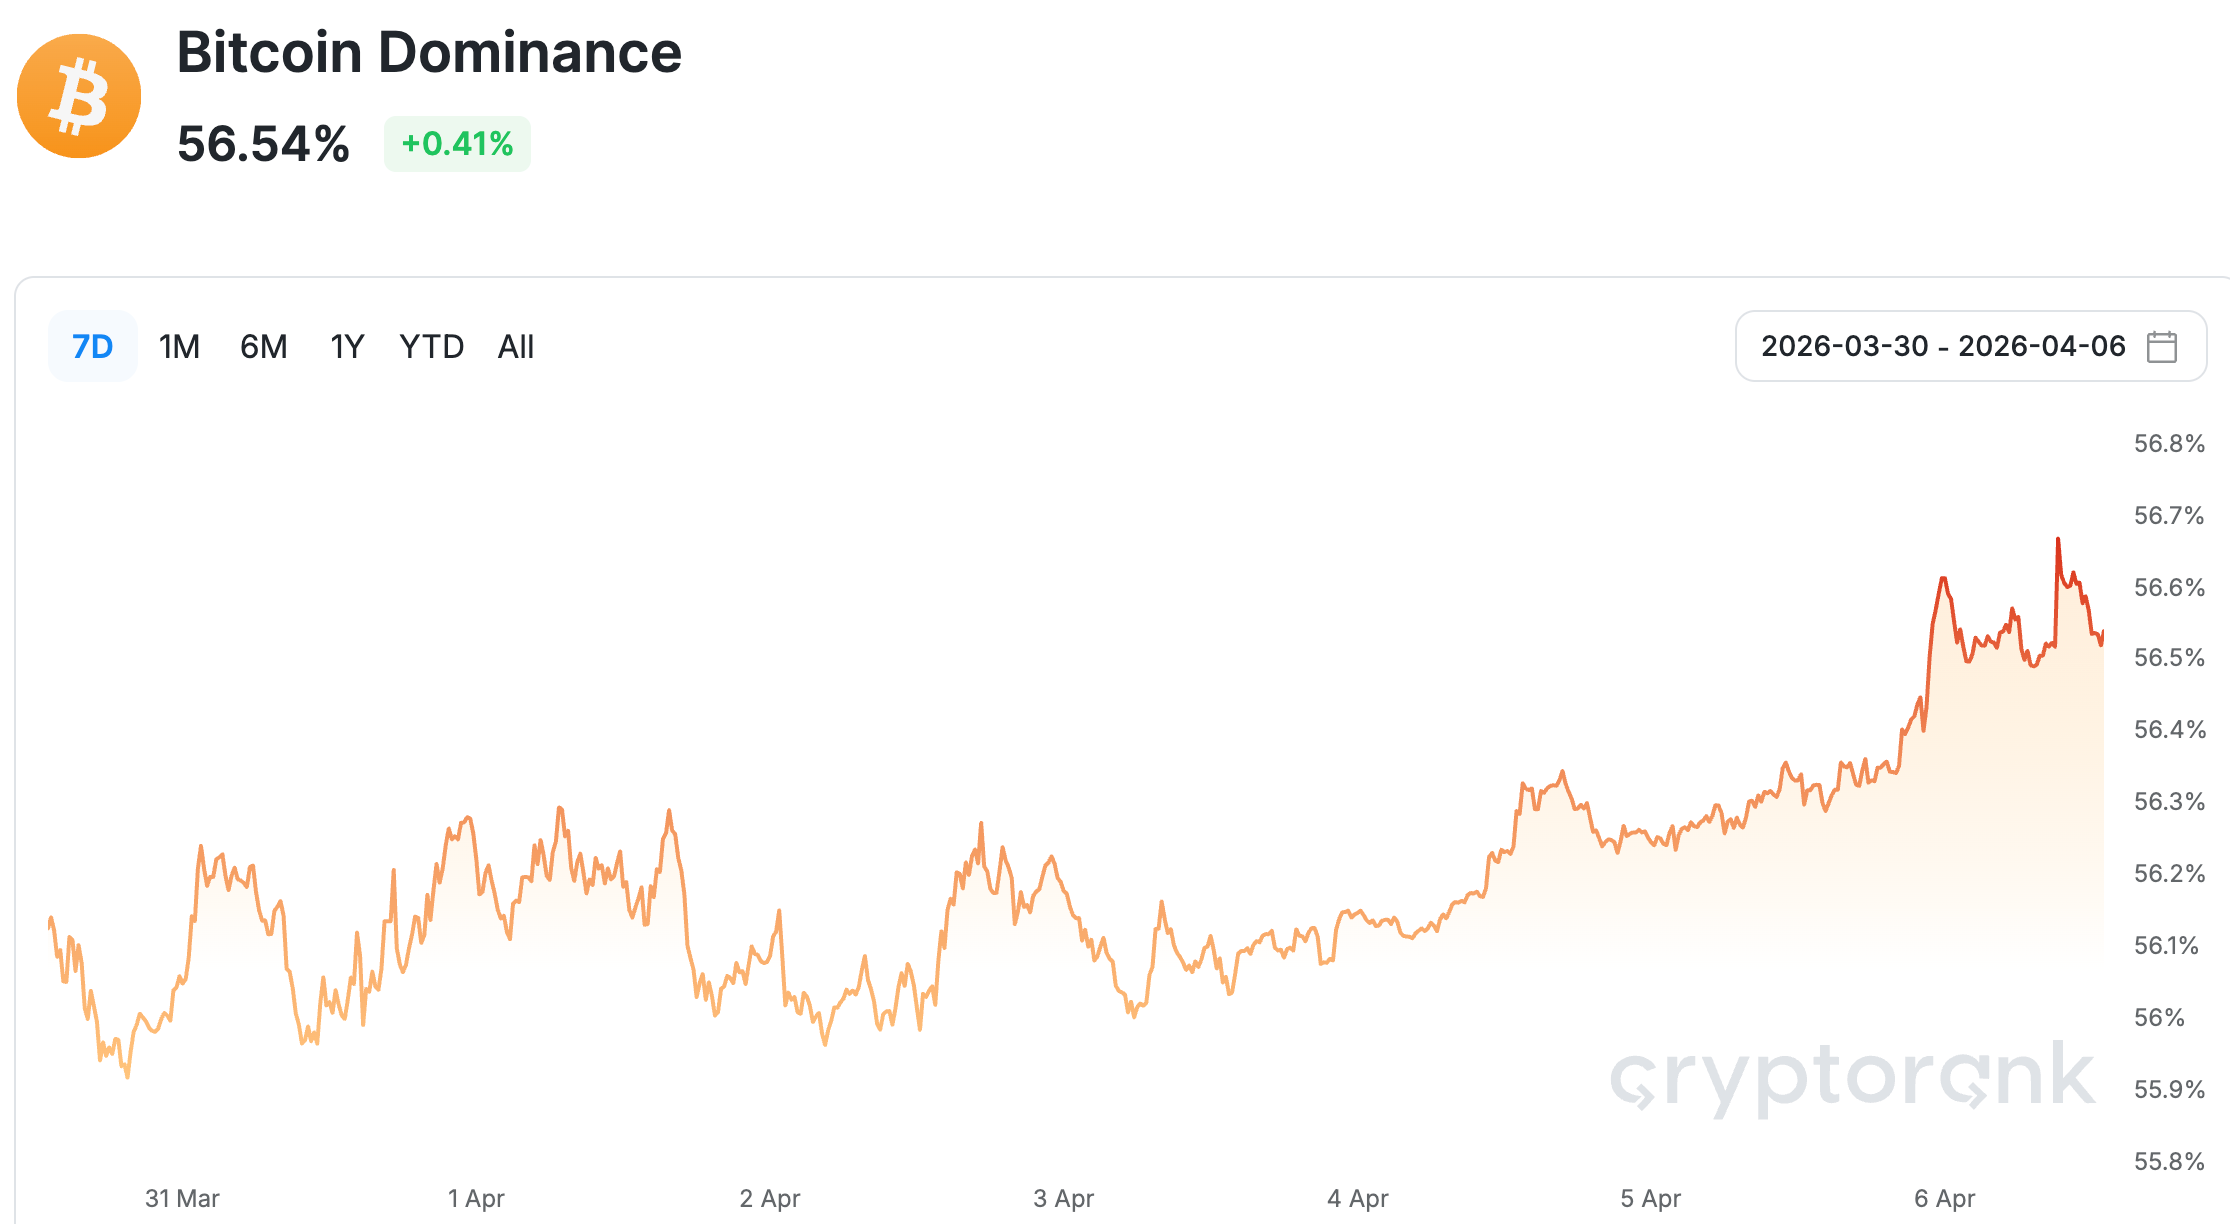
Data Source: Bitcoin dominance from cryptorank, https://cryptorank.io/charts/btc-dominance
Data as of April 5, 2025
As of press time, the market cap of Bitcoin is $1.38 trillion, accounting for 56.33% of the total cryptocurrency market cap. Meanwhile, the stablecoin market cap is $309.9 billion, accounting for 12.65% of the total cryptocurrency market cap.
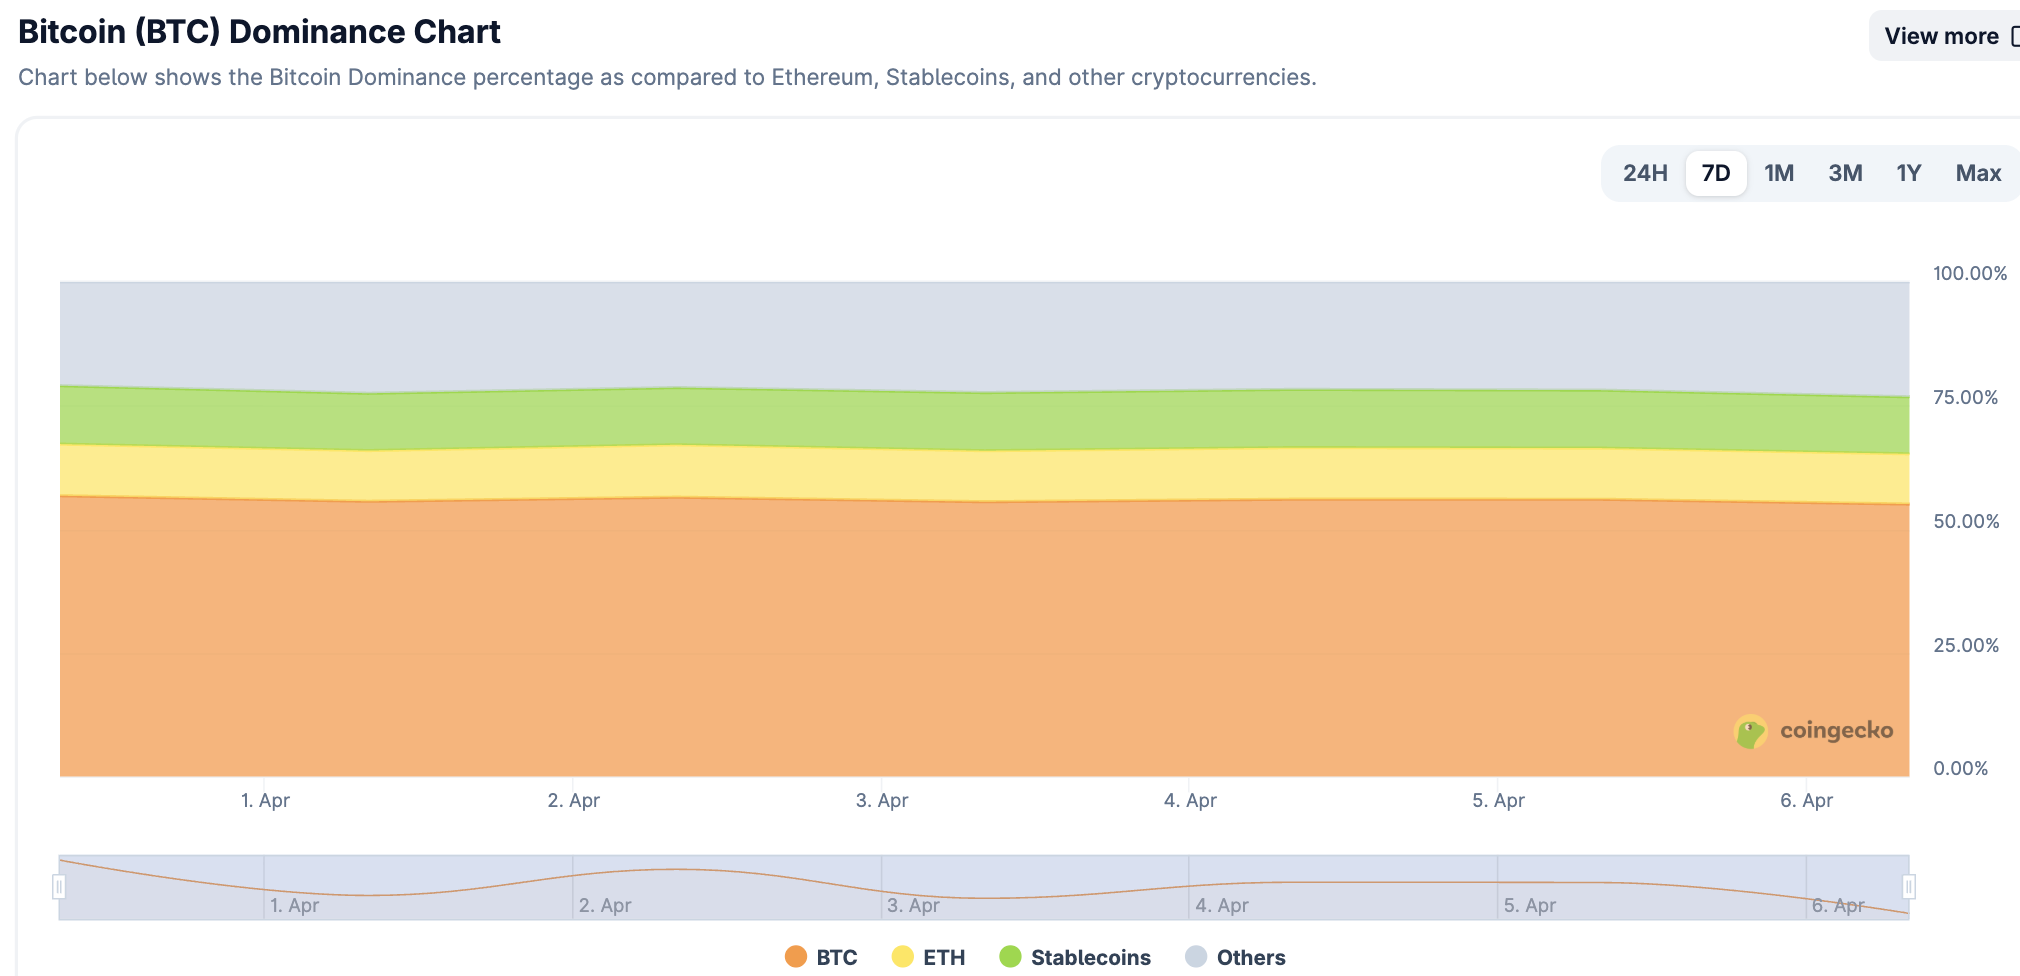
Data Source: coingecko, https://www.coingecko.com/en/charts
Data as of April 5, 2025
2. Fear & Greed Index
The Crypto Fear & Greed Index is 14, indicating Extreme Fear.
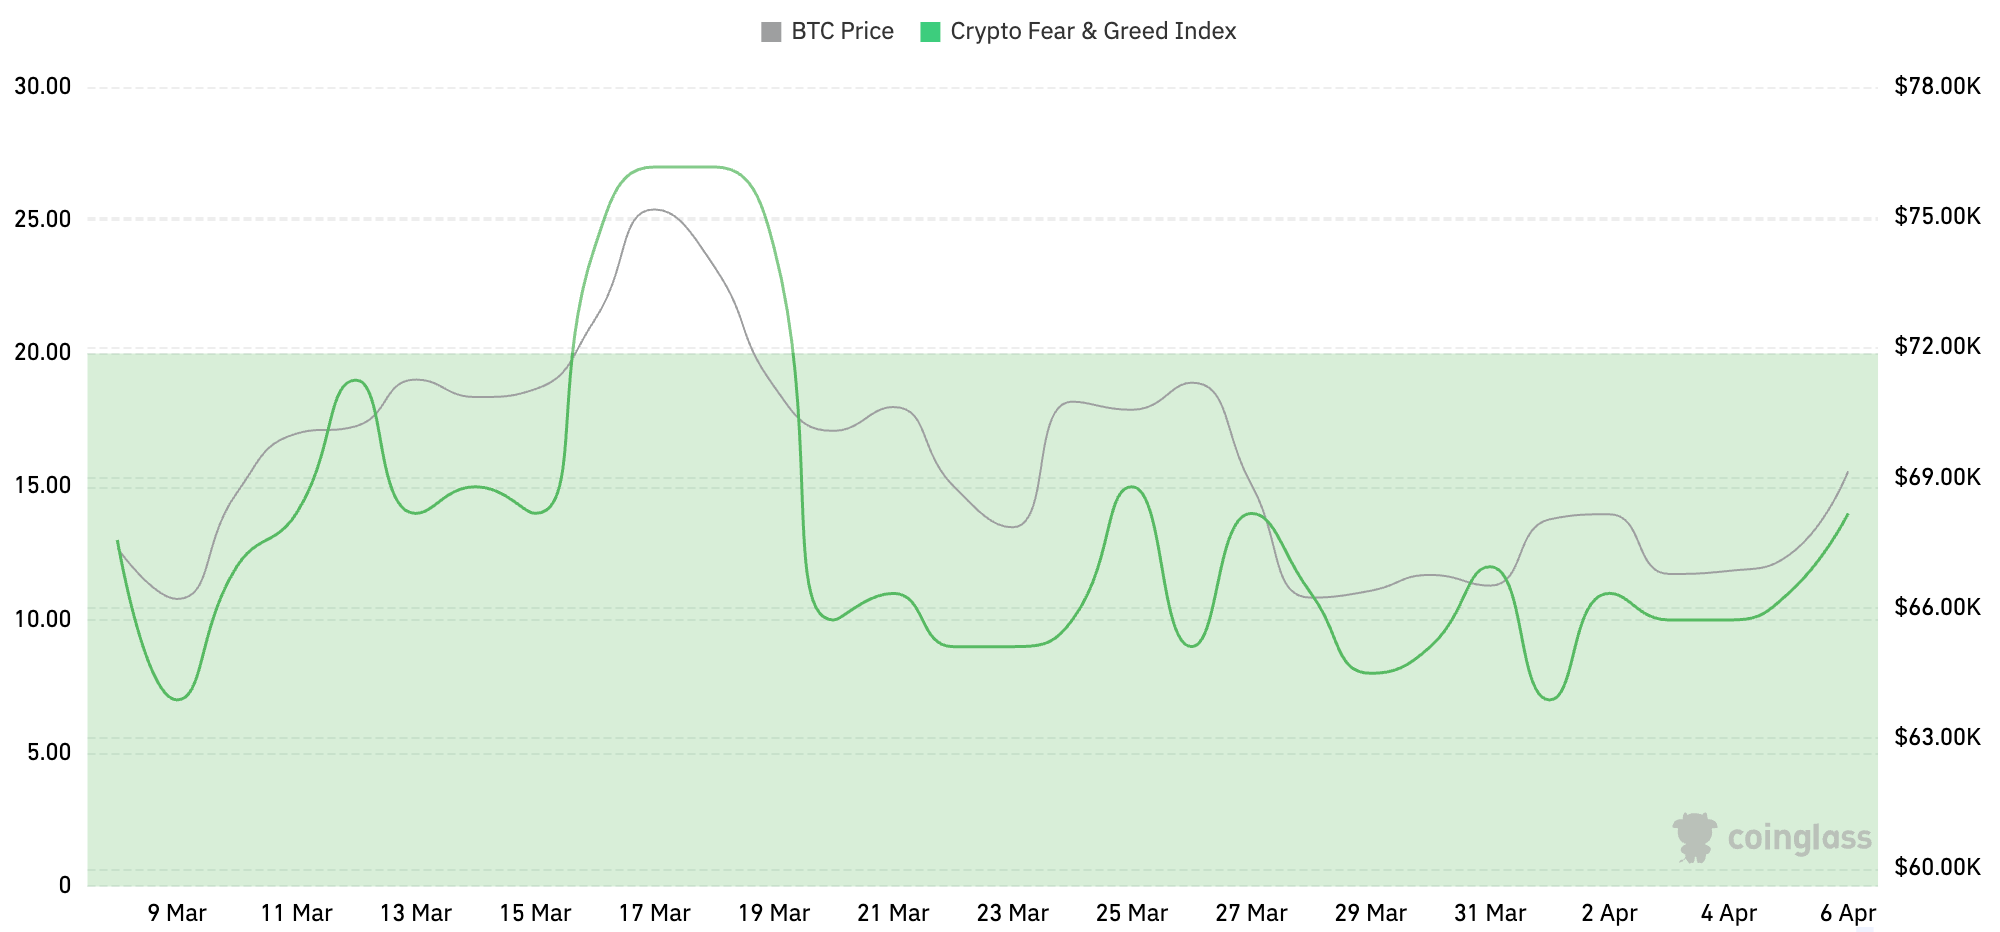
Data Source: coinglass, https://www.coinglass.com/pro/i/FearGreedIndex
Data as of April 5, 2025
3. ETF Inflow/Outflow Data
As of press time, the cumulative total net inflow for U.S. Bitcoin spot ETFs is approximately $55.96 billion, with a net inflow of $22.34 million this week; the cumulative total net inflow for U.S. Ethereum spot ETFs is approximately $11.48 billion, with a net outflow of $71.17 million this week.
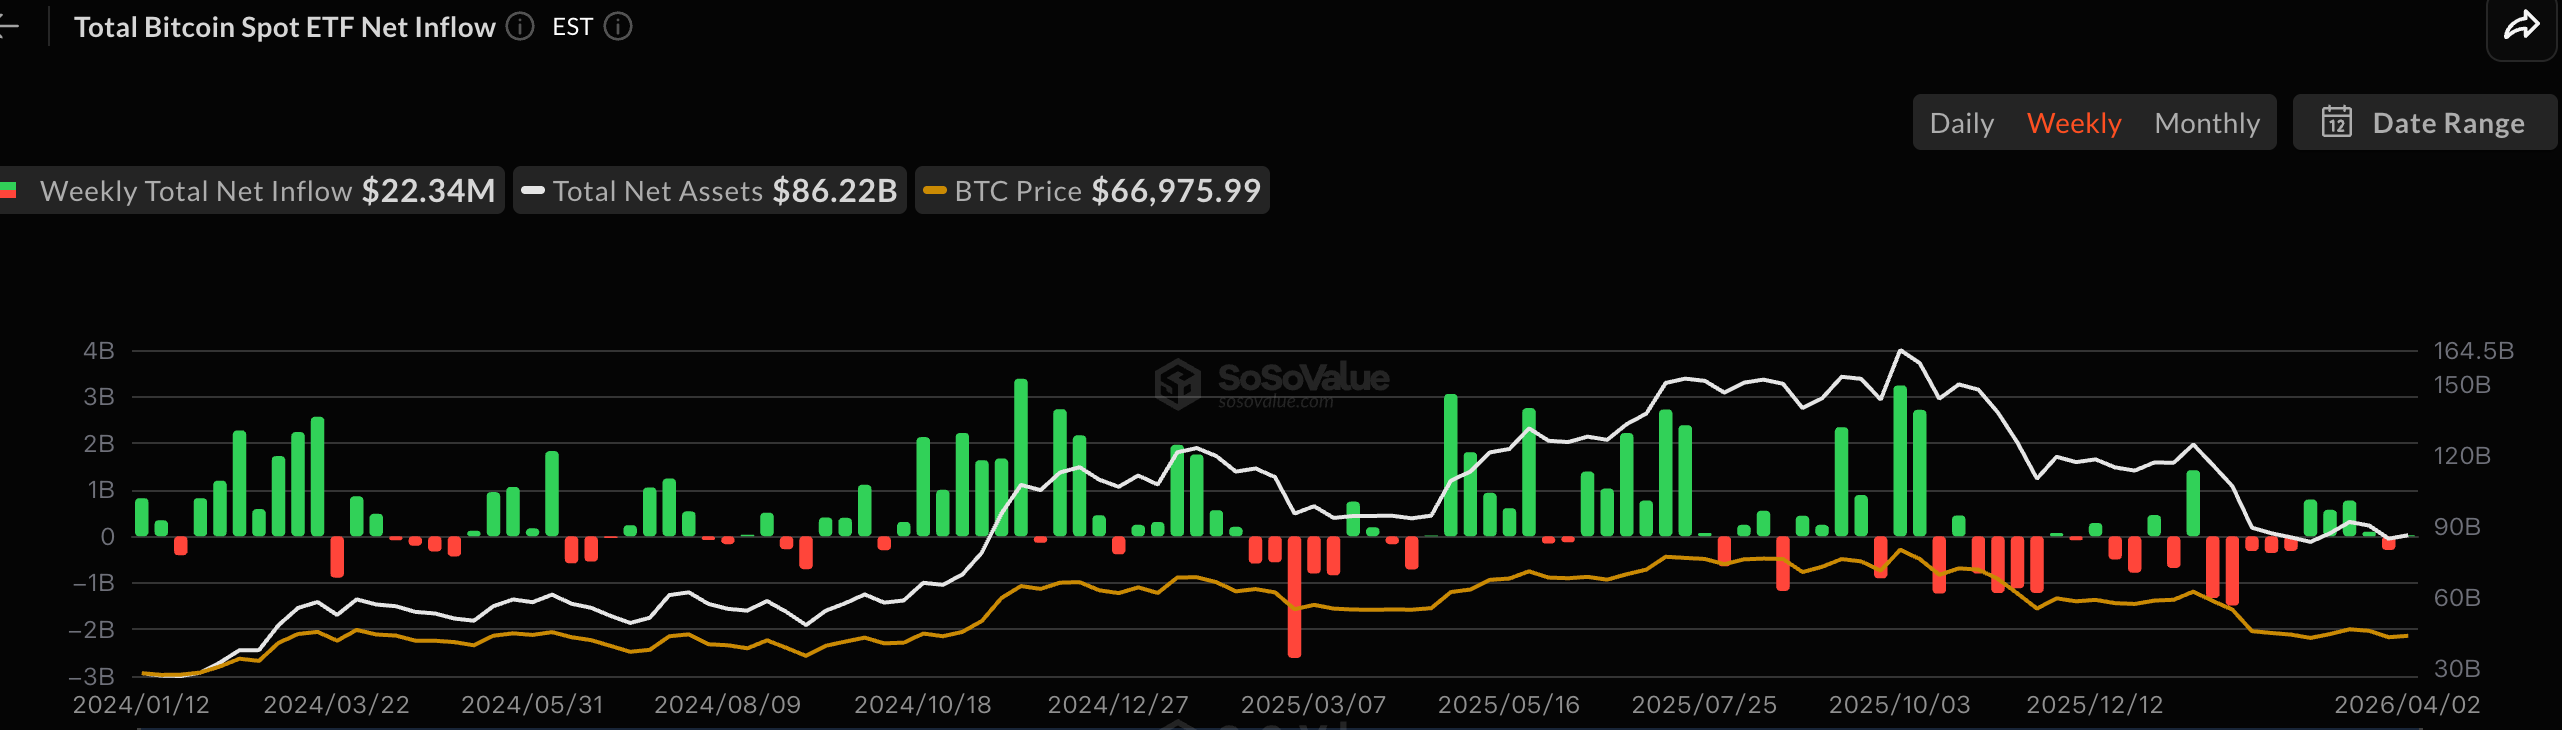
Data Source: sosovalue, https://sosovalue.com/zh/assets/etf
Data as of April 5, 2025
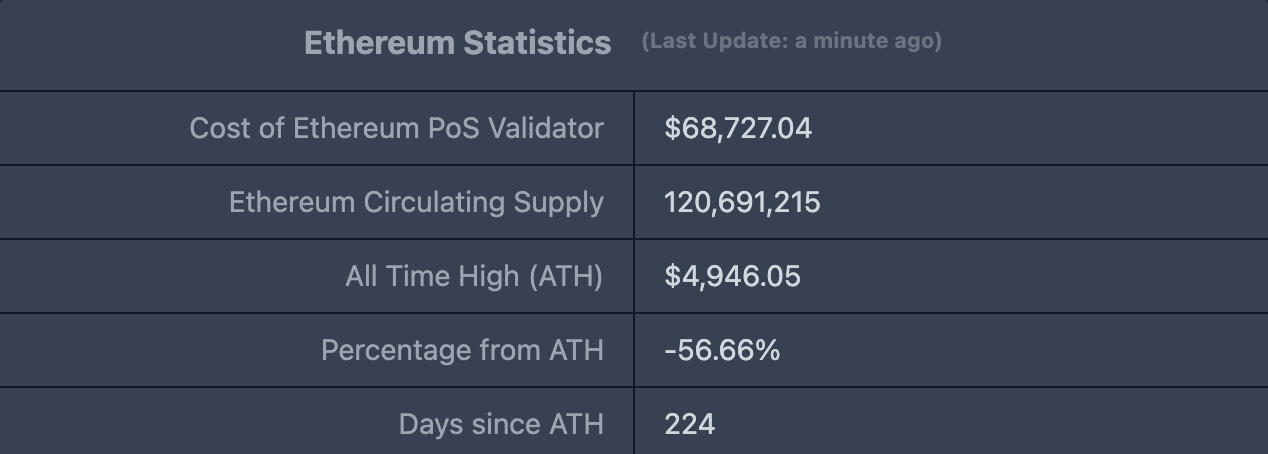
4. ETH/BTC and ETH/USD Exchange Ratios
ETHUSD: Current price $2,146.74, all-time high $4,946.05, down approximately 56.66% from ATH.
ETHBTC: Currently 0.030917, all-time high 0.1238.
Data Source: ratiogang, https://ratiogang.com/
Data as of April 5, 2025
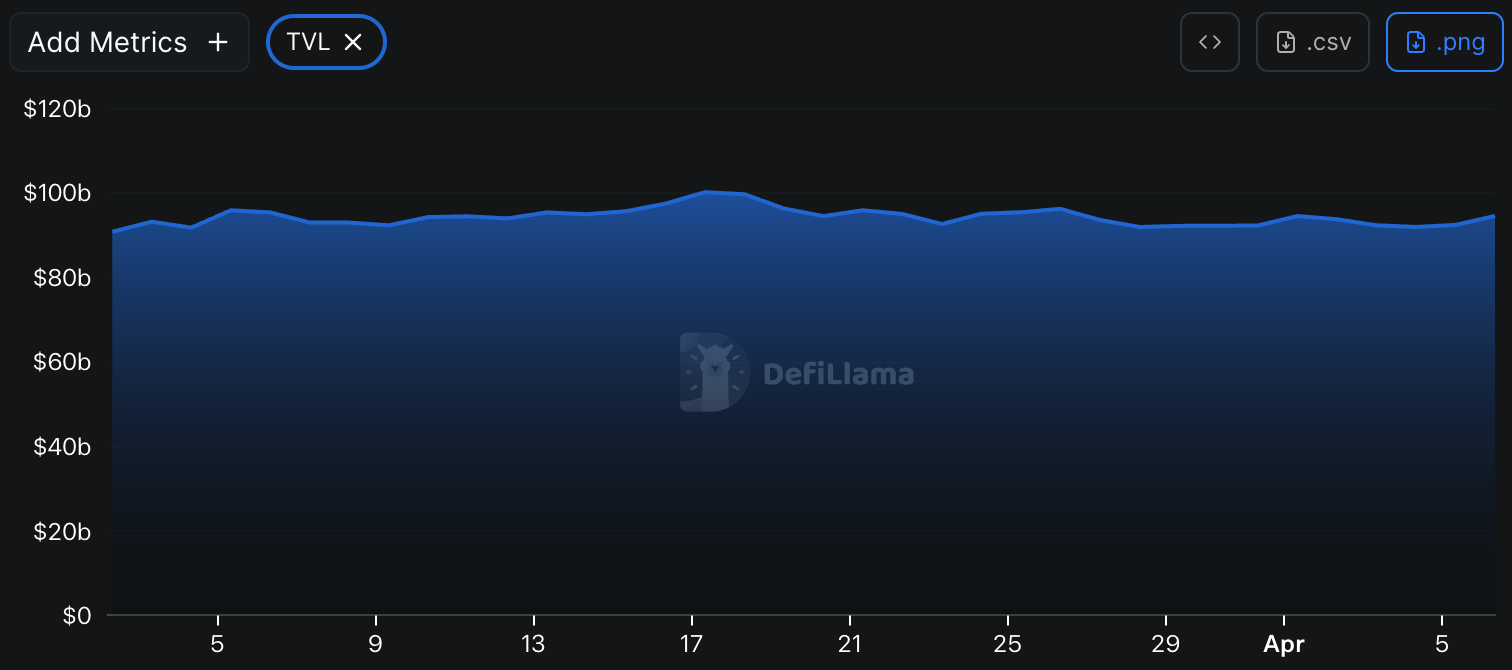
5. Decentralized Finance (DeFi)
According to DeFiLlama data, the total DeFi TVL this week is $94.524 billion, up about 1.89% from $92.769 billion last week.
Data Source: defillama, https://defillama.com
Data as of April 5, 2025
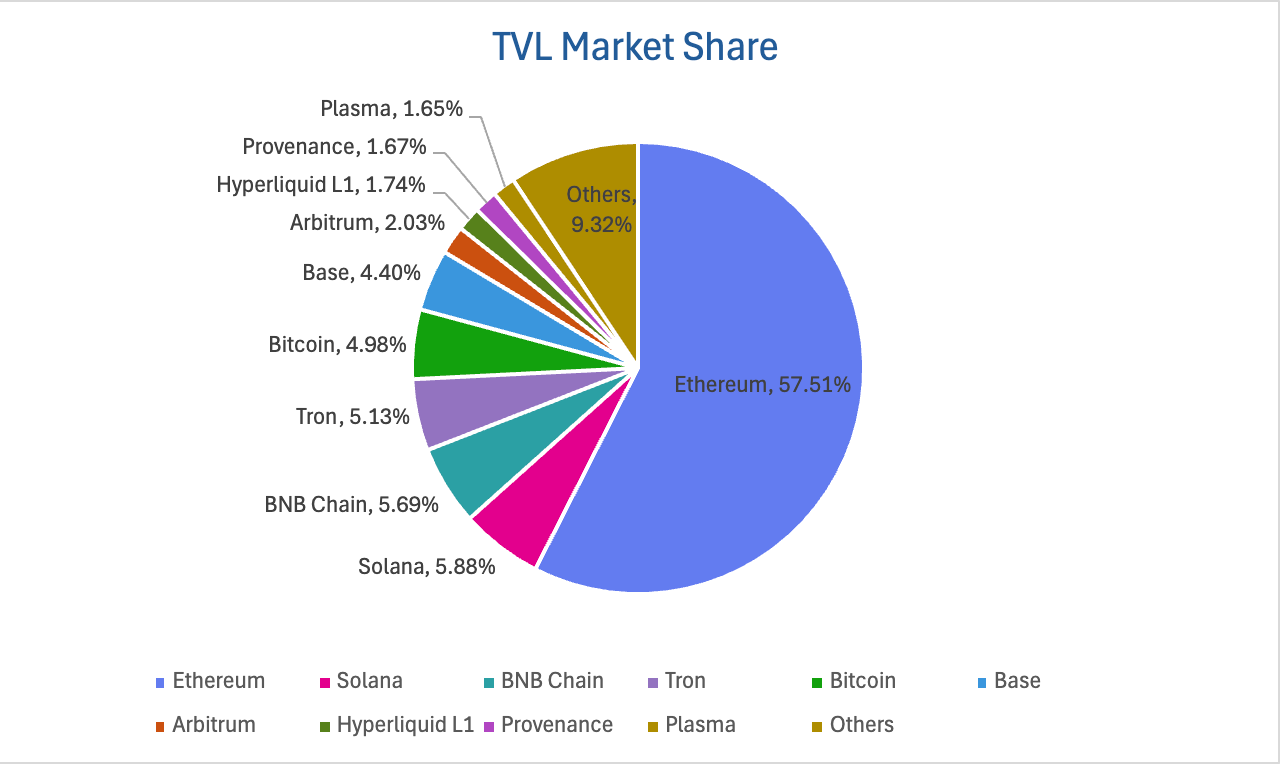
Divided by public chain, the three public chains with the highest TVL are Ethereum, accounting for 57.03%; Solana, accounting for 6.85%; and BNB Chain, accounting for 5.69%.
Data Source: CoinW Research, defillama, https://defillama.com
Data as of April 5, 2025
6. On-Chain Data
Layer 1 Related Data
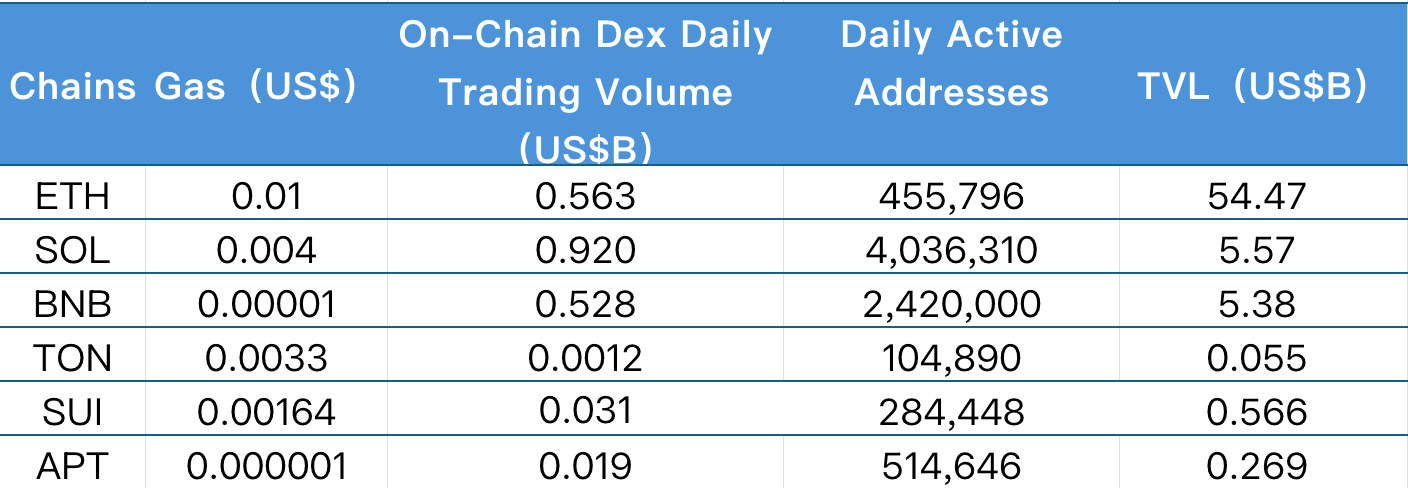
This section analyzes current data for major Layer 1s including ETH, SOL, BNB, TON, SUI, and APTOS, focusing on daily trading volume, daily active addresses, and transaction fees.
Data Source: CoinW Research, defillama, https://defillama.com
Data as of April 5, 2025
On-Chain DEX Daily Volume & Transaction Fees: On-chain DEX daily volume and transaction fees are core metrics for measuring public chain activity and user experience. Regarding on-chain DEX daily volume, all chains saw varying degrees of decline this week, with Ton ($0.0012B, -43.32%) and BNB Chain ($0.528B, -32.65%) experiencing the largest drops; followed by Ethereum ($0.563B, -22.88%), Solana ($0.92B, -14.42%), Aptos ($0.019B, -12.60%), and Sui ($0.031B, -3.29%). In terms of transaction fees, Ethereum ($0.01), BNB Chain ($0.00001), and Ton ($0.0033) remained largely flat compared to last week; Solana ($0.004) and Sui ($0.00164) rose by 28.77% and 38.51%, respectively, compared to last week; Aptos ($0.000001) fell by 8.43% compared to last week.
Daily Active Addresses & TVL: Daily active addresses reflect a public chain's ecosystem participation and user stickiness, while TVL reflects user trust in the platform. Regarding daily active addresses, BNB Chain (2.42 million) remained almost flat compared to last week; Aptos (514k), Ethereum (455k), and Ton (104k) fell by 52.09%, 10.54%, and 6.45%, respectively; Sui (284k, +14.38%) and Solana (4.036 million, +8.34%) increased. In terms of TVL, Solana ($5.57B, -11.88%) and Aptos ($0.269B, -8.19%) declined, while changes in other chains were minimal: Sui ($0.566B, +0.89%), Ethereum ($54.47B, +3.17%), BNB Chain ($5.38B, +2.75%), and Ton ($0.055B, -1.38%).
Layer 2 Related Data
According to L2Beat data, the total TVL for Ethereum Layer 2 this week is $30.70 billion, down 0.87% overall from $30.97 billion last week.
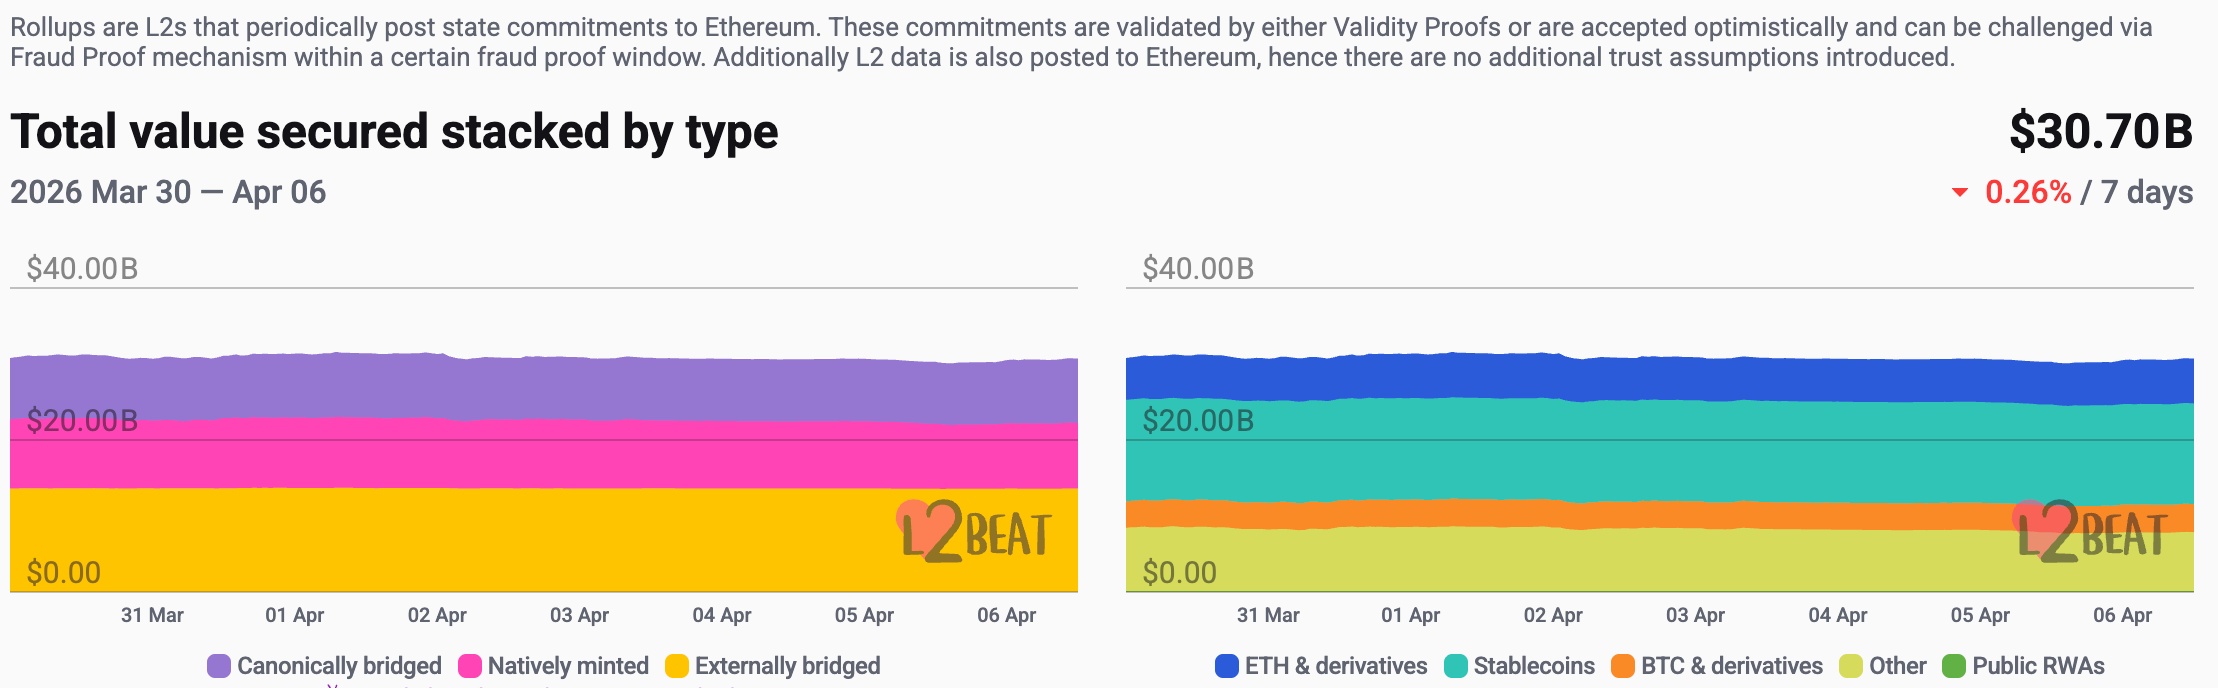
Data Source: L2Beat, https://l2beat.com/scaling/tvs
Data as of April 5, 2025
This week, Base and Arbitrum held market shares of 36.36% and 16.79%, respectively, ranking first and second.
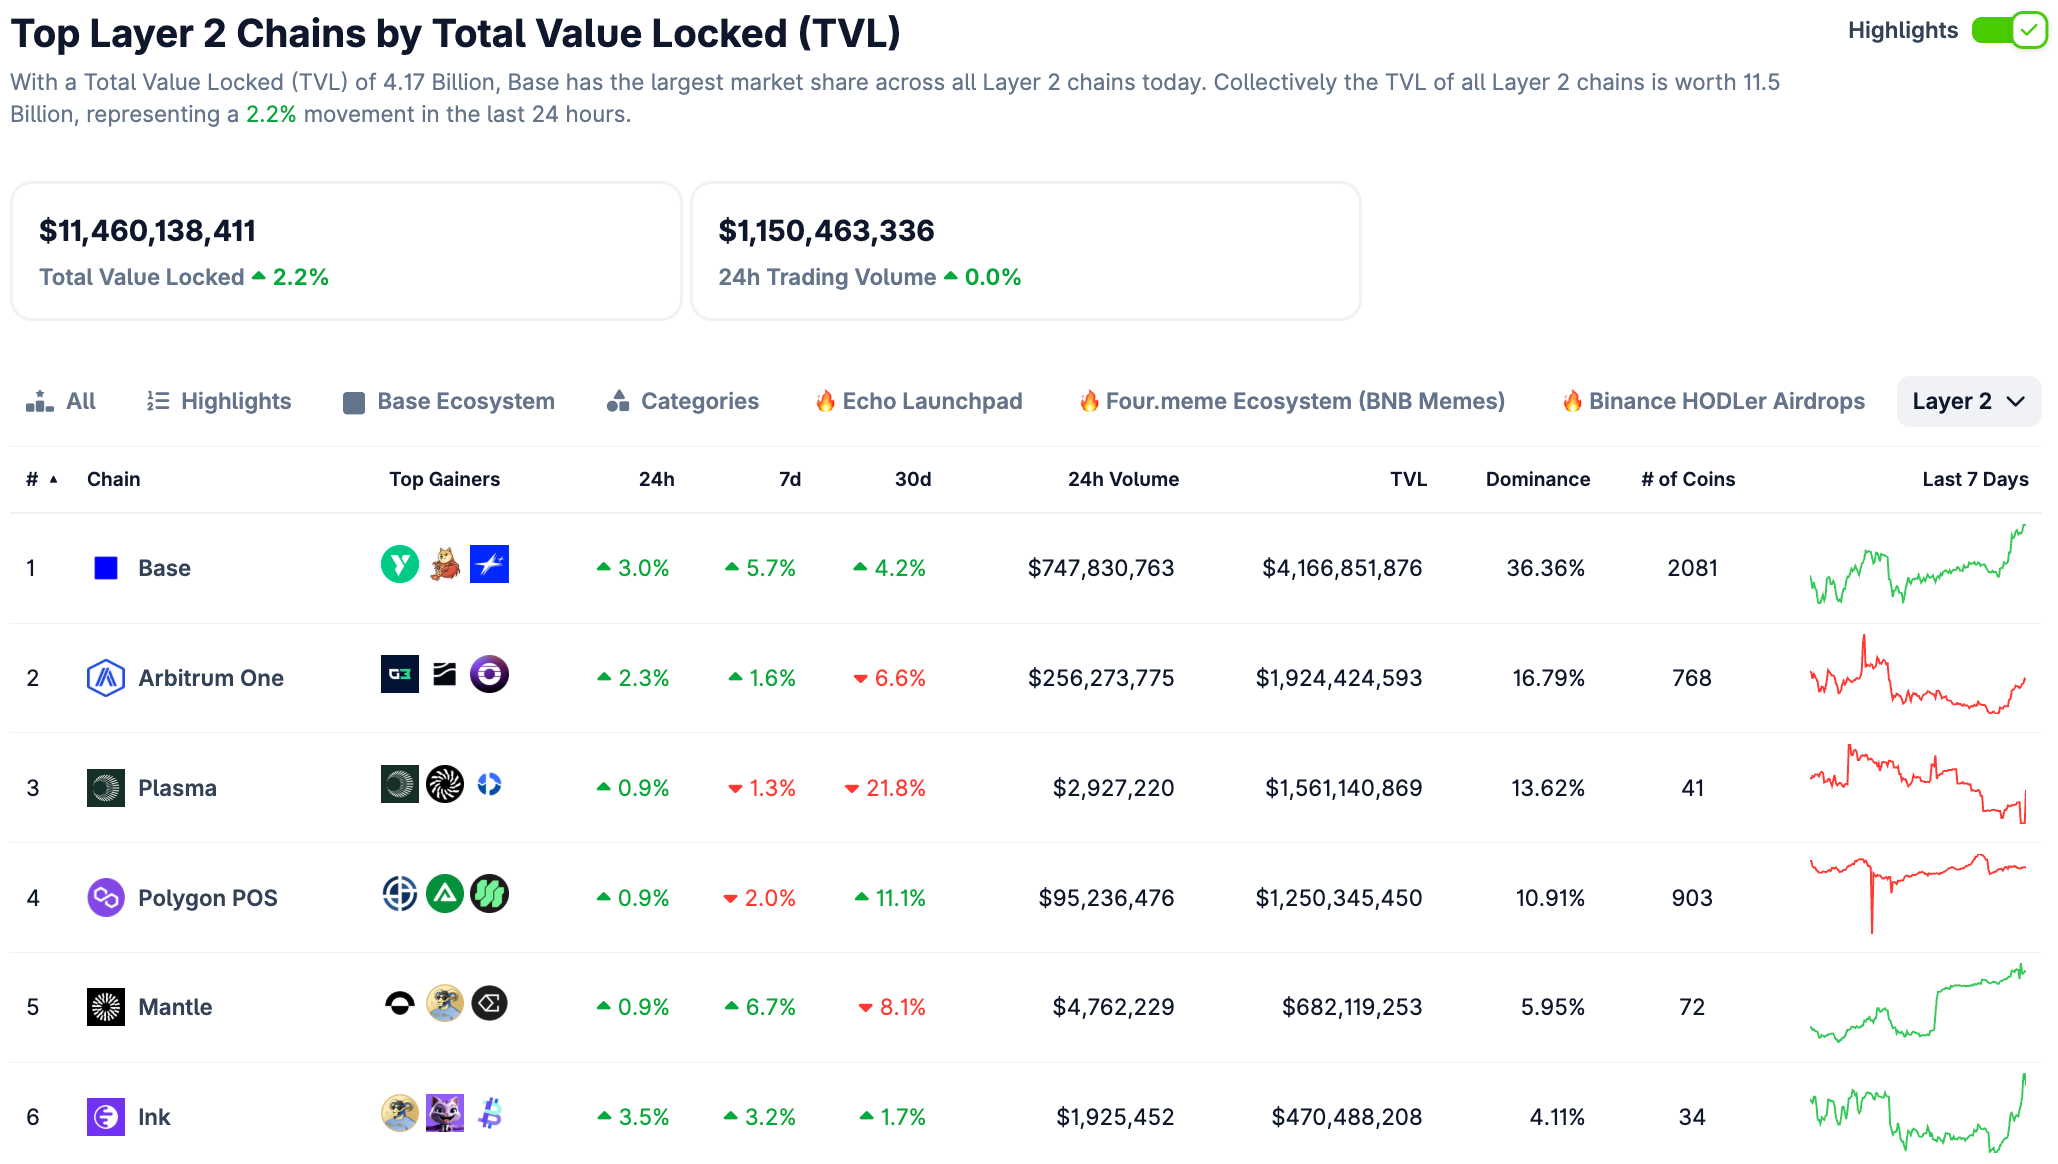
Data Source: CoinGecko, https://www.coingecko.com/en/chains/layer-2
Data as of April 5, 2025
7. Stablecoin Market Cap and Issuance
According to Coinglass data, the total stablecoin market cap is $309.9 billion, down about 0.39% from $308.7 billion last week. Among them, the USDT market cap is $184.07 billion, accounting for 59.39% of the total stablecoin market cap, unchanged from last week; followed by USDC with a market cap of $


