






With Annual Revenue in the Hundreds of Millions and Aggressive Buybacks, Why is Pump.fun Still Being 'Shorted' by the Market?


- Core Viewpoint: The article uses multi-dimensional on-chain data and statistical tests to demonstrate the authenticity of the Pump.fun protocol's revenue and large-scale token buybacks. It points out that the main reasons for the suppressed token valuation are the industry label of "meme coin casino," trust issues stemming from an anonymous team, and suspected insider trading capital outflows, rather than fundamental issues.
- Key Elements:
- On-chain data shows that over eight months, the protocol used approximately 99.5% of its daily revenue to complete $328 million worth of PUMP token buybacks. The repurchased tokens are stored in a publicly verifiable wallet, and two independent data sources, DeFiLlama and fees.pump.fun, show a high degree of alignment.
- Four statistical tests (fee/revenue ratio changes, continuity, weekend effect, autocorrelation) on 747 days of fee data all indicate characteristics consistent with organic business growth, making artificial fabrication extremely complex.
- Valuation suppression factors include: the platform being cited in a Solidus Labs report stating that 98.6% of its tokens exhibit "rug pull" characteristics, leading to an "original sin stock" discount; trust issues arising from an anonymous team and discretionary buyback policies; on-chain data shows private sale investors transferring large amounts of tokens to exchanges during the buyback period.
- Fundamental analysis indicates that after the team unlock begins in August 2026, the monthly token emission will decrease from 10 billion to 9.2 billion tokens. At the current revenue level, the monthly buyback amount could absorb approximately twice the new supply.
Original Author: Four Pillars
Original Compilation: AididiaoJP, Foresight News
Key Takeaways
A $328 million buyback completed in eight months using 99.5% of daily protocol revenue. Two independent data aggregators, despite not communicating, arrived at the same conclusion. To manipulate the data, one would need to simultaneously deceive DeFiLlama, maintain a stable 68-69% ratio with Adam_tech's Dune data (which only indexes Solana), and have 105.17 billion PUMP tokens in verifiable wallets as backing.
The "dilution curve" in August 2026 is actually a supply replacement, not an addition. At current revenue levels, the buyback can absorb twice the new supply. Community emissions will cease when team and investor unlocks begin. Monthly emissions will drop from 10 billion tokens to 9.2 billion tokens.
The real reasons for the current suppressed valuation multiples are: industry categorization ("sin stock" nature), trust foundation (anonymous team, discretionary buyback), and fund flows (suspected insider traders selling into the buyback).
1. The $328 Million Buyback Receipt
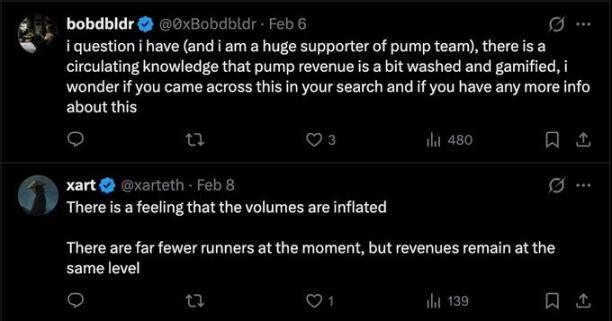
Rumors of Pump.fun revenue fabrication have been circulating on Twitter. The following analysis indicates these rumors are unfounded.
As of March 15, 2026, data from fees.pump.fun shows cumulative buybacks reaching $328 million. This means 2,283,518 SOL was used to purchase 104.5 billion PUMP, accounting for 10.45% of the total supply and offsetting 29.52% of the circulating supply. Over eight months, daily buyback amounts have remained between 99.5% and 100.5% of protocol revenue, averaging $1.25 million per day as of February 2026. Fabricating revenue would require massive capital backing: for every dollar bought back, one dollar of SOL flows from a verifiable wallet to purchase tokens stored in an auditable address. To fake $328 million in revenue, one would need to actually spend $328 million.
The related tokens are stored on-chain and are verifiable (as of March 17, wallet G8CcfRff holds 103.96 billion PUMP, wallet 8PSmqJy6 holds 1.21 billion PUMP, totaling 105.17 billion). The initial execution wallet 3vkpy5Y (marked as "Pump Buy Back" on Solscan) completed transfers to the holding wallets and was rotated in August 2025, now with a zero balance.
DeFiLlama recorded total protocol revenue from July 15, 2025, to February 21, 2026, as $300,041,880. During the same period, cumulative buyback amounts on fees.pump.fun were $300,178,162. The match rate is 100.05%, with only a $136,000 difference in a $300 million total between two independent systems.
Adam_tech's Dune dashboard provides a third layer of verification. This platform only tracks Solana chain revenue, consistently accounting for 68-69% of DeFiLlama's multi-chain data, as it does not index Padre revenue launched on Base, Ethereum, and BNB Chain in October 2025. This ratio remains stable daily, indicating both independently read the same on-chain events.
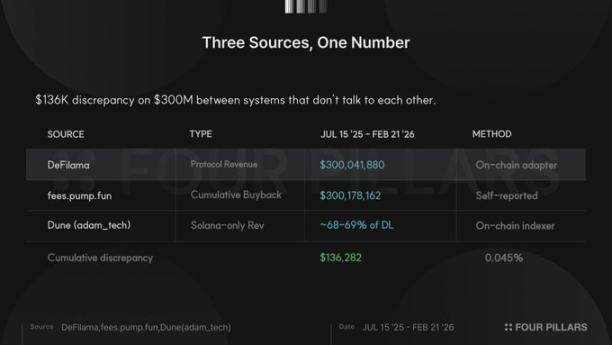
Before the launch of PumpSwap in March 2025, the error margin between the three data sources was within 1-5%. After PumpSwap's launch, the data differentiated into three layers: total fees, protocol revenue, and Solana-only revenue. If someone were to artificially fabricate revenue data, they would need to simultaneously deceive two independent on-chain indexers, maintain stable cross-ratios through three product changes, keep a multi-chain revenue split ratio consistent with actual business expansion, and back it with token purchases in verifiable wallets.
2. Four Statistical Tests
Beyond on-chain evidence, 747 days of fee data can be subjected to four standard tests to verify the authenticity of the financial data. While a single test is not conclusive, when four tests point to the same conclusion, credibility increases significantly.
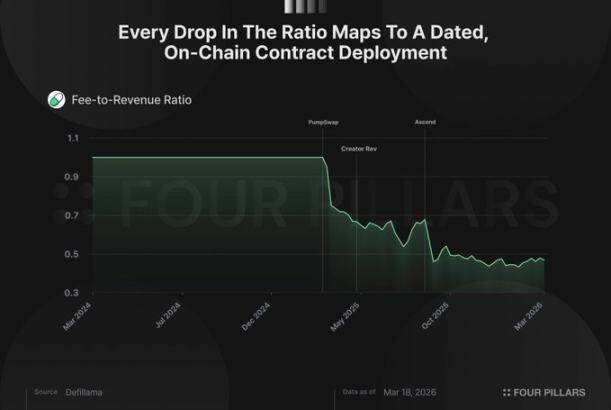
The first test examines the fee-to-revenue ratio, which is the hardest metric to fake. Pump.fun collects fees from each bonding curve trade, but not all counts as protocol revenue; some flows to LPs, creators, and referral rewards. In the dataset, the total fee-to-net revenue ratio dropped from 1.0 to about 0.48, but not gradually. It dropped sharply in three stages, each corresponding to a documented on-chain product change:
- March 20, 2025: PumpSwap launched with an LP fee split mechanism, the ratio dropped from 1.00 to 0.70 within two days.
- May 13, 2025: Creator revenue sharing mechanism launched, ratio dropped from 0.69 to 0.56.
- September 2-3, 2025: The Ascend project introduced a dynamic fee mechanism. Tiered pricing allows creators to receive up to 0.95% fees on low-market-cap tokens, with the protocol keeping only 0.05%, ratio dropped from 0.68 to 0.46.
Faking this data would require synchronously simulating fee and revenue series undergoing three structural adjustments, with the daily ratio fluctuating between 0.40 and 0.55 based on token tier composition. This complexity makes fabrication difficult. The reality is that product iterations naturally caused the data changes, not artificially constructed structural breakpoints coinciding with contract deployment times.
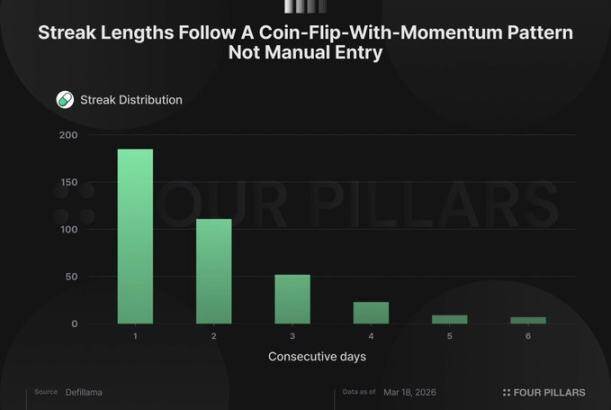
The second test examines continuity and digit distribution characteristics, aiming to determine if the data shows signs of manual entry. Humans struggle to generate truly random sequences, tending to avoid long streaks, preferring round numbers, and unconsciously favoring specific digits. Pump.fun data lacks these characteristics:
The longest consecutive up or down streak is 6 days, with an average streak length of 1.92 days, consistent with expectations for a natural process with moderate momentum. The streak length distribution decreases geometrically: 185 one-day streaks, 111 two-day streaks, 52 three-day streaks, down to 7 six-day streaks.
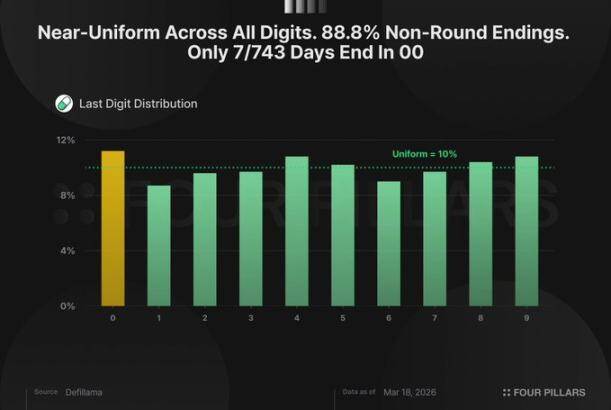
The last digit of daily fees is nearly uniformly distributed between 0-9, with each digit accounting for 8.7%-11.2%. 88.8% of days end with non-round numbers; of the 743 non-zero days, only 7 end with 00 or 000.
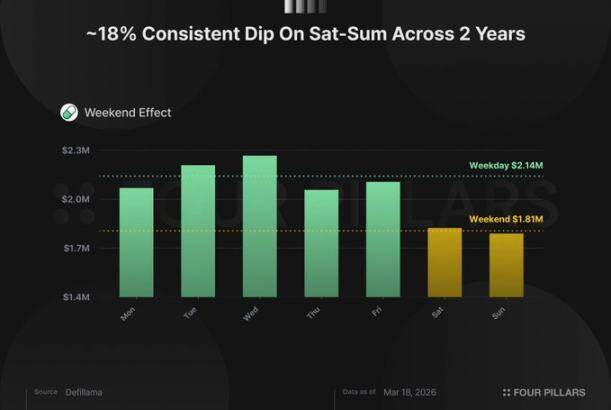
The third test examines the weekend effect. Pump.fun is a retail platform; users issue tokens more on weekdays than weekends. Average daily fees are $2.14 million on weekdays and $1.81 million on weekends, a consistent ~18% drop that appears week after week over two years of data. A Mann-Whitney test shows a p-value of 0.003, statistically significant. If data were artificially constructed, one would need to deliberately keep weekends consistently lower, increasing the complexity and risk of detection.
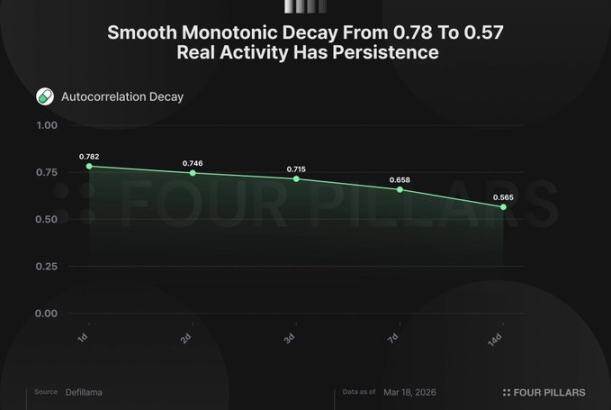
The final test examines autocorrelation, measuring the relationship between today's revenue and tomorrow's. Pump.fun's first-order lag autocorrelation is 0.78, meaning today's fees are 78% correlated with yesterday's; after one week (lag 7 days) it's still 0.65; after two weeks (lag 14 days) it's 0.57. This slow, smooth decay reflects the momentum characteristic of organic platform activity: active periods cluster, and downturns persist. If daily revenue were randomly generated, correlation between adjacent days would be near zero, and data would jump like noise rather than flow like a market. Faking high autocorrelation for a single lag is not difficult, but simultaneously faking the entire decay structure (monotonically decreasing stepwise across lags) while maintaining weekend effects, streak characteristics, and realistic digit distribution is nearly impossible.
Four independent tests, four consistent conclusions, three data sources corroborating each other. The revenue data is authentic and credible.
3. Analysis of Remaining Valuation Discount Factors
The revenue fabrication rumor is one reason for PUMP's current suppressed valuation. The preceding analysis has clarified this point. However, the token still trades at a discount, requiring exploration of other suppressing factors and their validity.
First, analyze the August team unlock. Community emissions are 10 billion tokens monthly, set to reach 240 billion and stop in July, coinciding with the start of team and investor unlocks, totaling 9.2 billion tokens monthly. Monthly emissions drop from 10 billion to 9.2 billion, an 8% decrease in inflation rate. At the current average daily revenue of $1.25 million, monthly buybacks average $38 million. At a price of $0.0021 per token, this can absorb about twice the $19 million worth of new monthly supply. After August, emissions decrease while buybacks continue, further improving this ratio.
Revenue also shows no signs of decline. Over fourteen months, average monthly fees have fluctuated between $2.3 million and $4.8 million daily: a 49% drop in July 2025, a 94% rebound in August, a 72% surge in September, and a 45% spike in January 2026. Overall, it has mean-reverted around a daily average of $2.5-3 million, with weekly trading volume stable at $640-700 million. The so-called "decline from Q3 to Q1" is a selective conclusion drawn from cherry-picking September's peak data.
The remaining suppressing factors are as follows:
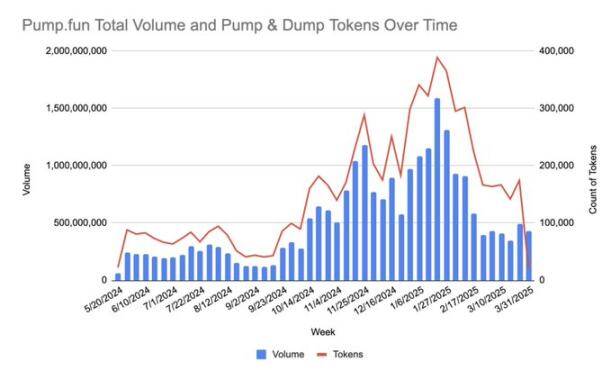
The "sin stock" discount is the most persistent. Solidus Labs found that 98.6% of tokens on the platform exhibit "rug pull" characteristics. This finding has had the expected effect: regardless of revenue, institutional allocators will not include a "meme coin casino" in their portfolios. This is a persistent structural factor, completely unrelated to revenue quality.
Source: Solidus Labs
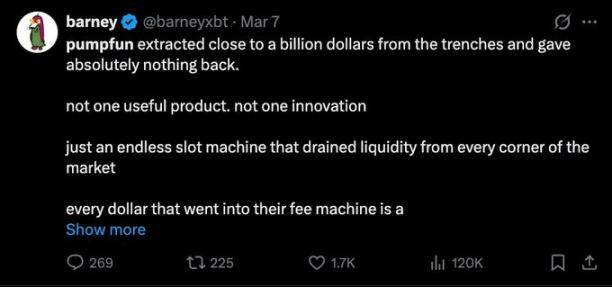
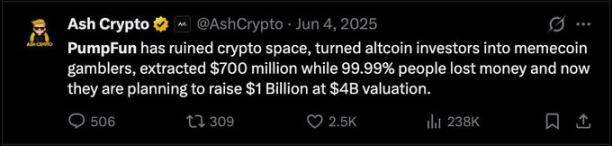
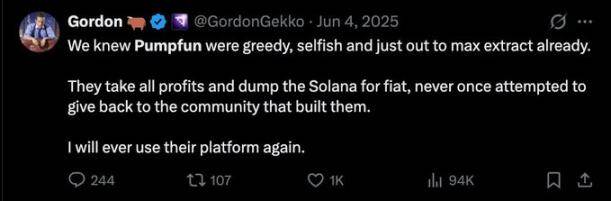
Suspected insider selling constitutes tangible recent pressure. Wallet 77DsB received 3.75 billion PUMP in July 2025 from an address marked as "Token Custody Wallet" on Solscan, allegedly liquidating its position for 8.02 million USDC between February 16 and 22, 2026. Wallet GpCfm transferred 1.21 billion PUMP ($2.57 million) to Bitget during the same period. A third wallet deposited 1.757 billion PUMP ($3.54 million) into Bitget on March 6. While no source confirms actual ownership, at least $14 million flowed to exchanges at a market price of $0.002 within thirty days, concurrent with protocol buybacks, whereas the private sale price was $0.004. Regardless of wallet owner identity, this situation raises questions.
The trust layer is the hardest to price. The founders are anonymous (co-founder Dylan has a "rug pull" record from 2017); the buyback is explicitly "discretionary" ("pump.fun may modify or discontinue the related plan at any time"); Bubblemaps once alleged Hayden Davis was linked to a $50 million private placement, later retracting the claim after co-founder Alon called it "defamatory." On-chain connections exist, but attribution is disputed and unverified.
None of the above factors relate to business fundamentals. Revenue is real, data-backed, and the unlock schedule is favorable for holders. The "sin stock" label, anonymous founders, and insider fund flows represent a trust discount applied to a protocol with $1.25 million in daily, verifiable on-chain revenue, whose buyback can absorb twice the new supply. This trust discount will eventually narrow; revenue of this scale will not be permanently mispriced.


