
CoinW Research Weekly Report (Issue 2026.2.2 - 2026.2.8)
- Core View: The cryptocurrency market showed a broad decline this week, with total market cap dropping 8.15%. Market sentiment is extremely fearful. Activity and TVL on major public chains generally retreated, but stablecoin issuance increased significantly.
- Key Factors:
- The total cryptocurrency market cap fell 8.15% to $2.48 trillion. The market fear & greed index stands at 13, indicating extreme fear.
- U.S. spot Bitcoin ETFs saw a net outflow of $689 million this week, while spot Ethereum ETFs had a net outflow of $21.37 million.
- Total DeFi TVL decreased by 6.93% to $98.56 billion. Ethereum, Solana, and BNB Chain occupy the top three spots in TVL.
- On-chain DEX daily trading volume, active addresses, and TVL on major public chains (e.g., Ethereum, Solana) generally experienced significant declines.
- The total stablecoin market cap slightly decreased by 0.67%, but USDC's market cap grew by 3.84%. Moreover, the total stablecoin issuance this week surged by 358.05% compared to the previous week.
- Industry financing remained active, with projects like Jupiter and TRM Labs securing tens of millions of dollars in funding, indicating continued capital interest in infrastructure and compliance sectors.
Key Takeaways
The total global cryptocurrency market capitalization is $2.48 trillion, down 8.15% this week from $2.70 trillion last week. As of press time, the cumulative total net inflow into US Bitcoin spot ETFs is approximately $54.65 billion, with a net outflow of $689 million this week; the cumulative total net inflow into US Ethereum spot ETFs is approximately $11.80 billion, with a net outflow of $21.37 million this week.
The total stablecoin market capitalization is $307.9 billion, down 0.67% from $310 billion last week. Among them, the market cap of USDT is $184.4 billion, accounting for 59.88% of the total stablecoin market cap, down approximately 0.38% from $185.1 billion last week. Next is USDC with a market cap of $72.9 billion, accounting for 23.67% of the total stablecoin market cap, up approximately 3.84% from $70.2 billion last week. The market cap of DAI is $5.36 billion, accounting for 1.74% of the total stablecoin market cap, remaining flat compared to last week.
According to data from DeFiLlama, the total DeFi TVL this week is $98.56 billion, down approximately 6.93% from $105.9 billion last week. Divided by public chain, the three public chains with the highest TVL are Ethereum, accounting for 57.54%; the Solana chain, accounting for 6.58%; and BNB Chain, accounting for 5.61%.
On-chain activity across public chains weakened overall this week, with multiple core indicators declining simultaneously. In terms of daily on-chain DEX trading volume, BNB Chain ($1.691B) saw a slight decrease of 6.06% this week; followed by Solana ($3.753B, -20.32%) and Ton ($0.003B, -33.60%). Ethereum ($1.622B), Sui ($0.099B), and Aptos ($0.03B) experienced relatively larger declines of 50.85%, 50.63%, and 62.43%, respectively. Regarding transaction fees, BNB Chain ($0.01), Ton Chain ($0.01), and Aptos ($0.000001) remained flat compared to last week; Ethereum ($0.01), Solana ($0.001), and Sui ($0.002) decreased by 50%, 66.42%, and 24.04%, respectively.
In terms of daily active addresses, only BNB Chain (2.81 million, +7.66%) and Ton (approximately 130,000, +8.3%) saw increases this week. All other chains declined: Ethereum (906,000, -23.0%), Solana (2.29 million, -13.26%), Sui (558,000, -13.84%), and Aptos (1.26 million, -19.18%). TVL also declined overall, with BNB Chain ($5.56B, -7.74%), Ethereum ($56.92B, -4.98%), and Ton ($0.07B, -6.81%) experiencing relatively smaller declines; followed by Solana ($6.50B, -22.66%), Aptos ($0.32B, -11.39%), and Sui ($0.59B, -17.32%).
New Projects to Watch: Kairos is a professional prediction market trading platform dedicated to providing traders with fast, integrated prediction market data and execution experience. Euclid Protocol is a decentralized cross-chain liquidity layer protocol aimed at solving the problem of liquidity fragmentation in the blockchain ecosystem, building a unified liquidity layer that enables dApps to seamlessly access and compose liquidity from multiple chains. Payy Network is a stablecoin payment blockchain network focused on privacy protection, aiming to build decentralized payment infrastructure for global users.
Table of Contents
Key Takeaways
I. Market Overview
1. Total Cryptocurrency Market Cap / Bitcoin Dominance
2. Fear & Greed Index
3. ETF Inflow/Outflow Data
4. ETH/BTC and ETH/USD Exchange Rates
5. Decentralized Finance (DeFi)
6. On-Chain Data
7. Stablecoin Market Cap and Issuance
II. Hot Money Trends This Week
1. Top 5 Performing VC Coins and Meme Coins This Week
2. New Project Insights
III. Latest Industry Developments
1. Major Industry Events This Week
2. Upcoming Major Events Next Week
3. Important Fundraising Last Week
IV. Reference Links
I. Market Overview
1. Total Cryptocurrency Market Cap / Bitcoin Dominance
The global total cryptocurrency market cap is $2.48 trillion, down 8.15% this week from $2.70 trillion last week.
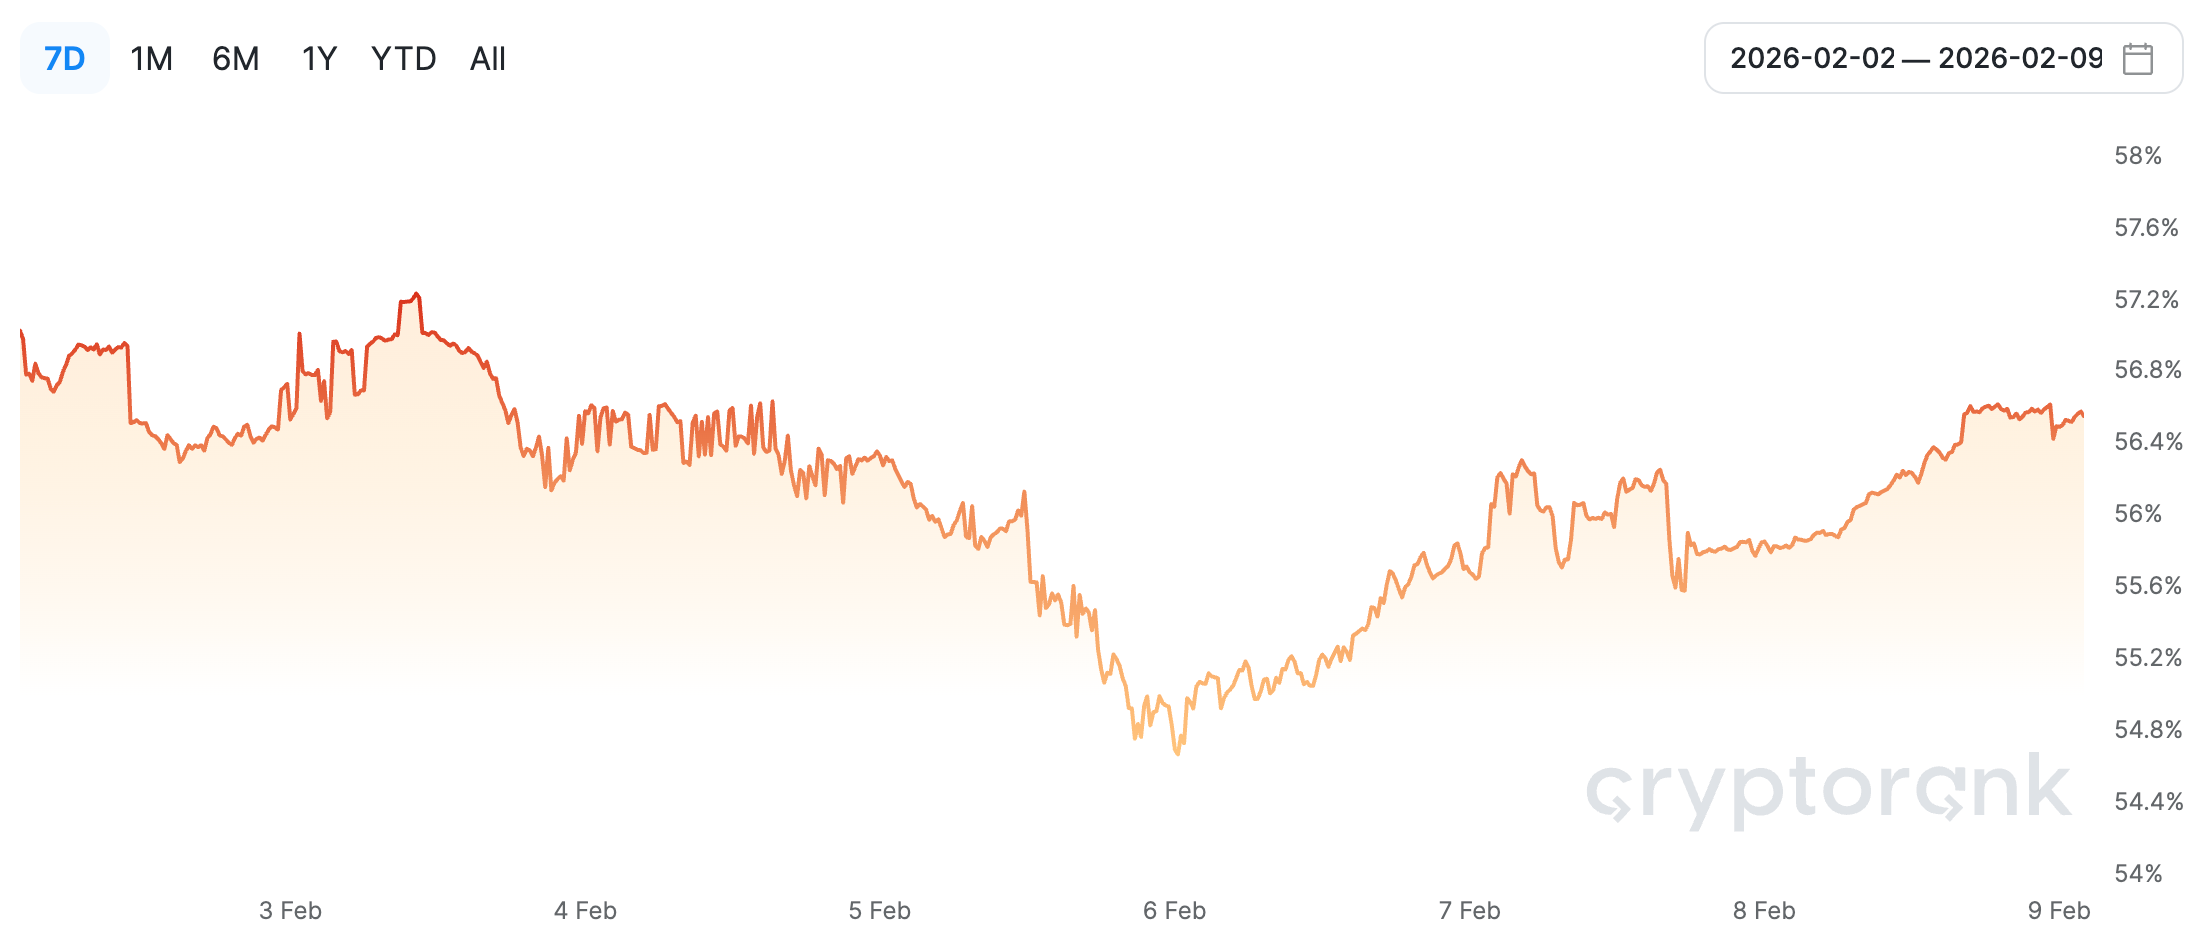
Data Source: Bitcoin dominance from cryptorank, https://cryptorank.io/charts/btc-dominance
Data as of February 8, 2026
As of press time, the market cap of Bitcoin is $1.41 trillion, accounting for 56.85% of the total cryptocurrency market cap. Meanwhile, the stablecoin market cap is $307.9 billion, accounting for 12.41% of the total cryptocurrency market cap.
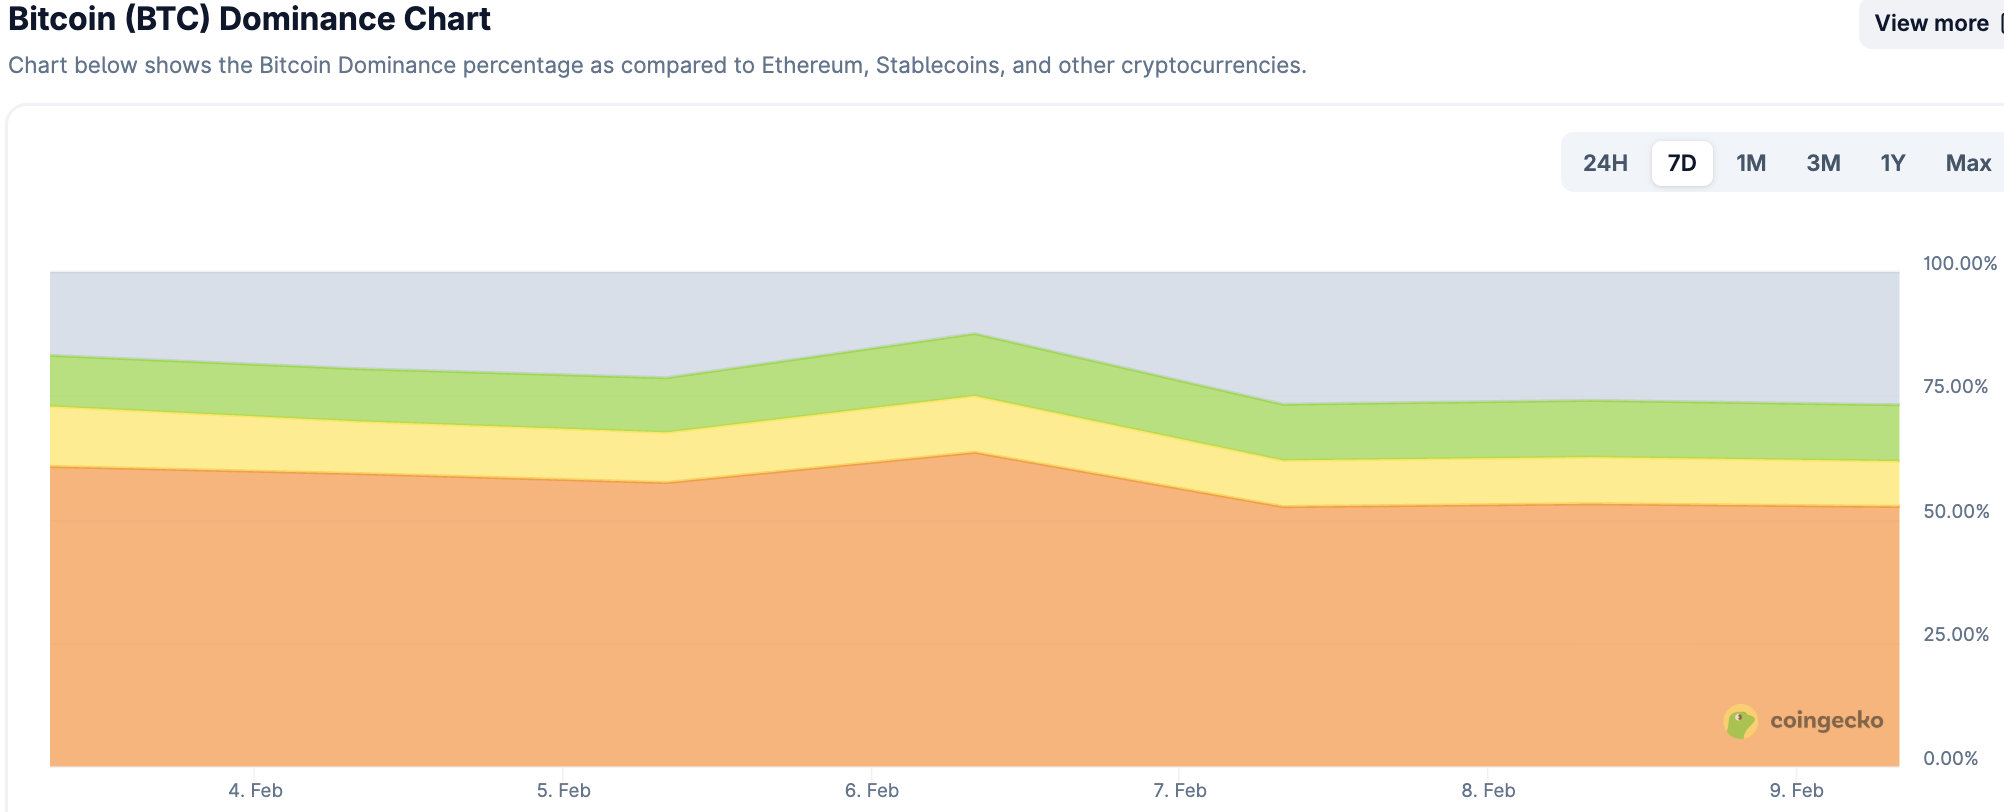
Data Source: coingecko, https://www.coingecko.com/en/charts
Data as of February 8, 2026
2. Fear & Greed Index
The Crypto Fear & Greed Index is 13, indicating Extreme Fear.
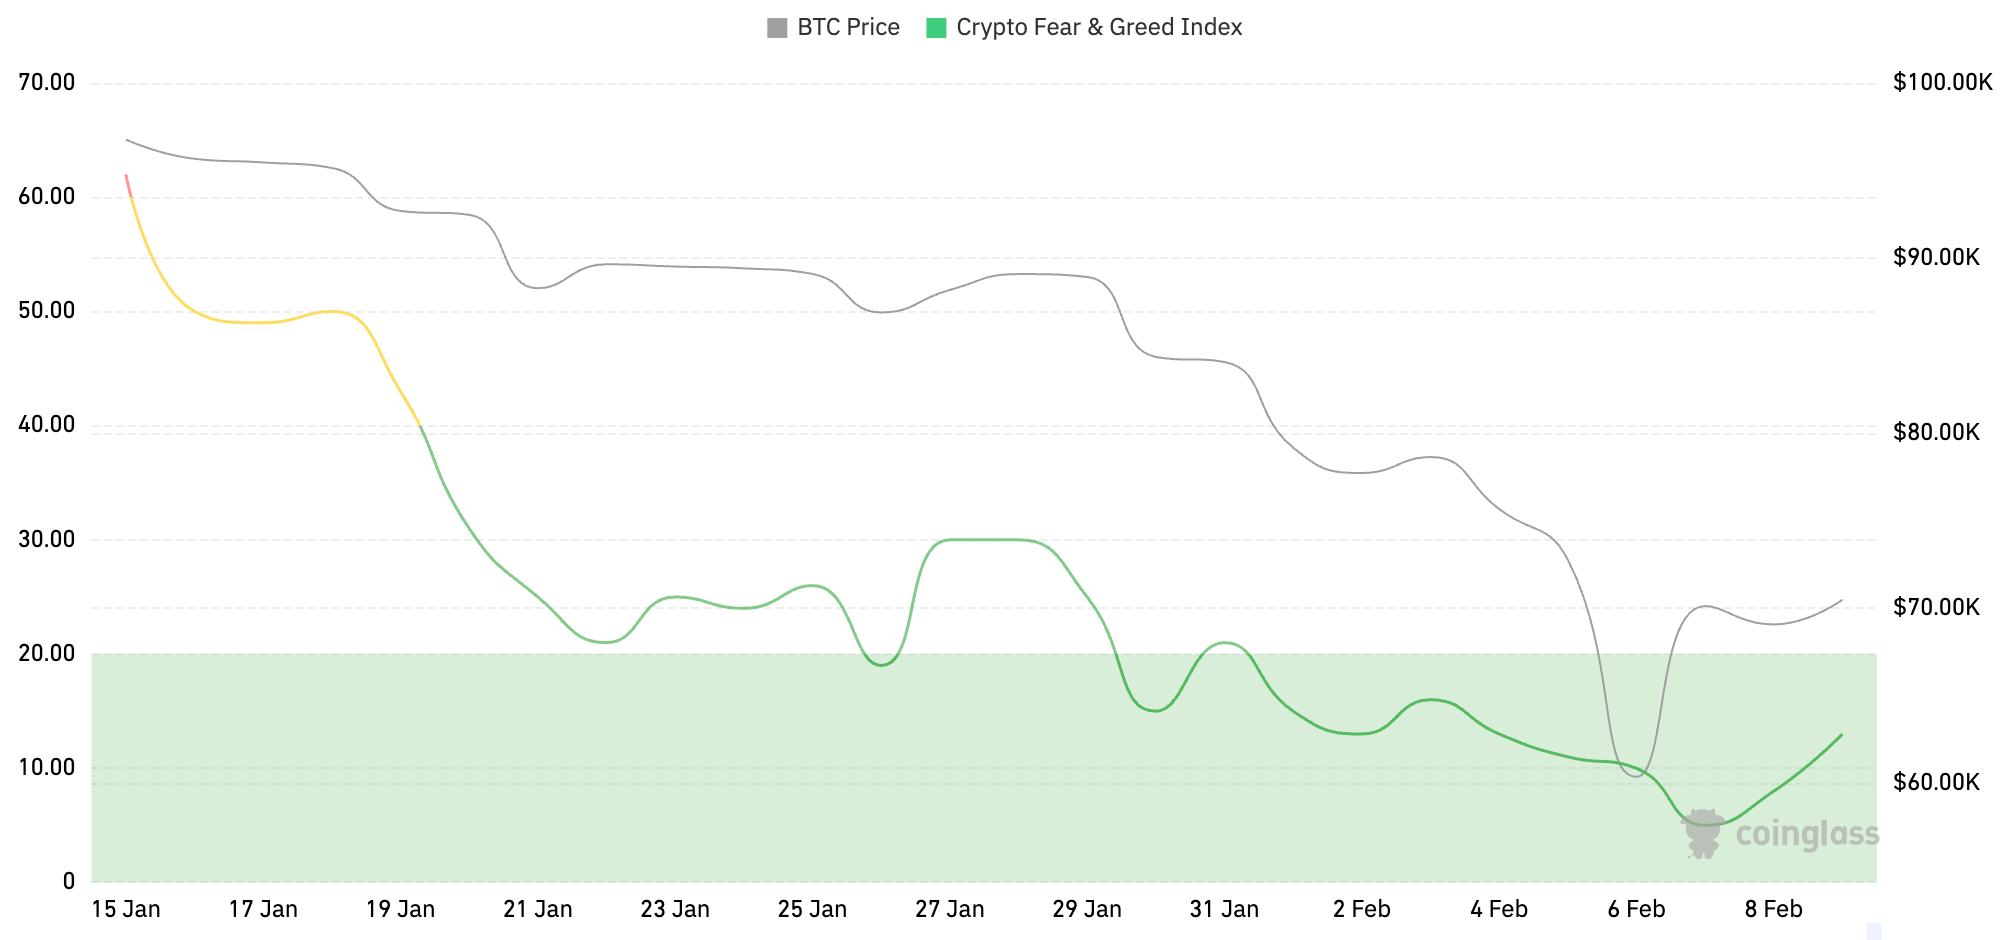
Data Source: coinglass, https://www.coinglass.com/pro/i/FearGreedIndex
Data as of February 8, 2026
3. ETF Inflow/Outflow Data
As of press time, the cumulative total net inflow into US Bitcoin spot ETFs is approximately $54.65 billion, with a net outflow of $689 million this week; the cumulative total net inflow into US Ethereum spot ETFs is approximately $11.80 billion, with a net outflow of $21.37 million this week.
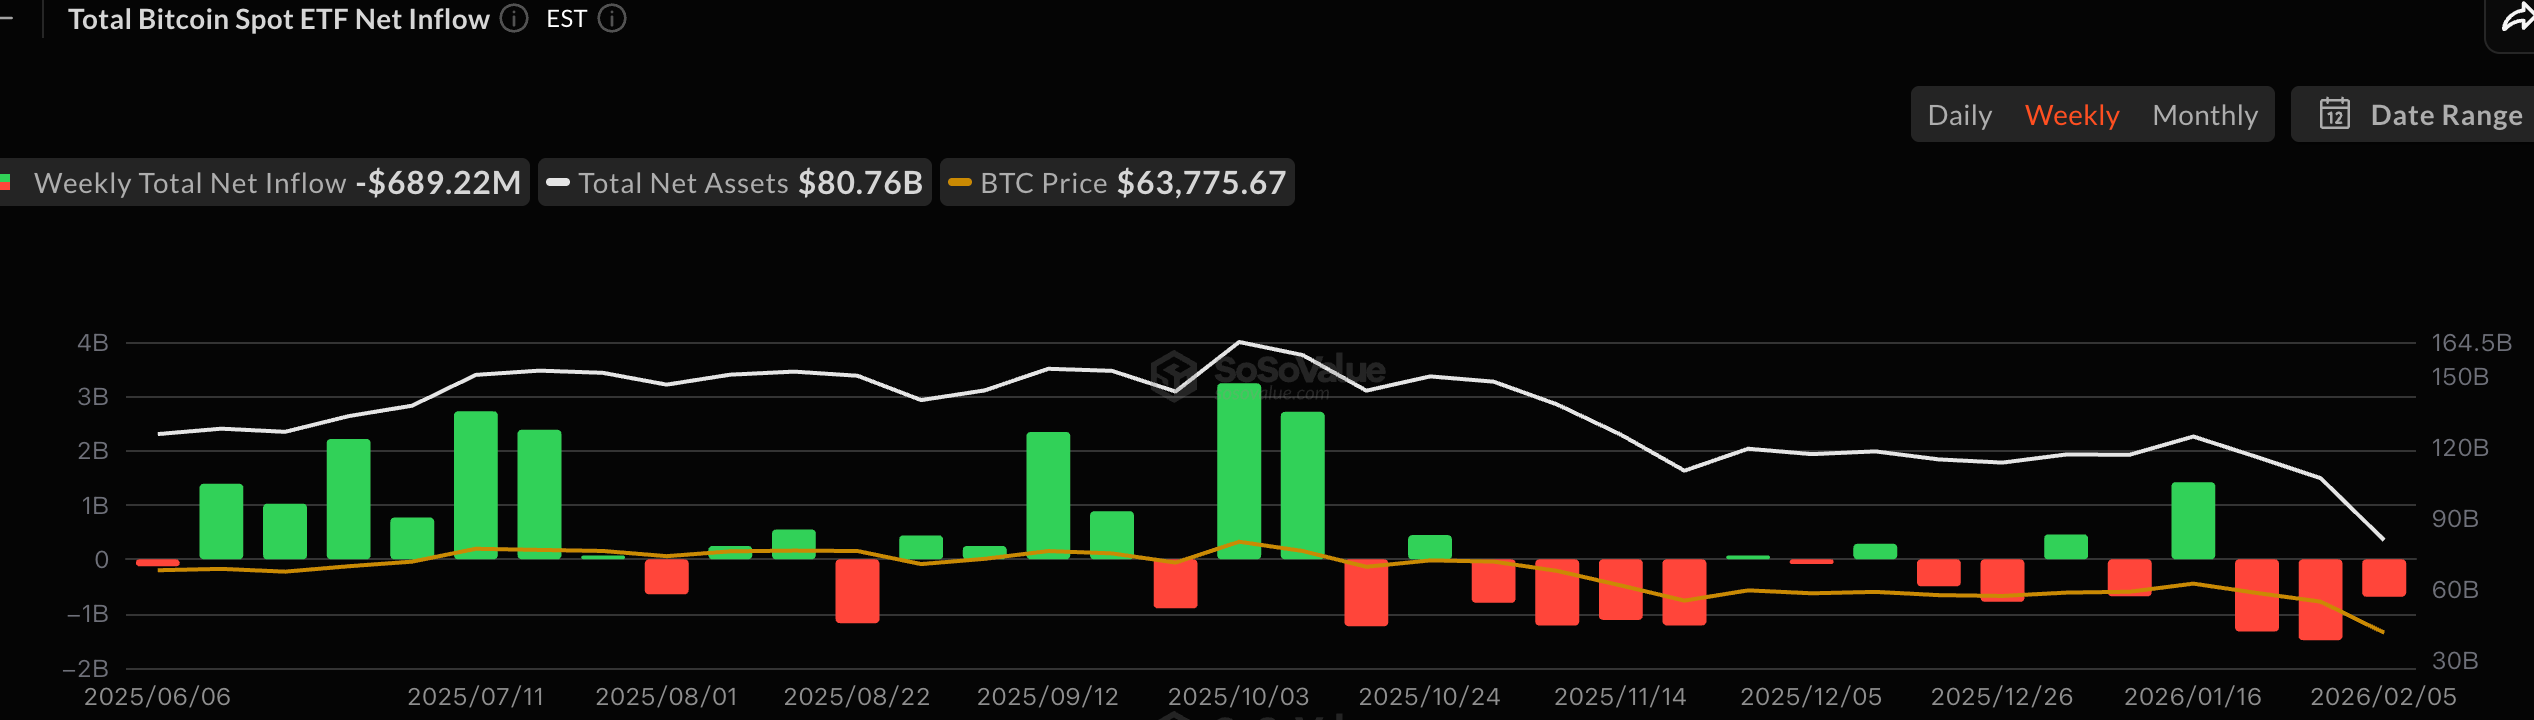
Data Source: sosovalue, https://sosovalue.com/zh/assets/etf
Data as of February 8, 2026
4. ETH/BTC and ETH/USD Exchange Rates
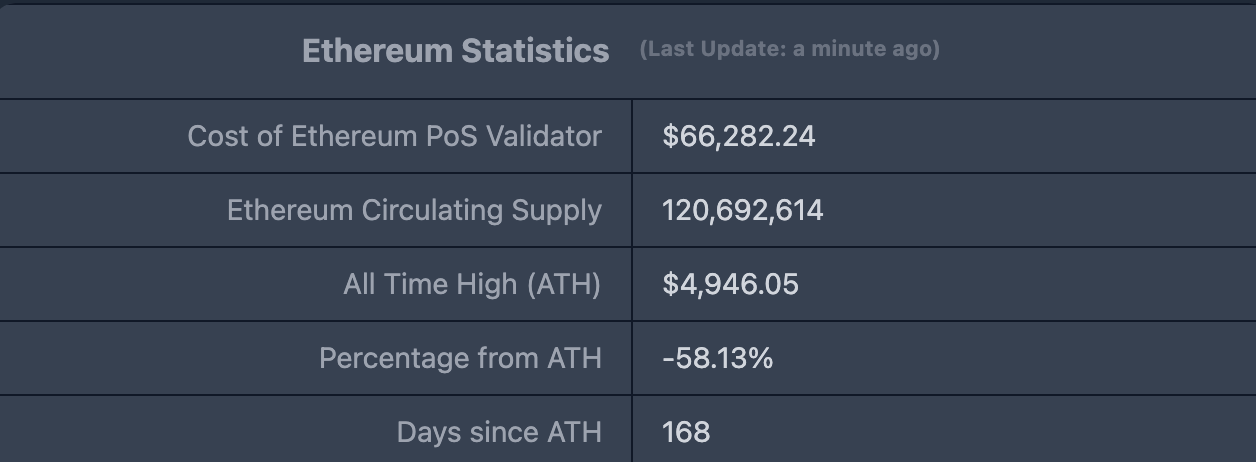
ETHUSD: Current price $2,071.32, all-time high $4,946.05, down approximately 58.14% from ATH.
ETHBTC: Currently 0.029434, all-time high 0.1238.
Data Source: ratiogang, https://ratiogang.com/
Data as of February 8, 2026
5. Decentralized Finance (DeFi)
According to data from DeFiLlama, the total DeFi TVL this week is $98.56 billion, down approximately 6.93% from $105.9 billion last week.
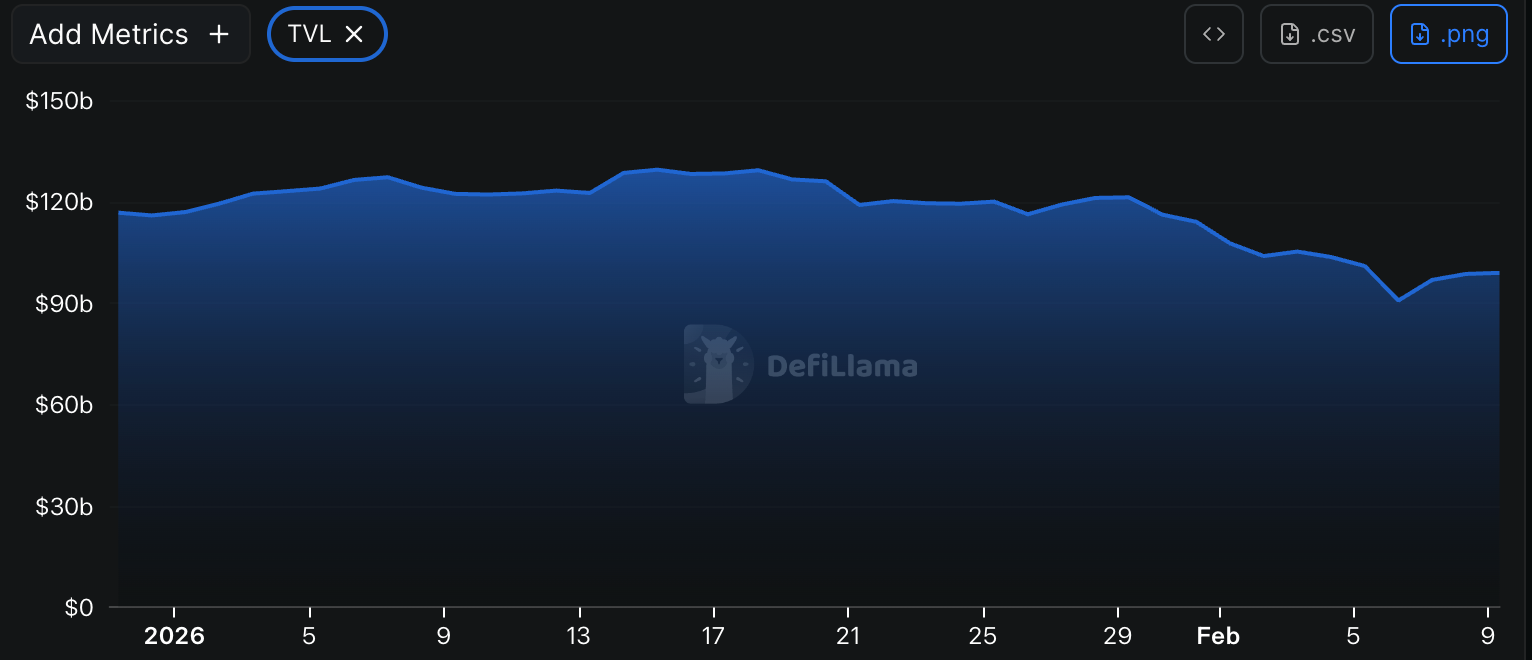
Data Source: defillama, https://defillama.com
Data as of February 8, 2026
Divided by public chain, the three public chains with the highest TVL are the Ethereum chain, accounting for 57.54%; the Solana chain, accounting for 6.58%; and BNB Chain, accounting for 5.61%.
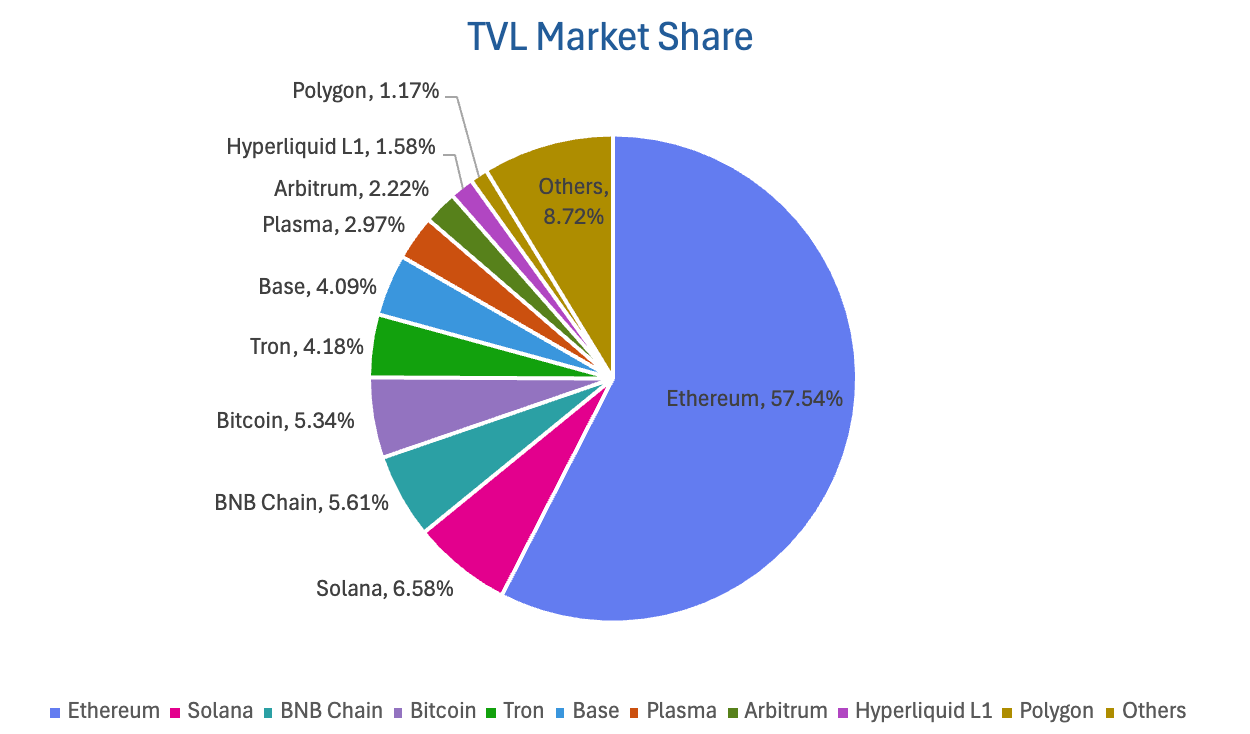
Data Source: CoinW Research, defillama, https://defillama.com
Data as of February 8, 2026
6. On-Chain Data
Layer 1 Related Data
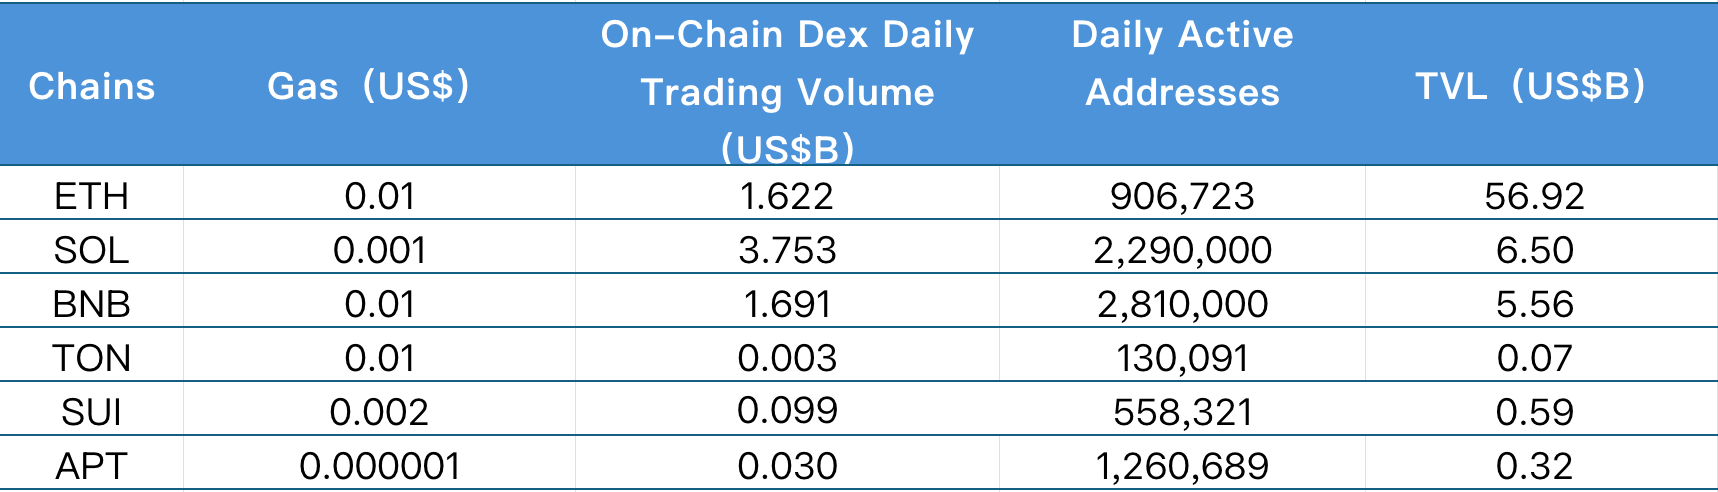
This section analyzes key data for major Layer 1 chains including ETH, SOL, BNB, TON, SUI, and APTOS, focusing on daily trading volume, daily active addresses, and transaction fees.
Data Source: CoinW Research, defillama, https://defillama.com
Data as of February 8, 2026
On-Chain DEX Daily Volume and Transaction Fees: On-chain DEX daily volume and transaction fees are core metrics for measuring public chain activity and user experience. In terms of on-chain DEX daily volume, all chains declined this week. BNB Chain ($1.691B) saw a slight decrease of 6.06%; followed by Solana ($3.753B, -20.32%) and Ton ($0.003B, -33.60%); Ethereum ($1.622B), Sui ($0.099B), and Aptos ($0.03B) experienced relatively larger declines of 50.85%, 50.63%, and 62.43%, respectively. Regarding transaction fees, BNB Chain ($0.01), Ton Chain ($0.01), and Aptos ($0.000001) remained flat compared to last week; Ethereum ($0.01), Solana ($0.001), and Sui ($0.002) decreased by 50%, 66.42%, and 24.04%, respectively.
Daily Active Addresses and TVL: Daily active addresses reflect the ecological participation and user stickiness of a public chain, while TVL reflects user trust in the platform. In terms of daily active addresses, only BNB Chain (2.81 million, +7.66%) and Ton (approximately 130,000, +8.3%) saw increases this week. All other chains declined: Ethereum (906,000, -23.0%), Solana (2.29 million, -13.26%), Sui (558,000, -13.84%), and Aptos (1.26 million, -19.18%). TVL declined overall this week, with BNB Chain ($5.56B, -7.74%), Ethereum ($56.92B, -4.98%), and Ton ($0.07B, -6.81%) experiencing relatively smaller declines; followed by Solana ($6.50B, -22.66%), Aptos ($0.32B, -11.39%), and Sui ($0.59B, -17.32%).
Layer 2 Related Data
According to L2Beat data, the total TVL of Ethereum Layer 2 is $31.73 billion, with an overall decrease of 5.78% this week compared to last week ($33.68 billion).
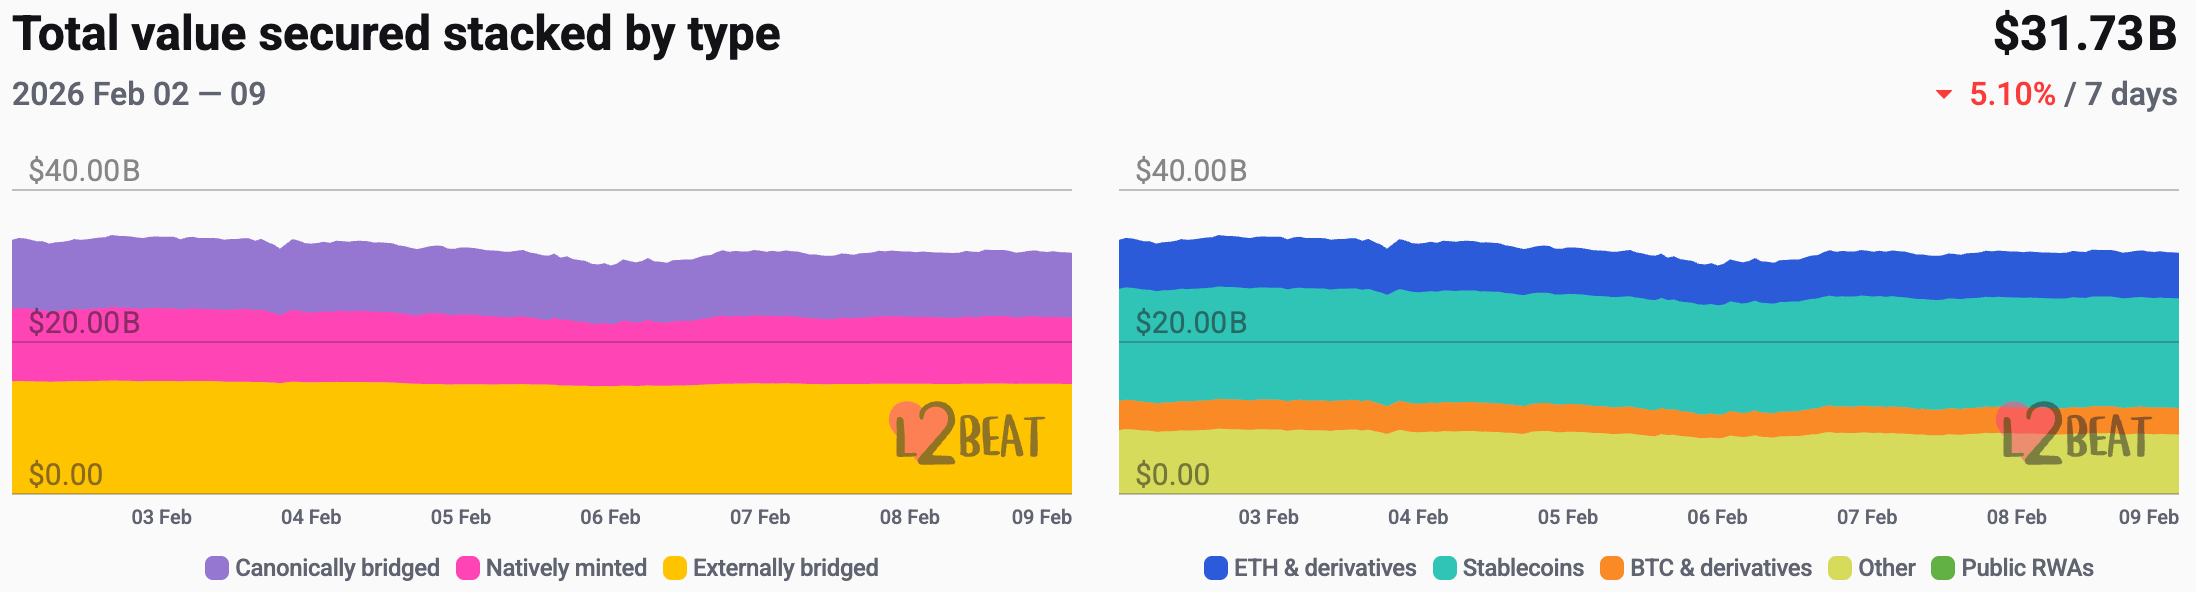
Data Source: L2Beat, https://l2beat.com/scaling/tvs
Data as of February 8, 2026
This week, Base and Arbitrum have market shares of 36.85% and 34.77%, respectively, ranking first and second. Base's market share has declined over the past week, while Arbitrum's has slightly increased.
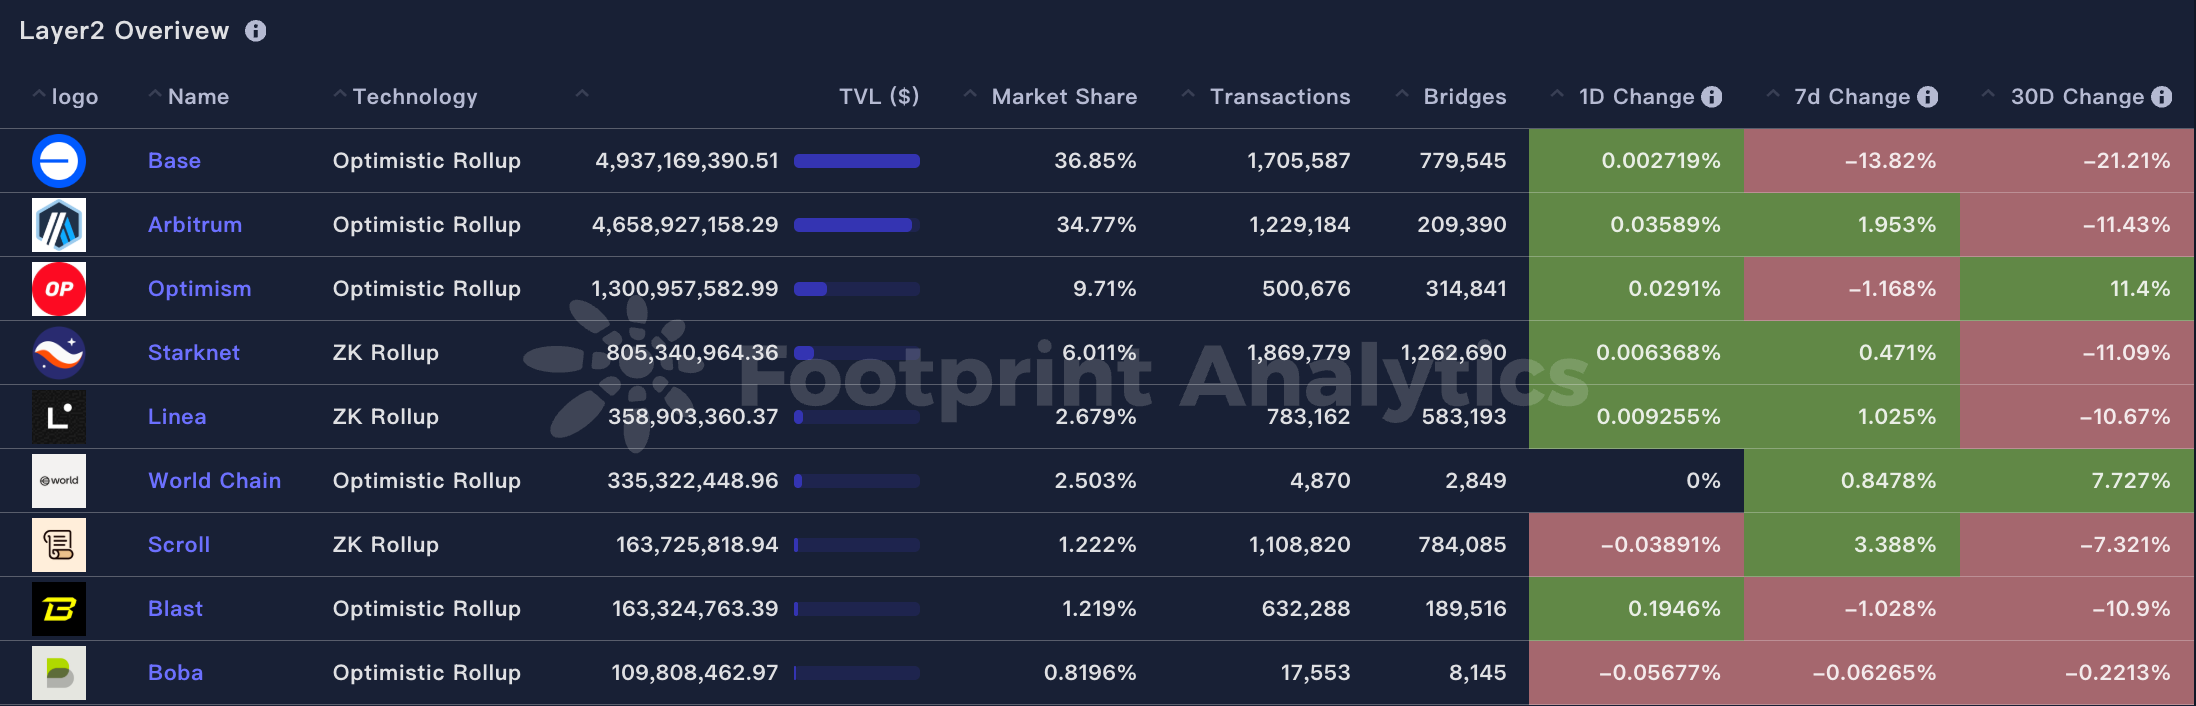
Data Source: footprint,


