
How Much Further Can Bitcoin Fall from $60,000? Three Scenarios to Project the Bottom
- Core Viewpoint: The article analyzes historical data to point out that the maximum drawdowns in Bitcoin's previous bear markets have shown a decreasing trend. Based on this pattern, it projects three possible bottom price scenarios for the current bear market, while emphasizing the importance of long-term holding and strategic investing.
- Key Elements:
- Historical data shows that the maximum drawdowns for Bitcoin's first four bear markets were 94%, 87%, 84%, and 77% respectively, exhibiting a pattern of decreasing by about 5-7 percentage points each cycle.
- Reasons for the narrowing drawdowns include a larger market cap base reducing volatility, institutional entry via ETFs providing a liquidity buffer, Bitcoin's evolution towards a mainstream asset, and the diminishing supply shock effect of halving cycles.
- Based on historical patterns, the bottom of this bear market could potentially occur around $44,100 (a 65% drop), $35,000-$37,800 (a 70-72% drop), or $25,000-$31,500 (a 75-80% drop) under three different scenarios.
- By comparing three investment cases, the article emphasizes that "holding on" is more important than "buying the exact bottom," and recommends dollar-cost averaging or phased buying/selling as suitable strategies for ordinary investors.
- It points out that bear markets are opportunities for wealth redistribution, and the true profit-makers are often investors who dare to build positions in phases and hold long-term when the market is in despair.
Original Author: Deep Tide TechFlow
In the early hours of February 6th, as Bitcoin broke below $60,000, panic swept through the entire crypto community. From its all-time high of $126,000 in October 2025, Bitcoin had already plunged by 52%.
But if you look back at Bitcoin's 15-year price history, you'll find a harsh truth: a 52% drop is historically just a "light drizzle."
The "Decline Code" of Bitcoin Bear Markets
Let's look at a set of data first:
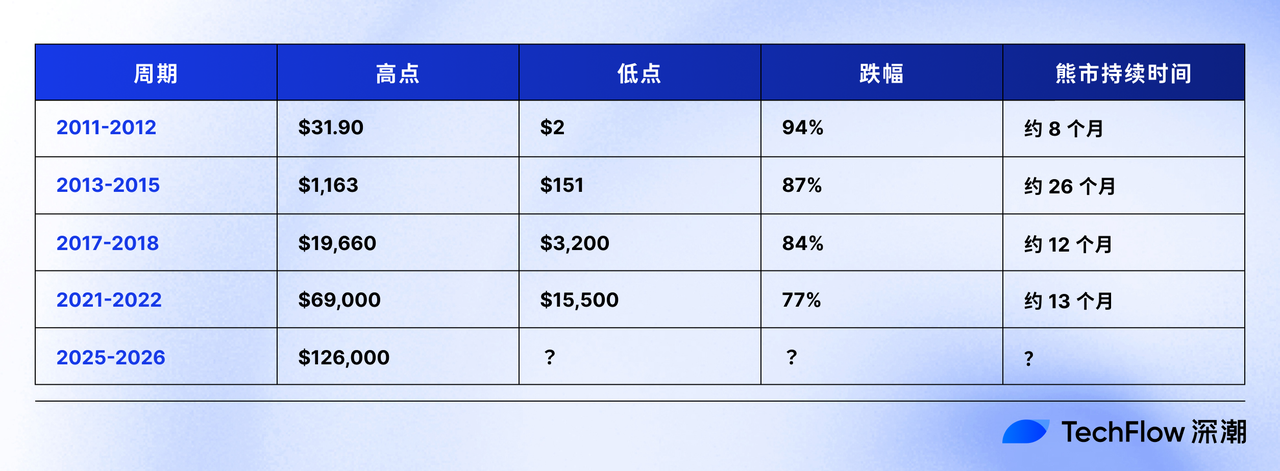
This table reveals a clear pattern: the maximum drawdown in each bear market has been decreasing.
From 94% to 87%, then to 84%, and 77%, Bitcoin's "bear market standard" has been narrowing by about 5-10 percentage points each cycle.
Looking at this decreasing trend more precisely:
- 2011→2013: Decrease of 7 percentage points (94%→87%)
- 2013→2017: Decrease of 3 percentage points (87%→84%)
- 2017→2021: Decrease of 7 percentage points (84%→77%)
On average, a decrease of about 5-7 percentage points per cycle.
Why?
Larger Market Cap Base Naturally Reduces Volatility
In 2011, Bitcoin's market cap was only tens of millions of dollars; a single "whale" selling could crash the price by 94%.
In 2026, even if Bitcoin halves from its peak to $60,000, its market cap still exceeds $1 trillion. To make a trillion-dollar asset drop another 30-40% requires selling pressure thousands of times greater than in 2011.
Institutional Entry Provides a "Liquidity Buffer"
Before 2018, Bitcoin holders were mainly retail investors and early miners. Once panic set in, everyone stampeded together with no "buyers" in sight.
After 2022, institutions like BlackRock, Fidelity, and Grayscale hold hundreds of thousands of Bitcoin through ETFs. These institutions don't panic sell due to a single crash; their presence acts as a "safety net" in the market.
According to Bloomberg data, as of the end of January 2026, the total holdings of US spot Bitcoin ETFs exceeded 900,000 BTC, valued at over $70 billion. The "lock-up effect" of these holdings directly reduces the market's sellable supply.
Bitcoin's Evolution from "Speculative Asset" to "Asset Class"
From 2011-2013, Bitcoin was a toy for geeks, with prices driven entirely by sentiment.
From 2017-2021, Bitcoin began to be seen as "digital gold," but still lacked a clear valuation anchor.
After 2025, with Bitcoin ETF approvals, the GENIUS Act promoting stablecoin legislation, and Trump's proposed "strategic reserve" plan—regardless of whether these policies fully materialize—Bitcoin has transformed from a "fringe asset" to "part of the mainstream financial system."
The result of this evolution is reduced volatility.
The Diminishing Supply Shock of Halving Cycles
In the past, Bitcoin's price was primarily influenced by the 4-year halving cycle, where new supply is reduced by 50% every four years.
During the first halving in 2012, daily new issuance dropped from 7,200 to 3,600 coins, creating a massive supply shock.
After the fourth halving in 2024, daily new issuance dropped from 900 to 450 coins. While the percentage reduction is the same, the absolute decrease in quantity is much smaller, and its impact on the market is diminishing.
The "deflationary effect" from the supply side is weakening, and the "speculative frenzy" on the demand side is also cooling. Together, these factors lead to narrowing volatility.
If History Repeats, Where is the "Bottom" This Time?
Based on the historical pattern of "decrease per cycle," we can project three scenarios:
Scenario 1: Optimistic Assumption – Drawdown Narrows to 65%
If the maximum drawdown this cycle is 65% (a 12-percentage-point decrease from the previous cycle's 77%, slightly above the historical average decrease):
Bottom Price = 126,000 × (1 - 65%) = $44,100
From $60,000 to $44,100, there is still a 26% downside potential.
Supporting Reasons:
Institutional holdings are at a record high; ETFs provide strong "buying support."
Although the Fed is hawkish, the market has already brought forward its 2026 rate cut expectations from July to June.
Trump's White House crypto summit on March 7th may release favorable policies.
Although stablecoins show negative growth, TVL (Total Value Locked) remains stable above $230 billion.
Risk Factors:
If high-leverage holders like Strategy are forced to sell, it could trigger a chain reaction.
If Trump's "strategic reserve" promise remains unfulfilled, the market may lose patience.
If you believe in this scenario: You should start accumulating in batches below $50,000 and increase your buying near $45,000.
Scenario 2: Neutral Assumption – Drawdown of 70-72%
If the maximum drawdown this cycle is 70-72% (strictly following the historical pattern of "decreasing by 5-7 percentage points"):
Bottom Price (70%) = 126,000 × (1 - 70%) = $37,800
Bottom Price (72%) = 126,000 × (1 - 72%) = $35,280
From $60,000 to $35,280-$37,800, there is still a 37-41% downside potential.
Supporting Reasons:
Perfectly aligns with historical patterns, neither overly optimistic nor pessimistic.
The complexity of the current macro environment (rate cut expectations + QT concerns) is comparable to 2018.
$35,000-$38,000 corresponds to Bitcoin's "200-week moving average," which has historically been strong support.
Risk Factors:
If the US economy falls into recession, all risk assets will face indiscriminate selling.
If the AI bubble bursts, a tech stock crash could drag Bitcoin down.
If you believe in this scenario: You should save your main capital for below $40,000. The $35,000-$45,000 range is your "heavy accumulation zone."
Scenario 3: Pessimistic Assumption – Drawdown Returns to 75-80%
If this time is "truly different," and a structural market collapse causes the drawdown to revert to the 2017-2022 average:
Bottom Price (75%) = 126,000 × (1 - 75%) = $31,500
Bottom Price (80%) = 126,000 × (1 - 80%) = $25,200
From the current $70,000 to $25,200-$31,500 would be a 50% massacre.
Supporting Reasons:
The "triple kill" on February 6th (stocks, gold, and Bitcoin falling simultaneously) shows Bitcoin's "safe-haven attribute" has completely failed.
While ETFs have absorbed a large amount of supply, they also mean institutions can "sell with one click."
The Trump administration's tariff policies could trigger a global trade war, potentially leading to a worldwide recession.
Talent drain in the crypto industry and VC exits (e.g., Multicoin co-founder Kyle Samani announcing his departure) indicate a collapse in industry confidence.
If you believe in this scenario: You should exit your positions now, wait for a complete crash below $30,000, or keep only 10-20% of your capital to "take a gamble" while withdrawing the rest to wait and see.
Don't Fear Missing Out
Some people always worry: what if I miss the buying opportunity at the bottom of this bear market?
The answer is simple: chase the rally or wait for the next cycle.
Cryptocurrency is not the only chance for a turnaround in your life. If you think it is, you've already lost.
In 2015, those who missed $150 still had a chance at $3,200 in 2018.
In 2018, those who missed $3,200 still had a chance at $15,000 in 2022.
But the prerequisite is: you must survive until the next cycle.
Don't leave this market completely just because one all-in bet failed.
Furthermore, most people only care about "at what price to buy" but ignore "when to sell."
Here are three case studies:
Case 1:
Old Zhang heavily bought Bitcoin at $3,200 in December 2018. In June 2019, when Bitcoin rose to $13,000, Old Zhang thought "the bull market is here" and didn't sell. In December 2019, when Bitcoin fell back to $7,000, Old Zhang thought "it's over" and sold at a loss.
Final outcome: less than 1x profit, washed out of the market, missing the $69,000 peak in 2021.
Case 2:
Xiao Li also bought at $3,200, but he set a rule for himself: "I won't sell until it reaches $50,000." He remained unmoved by all the volatility from 2019-2020. In April 2021, when Bitcoin rose to $63,000, Xiao Li sold 50%, locking in a 15x profit. He held the remaining 50% until the $69,000 peak in November 2021 before finally selling.
Outcome: average profit of 18x.
Case 3:
Old Wang started a monthly DCA (Dollar-Cost Averaging) of $1,000 in December 2018, regardless of price fluctuations. He persisted for 3 years, stopping the DCA in December 2021.
His average cost was about $12,000 (cheaper buys early on, more expensive later). In November 2021, when Bitcoin was at $69,000, he sold everything, profiting about 4.7x.
Outcome: Although not as good as Xiao Li's, he didn't need to "time the market" at all, making it the simplest strategy to execute.
These three cases tell us that buying at the exact bottom isn't important; holding on is.
If you don't start with the mindset of holding for life, then set a "profit-taking plan" in advance. DCA may not be sexy, but it's most suitable for ordinary people. It's nearly impossible for most to buy at the absolute bottom and sell at the absolute top. Accumulating and selling in batches is always a relatively better method.
Final Thoughts: Bear Markets Are the Poor Man's Opportunity for a Turnaround
In 2011, those who bought Bitcoin at $2 have now achieved a 30,000x return (even calculated at the recent low of $60,000).
In 2015, those who bought at $150 have a 400x return.
In 2018, those who bought at $3,200 have an 18.75x return.
In 2022, those who bought at $15,000 have a 4x return.
Every bear market is a redistribution of wealth.
Those who frantically chased the highs are washed out during the bear market; those who panic-sell at the bottom hand their筹码 over to others.
And those who truly make money are always the ones who dare to accumulate in batches when everyone else is in despair.
As long as you believe that Bitcoin's price will recover and go even higher.
In 2018, when Bitcoin fell to $3,200, some said: "Bitcoin is dead."
In 2022, when Bitcoin fell to $15,000, many exclaimed that the crypto apocalypse had arrived.
In February 2026, as Bitcoin broke below $60,000, the whole world is asking: "Is this time really different?"
If you believe "history repeats itself," then now and the next 6-12 months are one of the few times in your life to buy "the future" at a "relatively low price."
Whether you believe it or not is your choice.


