
In-depth Analysis of the Efficacy Divergence and Value Capture in Crypto Protocol Buyback Mechanisms
- Core View: The large-scale buybacks by crypto protocols in 2025 have not universally translated into token value appreciation. Their success or failure hinges on the "Net Flow Efficiency Ratio" (NFER)—whether the buyback capital can outweigh structural inflation and unlock selling pressure. This has led to a divergence in market strategies: mature protocols capture value through buybacks, while growth-stage protocols are shifting towards allocating funds to growth and network development.
- Key Elements:
- Crypto protocol buyback expenditures exceeded $1.4 billion in 2025, but market performance was polarized. Hyperliquid achieved multiple-fold token growth with over $640 million in buybacks, while Jupiter, Helium, and others saw minimal effects despite investing tens of millions of dollars.
- The "Net Flow Efficiency Ratio" (NFER), which determines buyback efficacy, shows that only when the buyback capital flow rate significantly exceeds the token unlock and inflation flow rates (NFER > 1.0) can it effectively support the price. Otherwise, it may merely serve as exit liquidity.
- Hyperliquid's success stems from its "fee conversion" model (approximately 97% of revenue used for buybacks) forming a positive flywheel with product growth, achieving net deflation.
- Facing massive token unlock pressure (NFER < 1.0), Jupiter and Helium's buyback funds were unable to counteract structural selling pressure. They shifted away from buybacks in early 2026, redirecting funds towards user subsidies and growth incentives.
- The Pump.fun case demonstrates that in the absence of long-term lock-up mechanisms and holding incentives, aggressive buybacks (investing $138 million) can become an exit channel for large holders, leading to an 80% plunge in token price.
- The advancement of the U.S. "Digital Asset Market Clarity Act" and the "GENIUS Act" provides new pathways for compliant supply management of "digital commodities."
- Industry strategies are diverging: Mature protocols (e.g., Optimism) leverage stable revenue for buybacks, while growth-stage protocols focus more on using cash flow to build network effect moats.
2025 marks the "Industrial Revolution" of fiscal discipline in the cryptocurrency market. This year, on-chain protocols demonstrated unprecedented cash flow generation capabilities and, through total buyback expenditures exceeding $1.4 billion, attempted to reshape the underlying logic of tokenomics. This figure represents exponential growth compared to previous years, driven not only by the maturation of DeFi protocol business models but also by a structural shift in the US regulatory environment—particularly the advancement of the Digital Asset Market Clarity Act and the GENIUS Act, which provide a compliant path for the supply management of "digital commodities."
However, capital investment did not lead to equal value capture. This article dissects the extreme polarization within the 2025 buyback market: on one hand, Hyperliquid achieved several-fold token price growth with a buyback scale exceeding $640 million (nearly 46% of the total market), establishing "net deflation" as the core anchor for asset pricing; on the other hand, Jupiter and Helium, despite investing tens of millions of dollars, were unable to counter structural inflation in terms of magnitude, ultimately leading to discussions about halting their buyback plans in early 2026 and pivoting towards growth incentives. Furthermore, the case of Pump.fun reveals how aggressive buybacks can become exit liquidity in the absence of long-term lock-up mechanisms.
This article employs the "Net Flow Efficiency Ratio" (NFER) as a key metric for evaluating buyback efficacy. Data indicates that buybacks can effectively translate into secondary market prices only when the buyback capital flow rate significantly exceeds the token unlock and inflation flow rates (NFER > 1.0). Conversely, when NFER < 1.0, buyback funds merely act as a "buffer cushion" and may even accelerate whale sell-offs.
As Helium and Jupiter shift towards user subsidies, we observe Web3 protocols undergoing a divergence similar to the "value stocks vs. growth stocks" dynamic in traditional equity markets: mature protocols capture value through the dividend-like properties of buybacks, while growth-stage protocols need to build network effect moats through capital expenditures.
1. Summary of 2025 Top Crypto Protocol Buybacks
In 2025, buybacks primarily fell into two models:
- Fee Conversion Model: Examples include Hyperliquid and Aave. This model directly uses a portion of protocol revenue to purchase tokens. It offers high transparency and is typically proportional to protocol usage.
- Treasury/Revenue Burn Model: Examples include Helium and Pump.fun. The project uses earned revenue to buy back and burn tokens, or lock them up. This is viewed more as a deflationary tool.
Notably, Hyperliquid dominated with over $640 million in buybacks, accounting for nearly half the total, earning the title of the year's "Buyback King." DeFi blue-chips like MakerDAO (Sky) and Aave remained steady, consistently executing buybacks in the tens of millions of dollars. The Solana ecosystem was highly active, with projects like Jupiter, Raydium, and Pump.fun contributing significant buyback volumes, albeit accompanied by substantial controversy.
The actual effectiveness of buyback strategies exhibited extreme polarization. On one hand, projects like Hyperliquid (HYPE) and Aave (AAVE) achieved relative price stability through buybacks, experiencing wide fluctuations in line with Bitcoin rather than a precipitous decline. On the other hand, projects like Jupiter (JUP) and Helium (HNT), despite massive investments ($70 million and millions in monthly revenue, respectively), faced steep price drops or market indifference.
Analyzing these projects reveals that buybacks alone, if unable to overwhelm structural selling pressure in magnitude or lacking a strong tie to protocol growth, can become "exit liquidity" for early investors or teams. Of course, this might be the very purpose for some projects initiating buybacks.
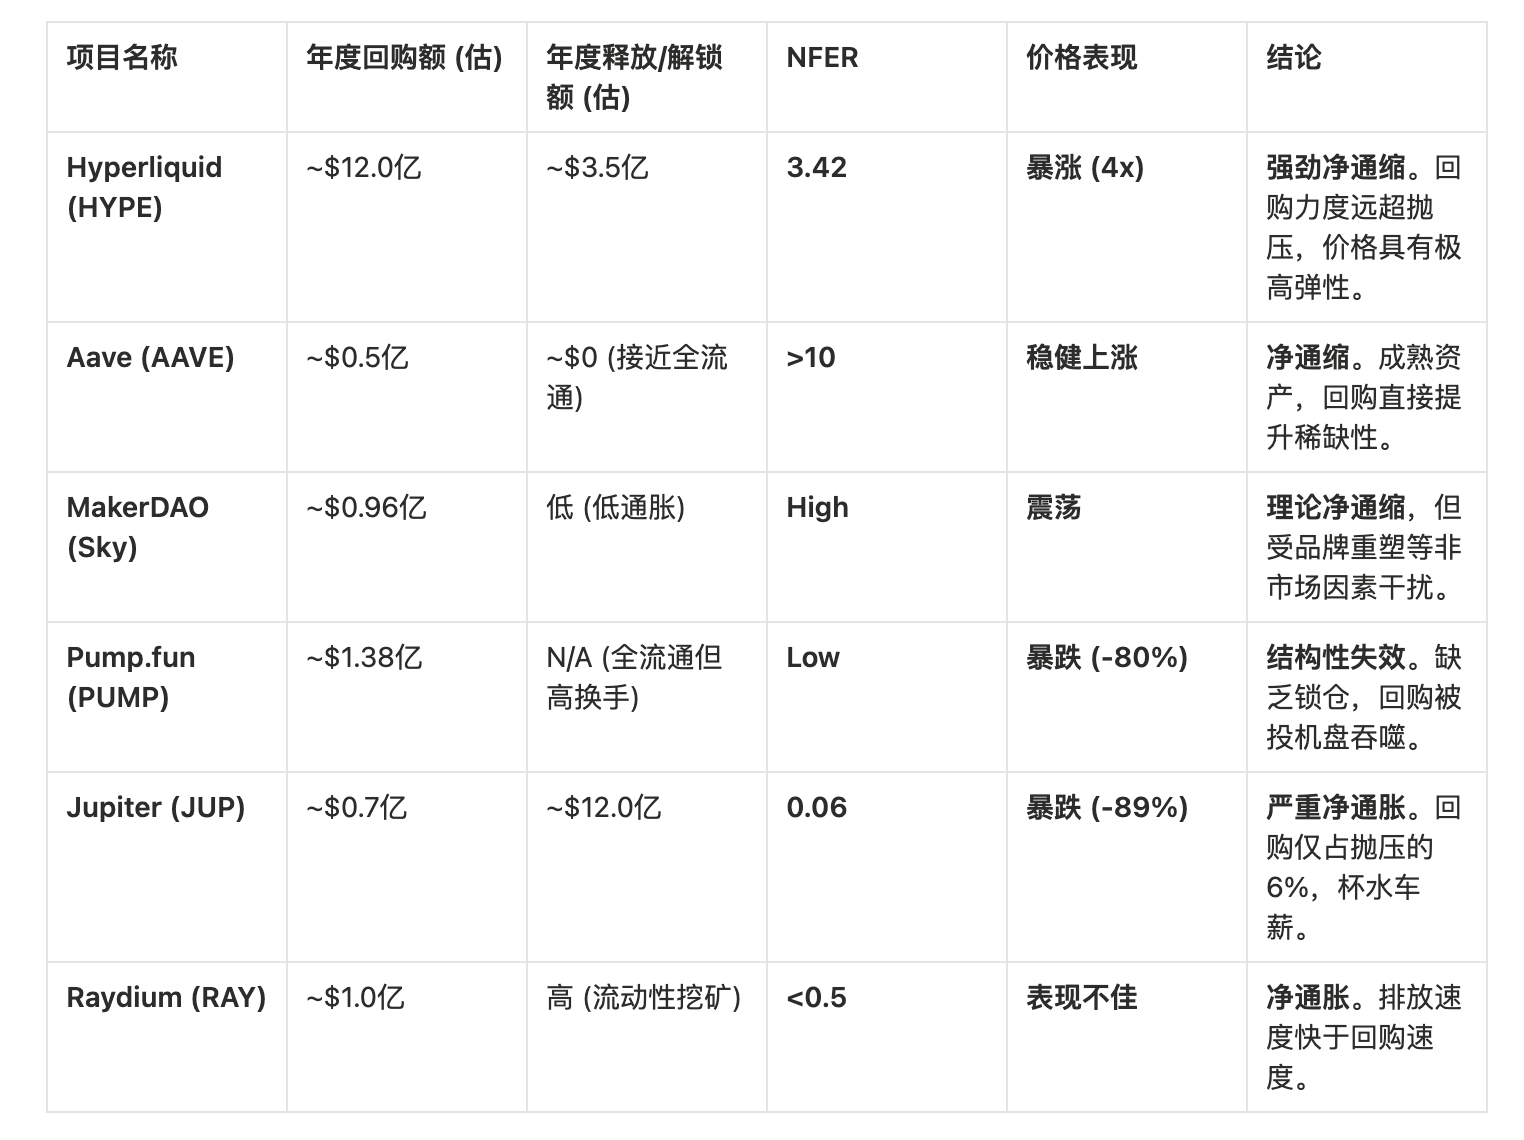
From the data in the table, we can conclude:
- NFER > 1.0 is a necessary condition for price appreciation. Only when buyback funds are sufficient to cover all structural sell-side pressure (miners, team, early investors) will prices rise driven by marginal buy-side demand.
- NFER < 0.1 signifies that buybacks are purely wasteful. In such cases, stopping buybacks and pivoting to fundamental development is a rational financial decision.
In 2025, there was no simple linear positive correlation between the size of buyback amounts and token price performance.
1.1 Stable Performers: Mechanism and Growth in Resonance
Hyperliquid (HYPE) • Buyback Scale: ~$644.6 million. • Mechanism: Assist Fund mechanism, using approximately 97% of exchange fees for buybacks. • Performance: Price performed exceptionally strong in 2025, even driving a revaluation of the entire Perp DEX sector. • Success Reason: Extremely high buyback ratio (almost full revenue buyback) coupled with explosive product growth (market share capture from CEXs), creating a "positive flywheel."
Aave (AAVE) • Buyback Scale: Annualized ~$50 million (weekly $1 million). • Mechanism: Uses the "Fee Switch" to allocate protocol excess reserves for purchasing AAVE. • Performance: Price rose steadily and showed significant resilience in the second half of 2025.
Bitget Token (BGB) • Buyback Scale: Quarterly burns. Q1 2025 burned approximately 1.58 million BGB equivalent value (referencing the BNB model). Bitget burned 30 million BGB (~$138 million) in Q2 2025. • Mechanism: Strongly tied to centralized exchange business, with BGB empowered as the Gas token for the Layer 2 (Morph). • Performance: Price reached a new all-time high (ATH) of $11.62. • Success Reason: Beyond scarcity from buybacks, the more critical factor is utility expansion. BGB evolved from a simple exchange point system to a public chain Gas token.
1.2 Controversial Group: Futile Struggle Against the Trend
Pump.fun (PUMP) • Buyback Scale: ~$138.2 million. • Mechanism: 100% of daily revenue used for buyback and burn. • Performance: Price down ~80% from ATH. • Failure Reason: A classic case of "using buybacks to feed whales." Due to highly concentrated token distribution, buyback funds became a liquidity exit for large holders. Additionally, meme sector hype shifts extremely fast, making infrastructure tokens difficult to capture sustained value.
Sky (formerly MakerDAO) (SKY) • Buyback Scale: ~$96 million. • Mechanism: Smart Burn Engine. • Performance: Neutral to weak, falling short of expectations. • Failure Reason: Brand rebranding chaos. The migration process from MKR to SKY (1:24,000 split) and concerns over the "freeze function" of the USDS stablecoin created uncertainty. Despite the large buyback amount, governance-level uncertainty suppressed buying confidence.
Raydium (RAY) • Buyback Scale: ~$100.4 million. • Mechanism: A portion of trading fees used for buyback and burn. • Performance: Highly volatile, failing to establish a long-term uptrend. • Reason: As an AMM DEX, Raydium faces extremely severe liquidity mining emissions. To attract liquidity, the protocol must continuously issue RAY. The buyback buy-side pressure appears insufficient against the massive inflationary sell-side pressure.
2. Classification and Evolution of Value Capture Mechanisms
In the practice of 2025, we observed that "buybacks" are not a single model but have evolved into multiple complex variants. Each model's mechanism of action within tokenomics and market feedback is distinctly different. Next, we delve deeper into buyback mechanisms to explore what scale of projects are suitable for which buyback mechanism, or whether they are suitable for initiating buybacks at all.
2.1 Fee Conversion and Accumulation Model
Representative Cases: Hyperliquid, Aave
The core of this model lies in directly converting real revenue generated by the protocol into native tokens and removing them from circulation through burning or locking.
- Hyperliquid's "Black Hole Effect": Hyperliquid designed an on-chain fund called the Assistance Fund, which automatically receives approximately 97% of the trading fees generated by the exchange.
- Mechanism Details: This fund continuously purchases HYPE tokens on the secondary market. By the end of 2025, the fund had accumulated nearly 30 million HYPE, valued at over $1.5 billion.
- Market Psychology: This model creates a visible, continuously growing buy-side pressure. Market participants not only see the current buying but also anticipate future increasing buying pressure as trading volume grows. This expectation propelled HYPE to new heights of value discovery.
- Aave's "Treasury Optimization": The Aave DAO, through governance proposals, allocates approximately $50 million in annual protocol revenue to repurchase AAVE.
- Strategy Difference: Aave is not in a hurry to burn these tokens but treats them as "productive capital." The repurchased AAVE is used to replenish the ecosystem's safety module or as future incentive reserves. While this approach doesn't immediately reduce the total supply, it significantly decreases the circulating supply and enhances the protocol's risk resilience.
2.2 Aggressive Burn Model
Representative Cases: Pump.fun, MakerDAO (Sky), Raydium
This is the most traditional deflationary model, aiming to increase per-token value by permanently reducing supply.
- Pump.fun's "Zero-Sum Game": As a Memecoin launchpad, Pump.fun used its entire revenue (once reaching millions of dollars daily) to buy back and burn PUMP tokens.
- Limitations: Despite burning $138 million worth of tokens, the PUMP price plummeted by 80%. The reason lies in PUMP's lack of lock-up mechanisms and long-term utility, making buyback funds an excellent exit channel for speculators. This proves that pure deflation cannot counter selling pressure in the absence of a "reason to hold."
- Sky (MakerDAO): Uses the "Smart Burn Engine" to purchase and burn SKY with the surplus generated from over-collateralization. Although the mechanism is robust, during the chaotic period of brand rebranding, the benefits of burning were overshadowed by governance-level uncertainty.
2.3 Trust Lock-Up Model
Representative Case: Jupiter
Jupiter attempted a middle path to balance deflation and reserves: repurchasing tokens but not immediately burning them, instead locking them into a long-term trust called the "Litterbox."
- Mechanism Design: Jupiter committed to using 50% of fees to repurchase JUP and lock it for 3 years.
- Market Feedback: Ineffective. The market perceived the "3-year lock-up" as "delayed inflation" rather than "permanent deflation." Facing massive unlock pressure, even with tokens temporarily out of circulation, the market tended to price in future selling pressure upfront.
3. Net Flow Theory: The Mathematical Essence of Buyback Success or Failure
By comparing Hyperliquid, Aave with Jupiter, and Pump.fun, we can distill three core variables determining buyback success or failure: Net Deflation Rate, Market Game Psychology, and Project Lifecycle Stage.
3.1 Variable One: Net Deflation Rate (Buyback Volume vs. Emission Volume)
Whether buybacks can push prices higher depends not on the absolute amount of buybacks but on the "net flow." $\text{Net Flow} = \text{Buyback Burn Volume} - (\text{Team Unlocks} + \text{Investor Unlocks} + \text{Staking Emissions})$
Hyperliquid was the only top-tier protocol in 2025 to achieve "net deflation."
- Buyback Side: Annualized buyback amount as high as $1.2 billion (extrapolated from Q3/Q4 data).
- Release Side: For most of 2025, HYPE was in a phase of low circulation and low release. Although it faced an unlock of approximately 9.92 million tokens (~3.66% of circulating supply) for core contributors in November, this selling pressure was completely absorbed relative to its massive buyback volume.
- Calculation Result:
- $\text{Net Flow} \approx \$100M/\text{month (buy-side)} - \$35M/\text{month (unlock sell-side)} = +\$65M/\text{month (net buy-side)}$
3.2 Sailing Against the Wind: Jupiter's Inflation Trap
Jupiter demonstrates the powerlessness of buybacks when confronted with massive inflation.
- Buyback Side: Annual expenditure of approximately $70 million.
- Release Side: JUP faces an extremely steep unlock curve. In early 2026, JUP faced unlock pressure of approximately $1.2 billion, with an additional linear unlock of about 53 million tokens (~$11 million) per month.
- Arithmetic Result:
- $\text{Net Flow} \approx \$6M/\text{month (buy-side)} - \$10M+/\text{month (unlock sell-side)} = -\$4M/\text{month (net sell-side)}$
- Market Game Theory: Under such a massive negative net flow, the $70 million in buyback funds essentially became "exit liquidity" for early investors and team unlocking tokens. Market participants recognized this, leading them to sell rather than hold during buybacks. Solana co-founder Anatoly pointed this out: protocols should accumulate cash and conduct a one-time large-scale buyback in the future, forcing current unlocking tokens to trade at a "future expected price," rather than directly funding the unlock sell-side as is happening now.
4. Strategic Pivot: From "Price Support" to "Infrastructure"
In early 2026, with Jupiter and Helium successively announcing the cessation or reevaluation of their buyback plans, the industry underwent profound reflection. This trend indicates that Web3 projects are shifting from simple "financial engineering" (pumping prices via buybacks) back to the logic of "business operations" (investing in growth).
4.1 Helium (HNT): User Acquisition Cost Outperforms Buybacks
On January 3rd, Helium founder Amir Haleem announced the cessation of HNT buybacks, with a simple and direct rationale: "The market doesn't care if the project is buying back."
- Data Context: Helium Mobile business reached monthly revenue of $3.4 million. Previously, a portion of this money was used for HNT buybacks, but the token price remained weak.
- New Strategy: Redirecting these funds towards hardware subsidies, new user acquisition, and network coverage expansion.
- Logic Reconstruction: For DePIN projects, network effects (node count, user scale) are their core moat. Lowering user barriers through subsidies can attract more active users, who will continuously consume data credits in the future, generating endogenous, rigid token burn demand. This "organic burn" provides far stronger value support than the project's artificial "buyback burn."
- Return on Investment (ROI) Analysis: $1 million in buybacks might only stabilize the price for a few days; but $1 million used for subsidies could bring in 10,000 long-term paying users, whose lifetime value (LTV) would far exceed $1 million.
4.2 Jupiter (JUP): Growth Incentives vs. Capital Return
Jupiter co-founder Siong Ong similarly initiated a community discussion about stopping buybacks, proposing to redirect the $70 million funds towards "growth incentives."
- Core Argument: Buybacks are inefficient capital allocation when tokens are still in a high inflation phase. Funds should be used to build moats, such as developing new features (like JupUSD), incentivizing developers, or subsidizing user trading slippage


