
85% of transaction volume is controlled by thousands of wallets: The hidden centralized landscape of stablecoin payments
- 核心观点:稳定币支付使用量增长,但高度集中。
- 关键要素:
- 稳定币支付占交易量47%,P2P仅占24%。
- 前1000钱包贡献约84%的交易量。
- 支付交易与智能合约交易量占比约50:50。
- 市场影响:揭示支付真实采用情况,挑战去中心化叙事。
- 时效性标注:中期影响。
Original author: Artemis
Original article translated by: Deep Tide TechFlow
This report provides an empirical analysis of stablecoin payment usage, covering peer-to-peer (P2P), business-to-business (B2B), and peer-to-business (P2B/B2P) transactions.
This report conducts an empirical analysis of stablecoin payment usage, examining transaction patterns in peer-to-peer (P2P), business-to-business (B2B), and peer-to-business (P2B/B2P) transactions. We utilize the Artemis dataset, which provides metadata about wallet addresses, including geolocation estimates, institutional ownership tags, and smart contract identifiers. Transactions are categorized based on the characteristics of the sender and receiver wallets. The analysis focuses on the Ethereum network, which carries approximately 52% of the global stablecoin supply.
We primarily studied two mainstream stablecoins: USDT and USDC, which together account for 88% of the market share. Despite the significant increase in stablecoin adoption and regulatory attention over the past year, a key question remains unanswered: how does the actual use of stablecoins in payments compare to other activities? This report aims to reveal the main drivers of stablecoin payment adoption and provide insights for predicting future trends.
1. Background
In recent years, the adoption of stablecoins has grown significantly, with a supply reaching $200 billion and monthly raw transaction volume exceeding $4 trillion. Although blockchain networks provide a completely transparent record of transactions, and all transactions can be analyzed, transaction and user analysis remains extremely difficult due to the anonymity of these networks and the lack of information about the purpose of transactions (e.g., domestic payments, cross-border payments, transactions, etc.).
Furthermore, the use of smart contracts and automated transactions on networks like Ethereum further complicates the analysis, as a single transaction may involve interactions with multiple smart contracts and tokens. Therefore, a key unresolved issue is how to assess the current proportion of stablecoin usage in the payments space relative to other activities such as transactions. While many researchers are working to address this complex problem, this report aims to provide additional methods for evaluating stablecoin usage, particularly for payments.
In general, there are two main approaches to assessing stablecoin usage, especially for payments.
The first approach is the filtering approach, which uses raw blockchain transaction data and filters out noise to more accurately estimate stablecoin payment usage.
The second approach is to investigate major stablecoin payment providers and estimate stablecoin activity based on their disclosed payment data.
Visa, in collaboration with Allium Labs, developed the Visa Onchain Analytics Dashboard, which employs the first approach. They use filtering techniques to reduce noise in the raw data, providing clearer information on stablecoin activity. Research shows that after filtering the raw data, the overall monthly stablecoin trading volume decreased from approximately $5 trillion (total trading volume) to $1 trillion (adjusted trading volume). If only retail trading volume (transactions under $250) is considered, the trading volume is only $6 billion. We used a similar filtering method to the Visa Onchain Analytics Dashboard, but our approach focuses more on explicitly identifying transactions for payment purposes.
The second method, based on company survey data, has been applied in the "Fireblocks 2025 Stablecoin Status Report" and the "Stablecoin Payments from Zero Report." These two reports utilize disclosures from major companies in the blockchain payments market to estimate the direct use of stablecoins in payments. In particular, the "Stablecoin Payments from Zero Report" provides an overall estimate of stablecoin payment transaction volume, categorizing these payments into B2B (business-to-business), B2C (business-to-consumer), and P2P (peer-to-peer) categories. The report shows that as of February 2025, the total annual settlement amount was approximately $72.3 billion, the majority of which were B2B transactions.
The main contribution of this study is the application of data filtering methods to estimate the usage of stablecoins in on-chain payments. The results reveal stablecoin usage and provide more accurate estimates. Furthermore, we offer researchers guidance on using data filtering methods to process raw blockchain data, reduce noise, and improve estimations.
2. Data
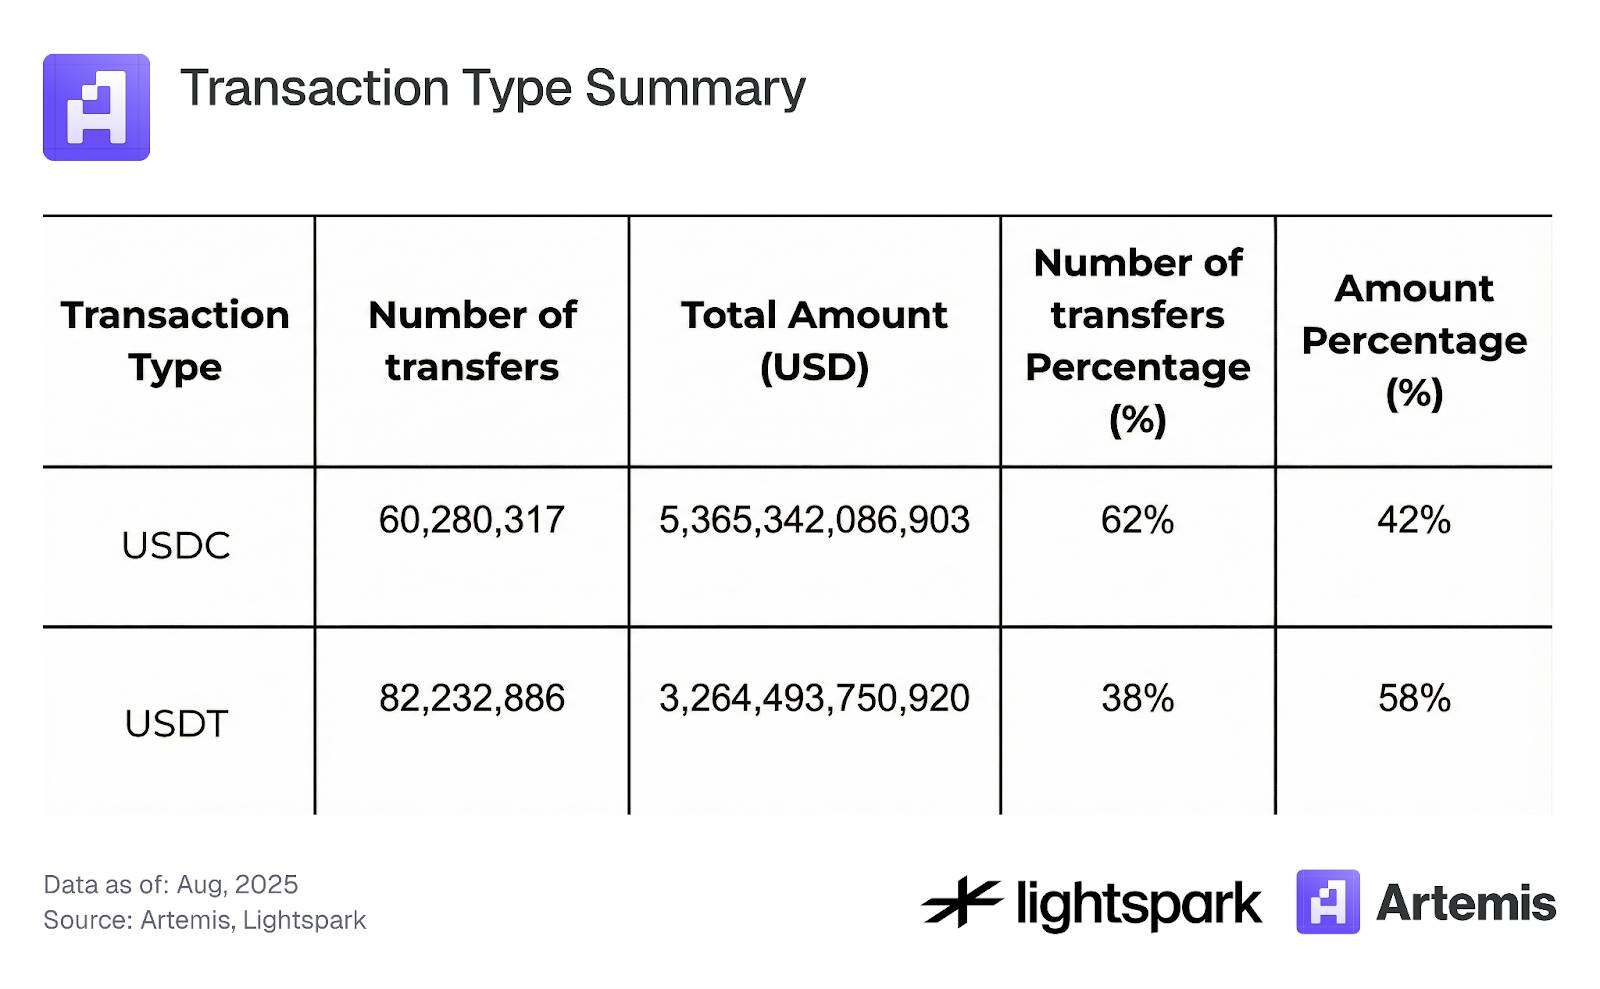
Our dataset covers all stablecoin transactions on the Ethereum blockchain from August 2024 to August 2025. The analysis focuses on transactions involving the two main stablecoins, USDC and USDT. These two stablecoins were chosen because of their high market share and strong price stability, thus reducing noise in the analysis process. We only focus on transfer transactions, excluding mint, burn, or bridge transactions. Table 1 summarizes the overall characteristics of the dataset used in our analysis.
Table 1: Summary of Transaction Types
3. Methods and Results
In this section, we detail the methodology used to analyze stablecoin usage, focusing on payment transactions. First, we filter the data by distinguishing between transactions involving interactions with smart contracts and transactions representing transfers between EOAs (External Accounts), classifying the latter as payment transactions. This process is detailed in Section 3.1. Subsequently, Section 3.2 explains how to further categorize payment transactions into P2P, B2B, and internal B-type transactions using EOA account tagging data provided by Artemis. Finally, Section 3.3 analyzes the concentration of stablecoin transactions.
3.1 Stablecoin Payments (EOA) and Smart Contract Transactions
In the decentralized finance (DeFi) space, many transactions involve interactions with smart contracts and combine multiple financial operations within a single transaction, such as exchanging one token for another through multiple liquidity pools. This complexity makes it more difficult to analyze stablecoin usage solely for payment purposes.
To simplify analysis and improve the ability to tag payments on stablecoin blockchain transactions, we define a stablecoin payment as any transaction in which ERC-20 stablecoins are transferred from one EOA address to another (excluding minting and burning transactions). Any transaction not tagged as a payment will be classified as a smart contract transaction, including all transactions involving interaction with smart contracts (e.g., primarily DeFi transactions).
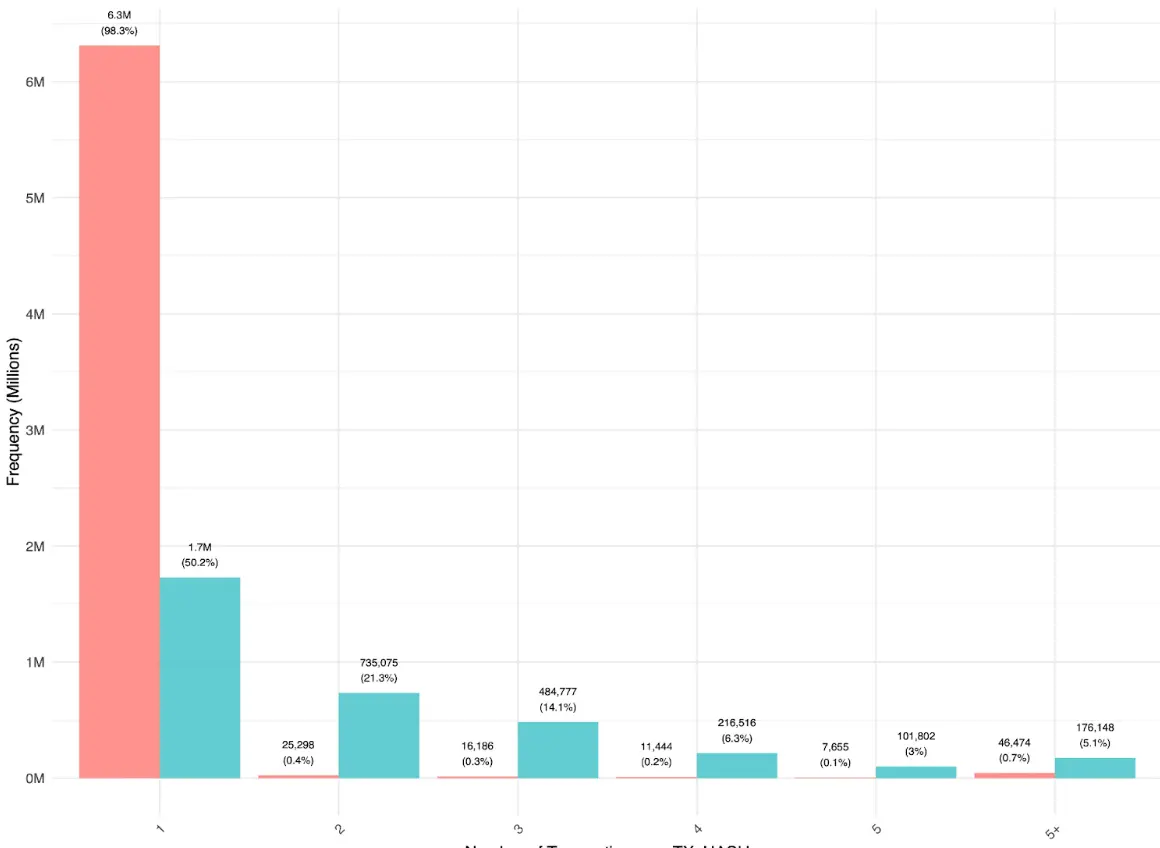
Figure 1 shows that most user-to-user payments (EOA-EOA) are completed directly, with each transaction hash corresponding to only one transfer. Some multi-EOA-EOA transfers within the same transaction hash are primarily completed through aggregators, indicating that the use of aggregators in simple transfers is still relatively rare. In contrast, the distribution of smart contract transactions is different, containing more multi-transfer transactions. This suggests that in DeFi operations, stablecoins typically circulate between different applications and routers before ultimately returning to the EOA account.
Figure 1:
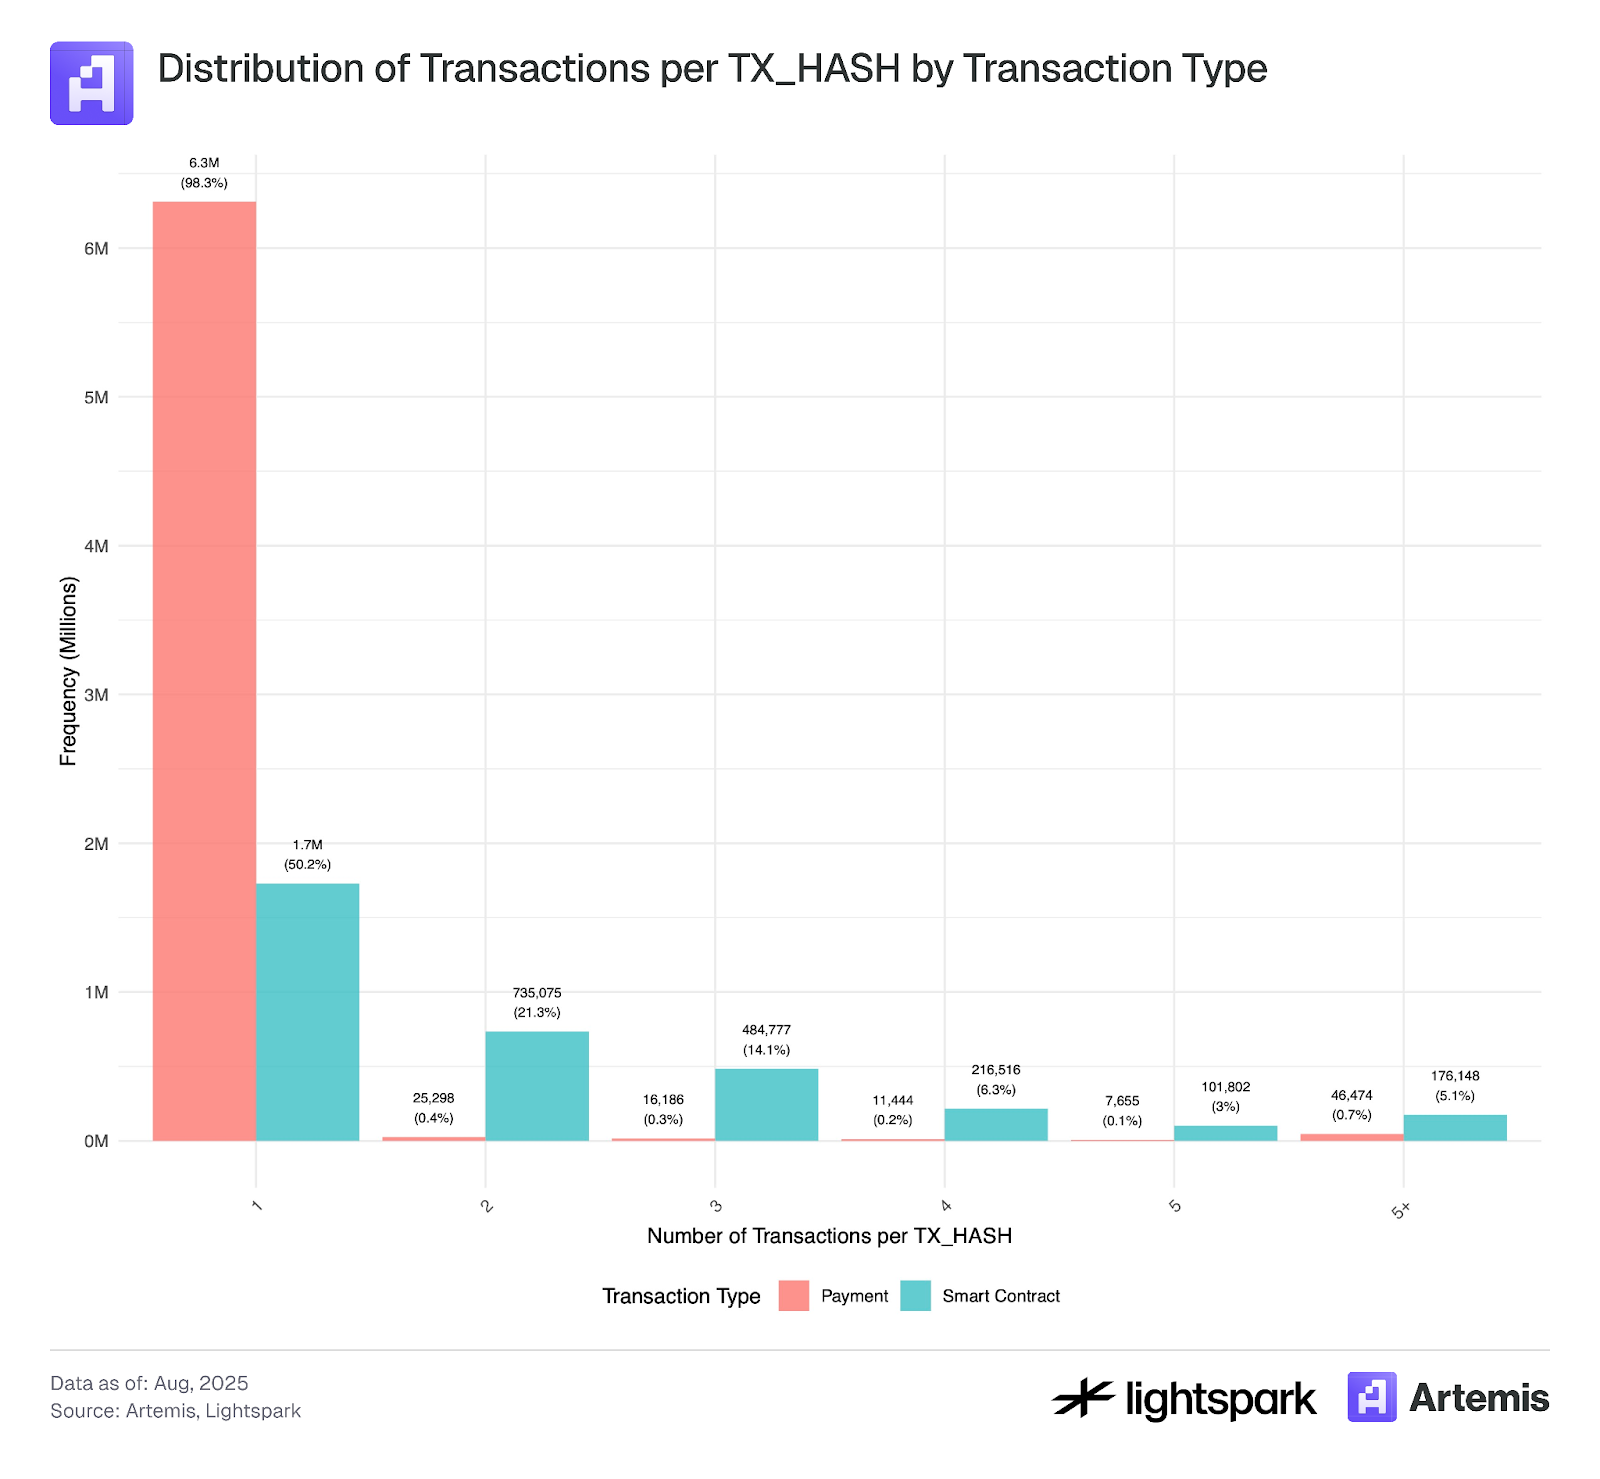
*This analysis's sample data covers transactions from July 4, 2025 to July 31, 2025.
Table 2 and Figure 2 show that, in terms of transaction volume, payments (EOA-EOA) and smart contract transactions (DeFi) are roughly 50:50, with smart contract transactions accounting for 53.2% of the transaction volume. However, Figure 2 shows that transaction volume (total transfer amount) is more volatile than the number of transactions, indicating that these fluctuations are mainly caused by large EOA-EOA transfers by institutions.
Table 2: Summary of Transaction Types
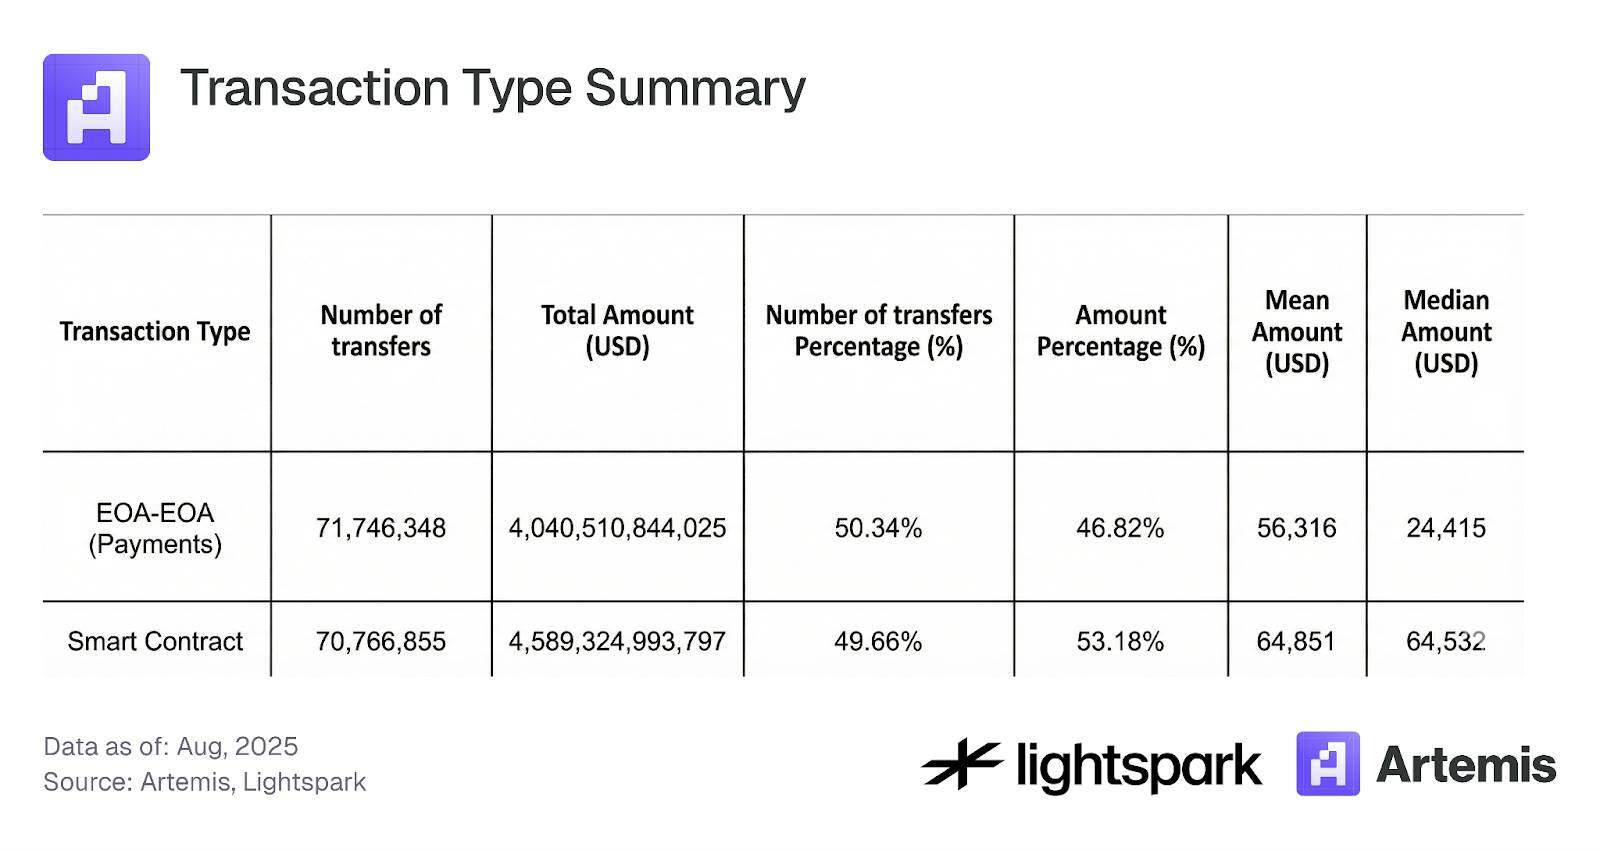
Figure 2:
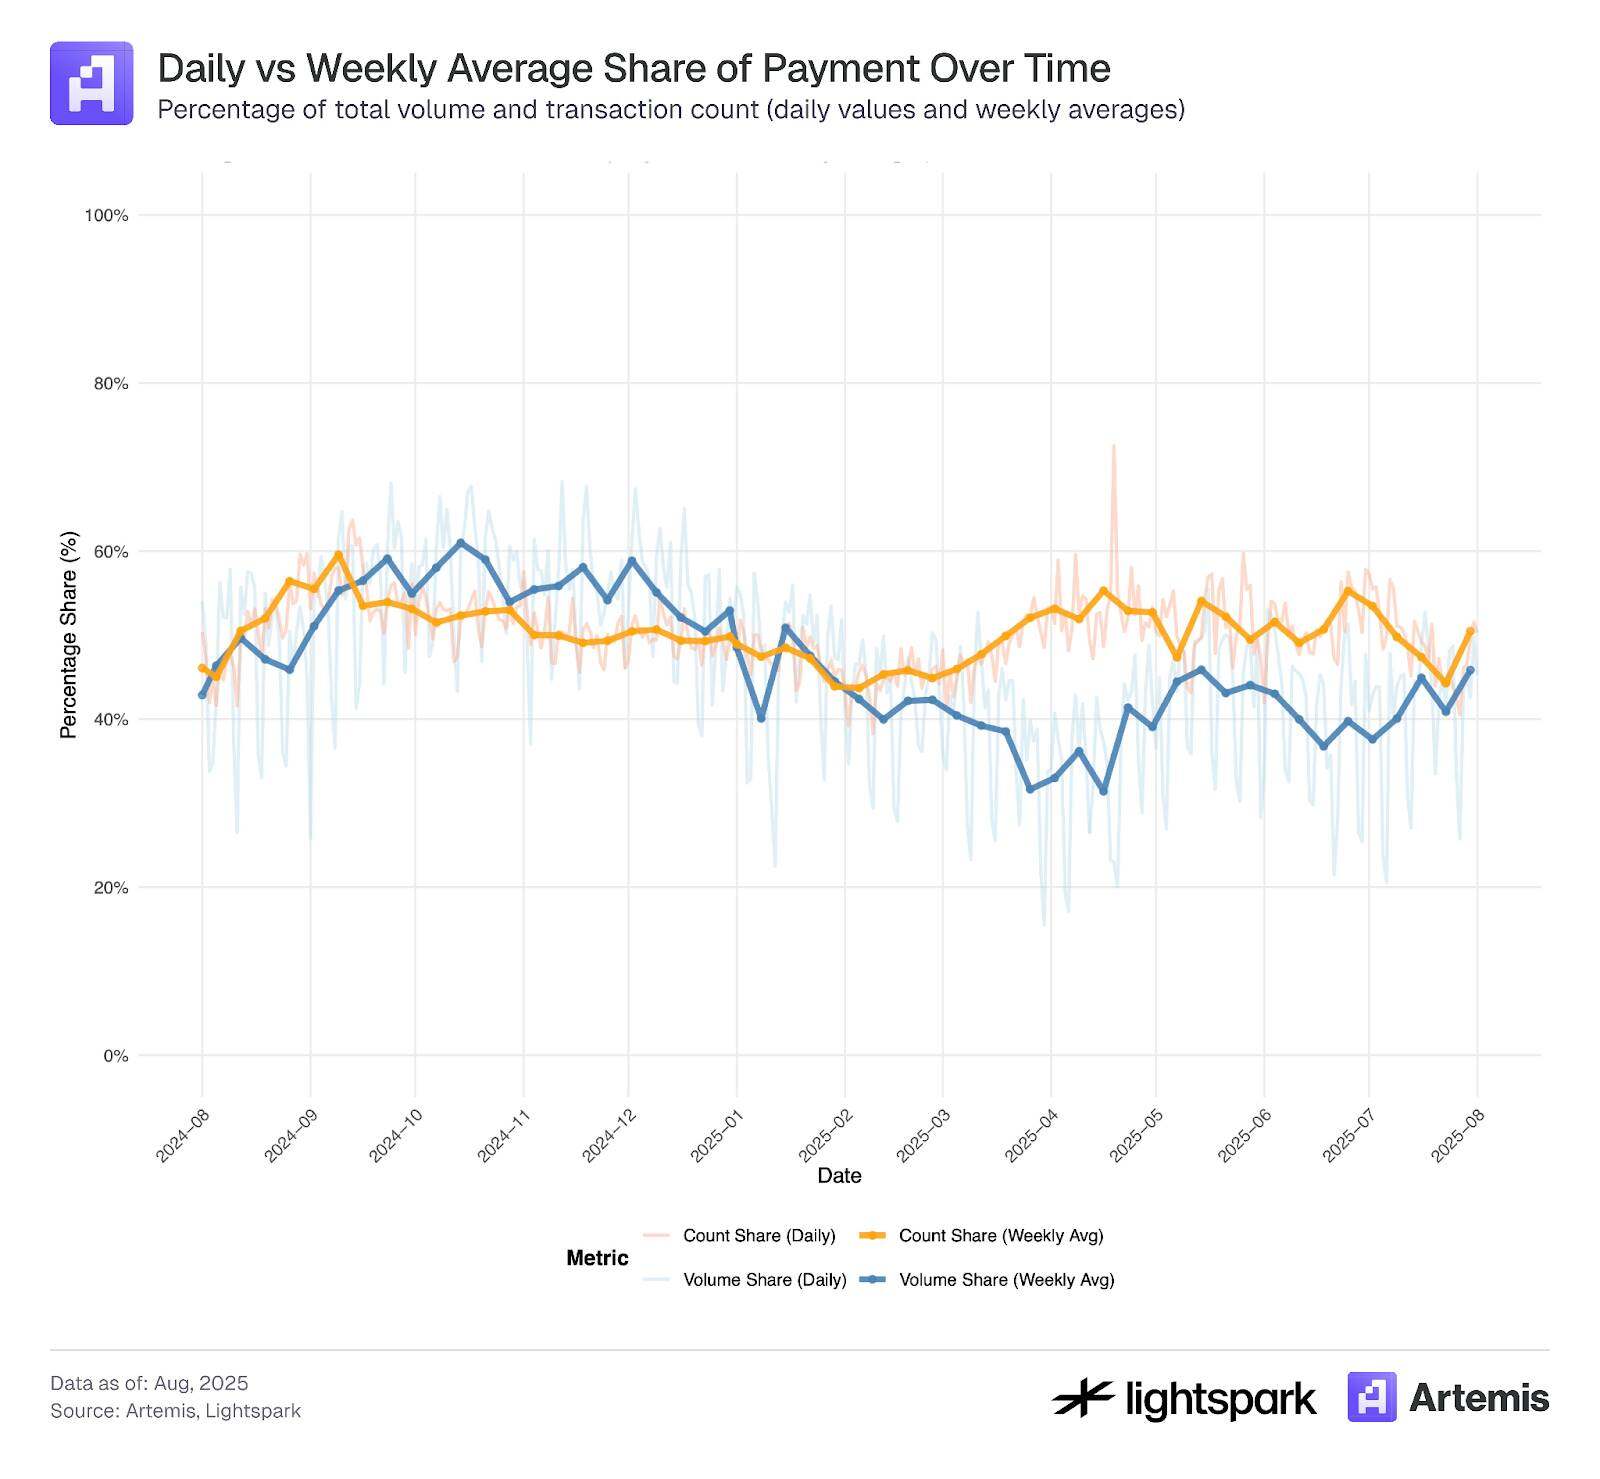
Figure 3 illustrates the transaction amount distribution of payment (EOA-EOA) and smart contract transactions. The amount distributions of both payment transactions and smart contract transactions resemble a heavy-tailed normal distribution, with average values ranging from approximately $100 to $1000.
However, there was a significant peak in transactions below $0.10, which may indicate bot activity or transaction manipulation related to fraudulent transactions and order brushing, consistent with the descriptions of Halaburda et al. (2025) and Cong et al. (2023).
Since Ethereum's gas fees typically exceed $0.1, transactions below this threshold require further scrutiny and may be excluded from the analysis.
Figure 3:
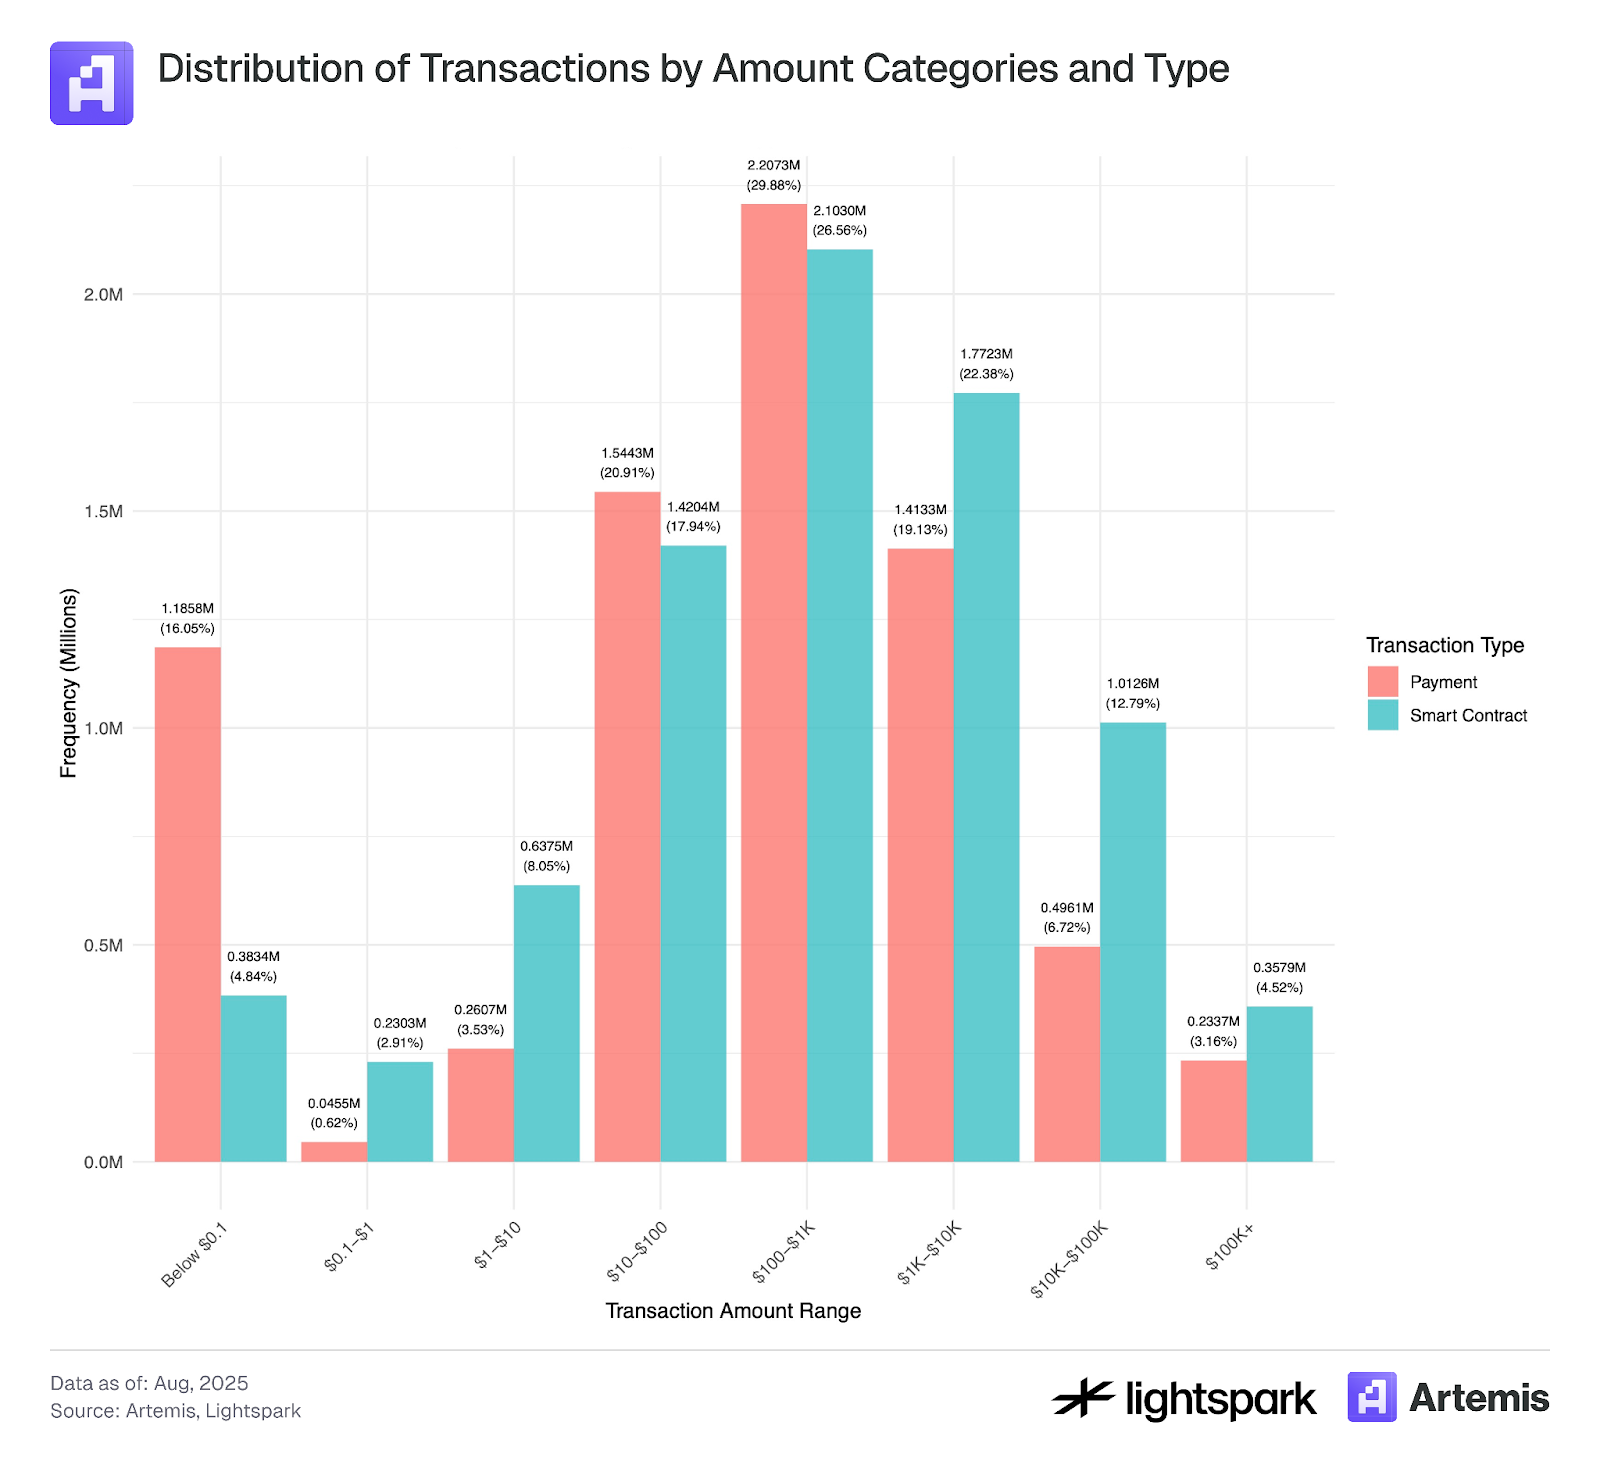
The data sample used in this analysis covers transaction records from July 4, 2025 to July 31, 2025.
3.2 Payment Type
By using the tagging information provided by Artemis, payments between two EOAs (External Accounts) can be further analyzed. Artemis provides tagging information for many Ethereum wallet addresses, enabling the identification of wallets owned by institutions such as Coinbase. We categorize payment transactions into five types: P2P, B2B, B2P, P2B, and Internal B. The following is a detailed description of each category.
P2P payment:
P2P (Person-to-Person) blockchain payments refer to transactions where funds are transferred directly from one user to another through a blockchain network. In account-based blockchains (such as Ethereum), this type of P2P transaction is defined as the process of transferring digital assets from one user's wallet (EOA account) to another user's EOA wallet. All transactions are recorded and verified on the blockchain without the need for intermediaries.
Main challenges:
Identifying whether a transaction between two wallets in an account system truly occurs between two independent entities (i.e., individuals, not companies) and correctly classifying it as a P2P transaction is a major challenge. For example, a user transferring funds between their own accounts (i.e., a Sybil account) should not be counted as a P2P transaction. However, simply defining all transactions between EOAs (External Accounts) as P2P transactions may incorrectly classify such transfers as P2P.
Another issue is that when an EOA account is owned by a company, such as a centralized exchange (CEX, like Coinbase), the EOA wallet is not actually owned by a real individual. In our dataset, we were able to tag many institutional and corporate EOA wallets; however, due to incomplete tagging information, some EOA wallets owned by companies but not recorded in our dataset may be incorrectly labeled as personal wallets.
Finally, this method fails to capture blockchain P2P payments processed through intermediaries—also known as the "stablecoin sandwich" model. In this model, funds are transferred between users through intermediaries that utilize blockchain for settlement. Specifically, fiat currency is first sent to the intermediary, which converts it into cryptocurrency. The funds are then transferred through the blockchain network and finally converted back to fiat currency by the receiving intermediary (which may be the same or different intermediaries). The blockchain transfer is the "middle layer" of the "sandwich," while the fiat currency conversion forms the "outer layer." The main challenge in identifying these transactions is that they are executed by intermediaries, who may bundle multiple transactions together to reduce gas fees. Therefore, some key data, such as the exact transaction amount and the number of users involved, is only available on the intermediary's platform.
B2B Payment:
Business-to-business (B2B) transactions refer to electronic transfers from one business to another via a blockchain network. In our dataset, stablecoin payments refer to transfers between two known institutional EOA wallets, such as a transfer from Coinbase to Binance.
Internal B payment:
Transactions between two EOA wallets of the same institution are marked as internal Class B transactions.
P2B (or B2P) payments:
Consumer-to-business (P2B) or business-to-consumer (B2P) transactions refer to electronic transfers between individuals and businesses, and these transactions can be bidirectional.
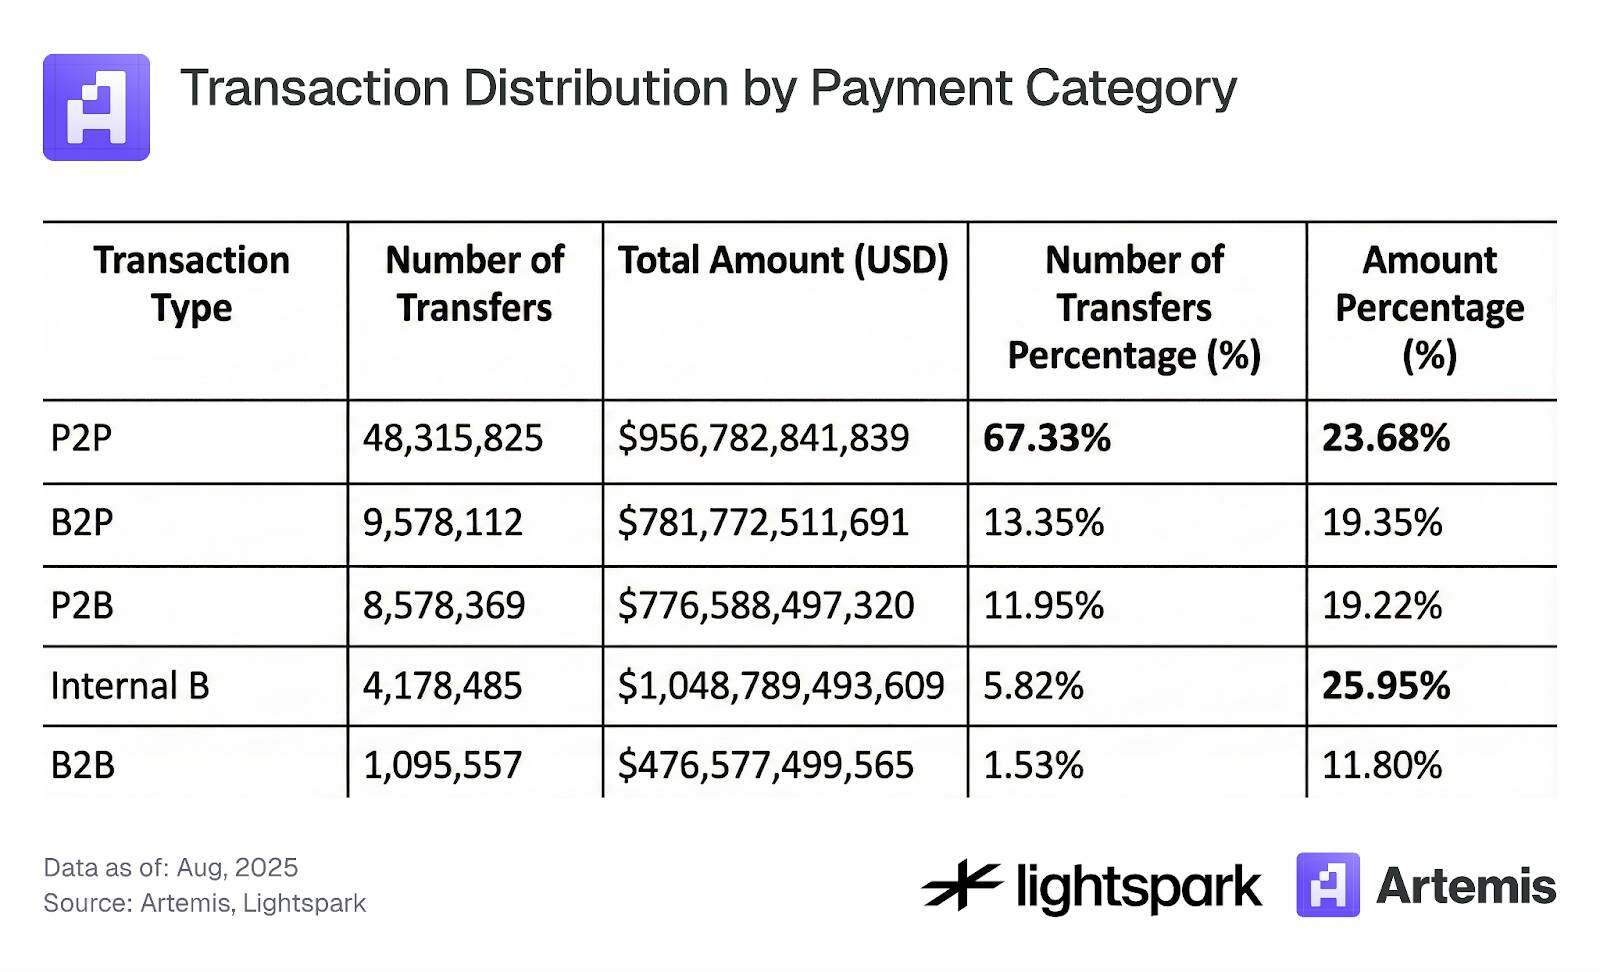
Using this labeling method, we analyzed payment data (EOA-EOA transfers only), and the main results are summarized in Table 3. The data shows that 67% of EOA-EOA transactions are P2P, but they only account for 24% of the total payments. This further indicates that P2P users transfer smaller amounts compared to institutional users. Furthermore, one of the highest-volume payment transaction categories is internal B-type transactions, meaning that transfers within the same organization account for a significant proportion. Exploring the specific meaning of internal B-type transactions and how to statistically analyze them in payment activity remains an interesting question worthy of further research.
Table 3: Transaction Distribution by Payment Category
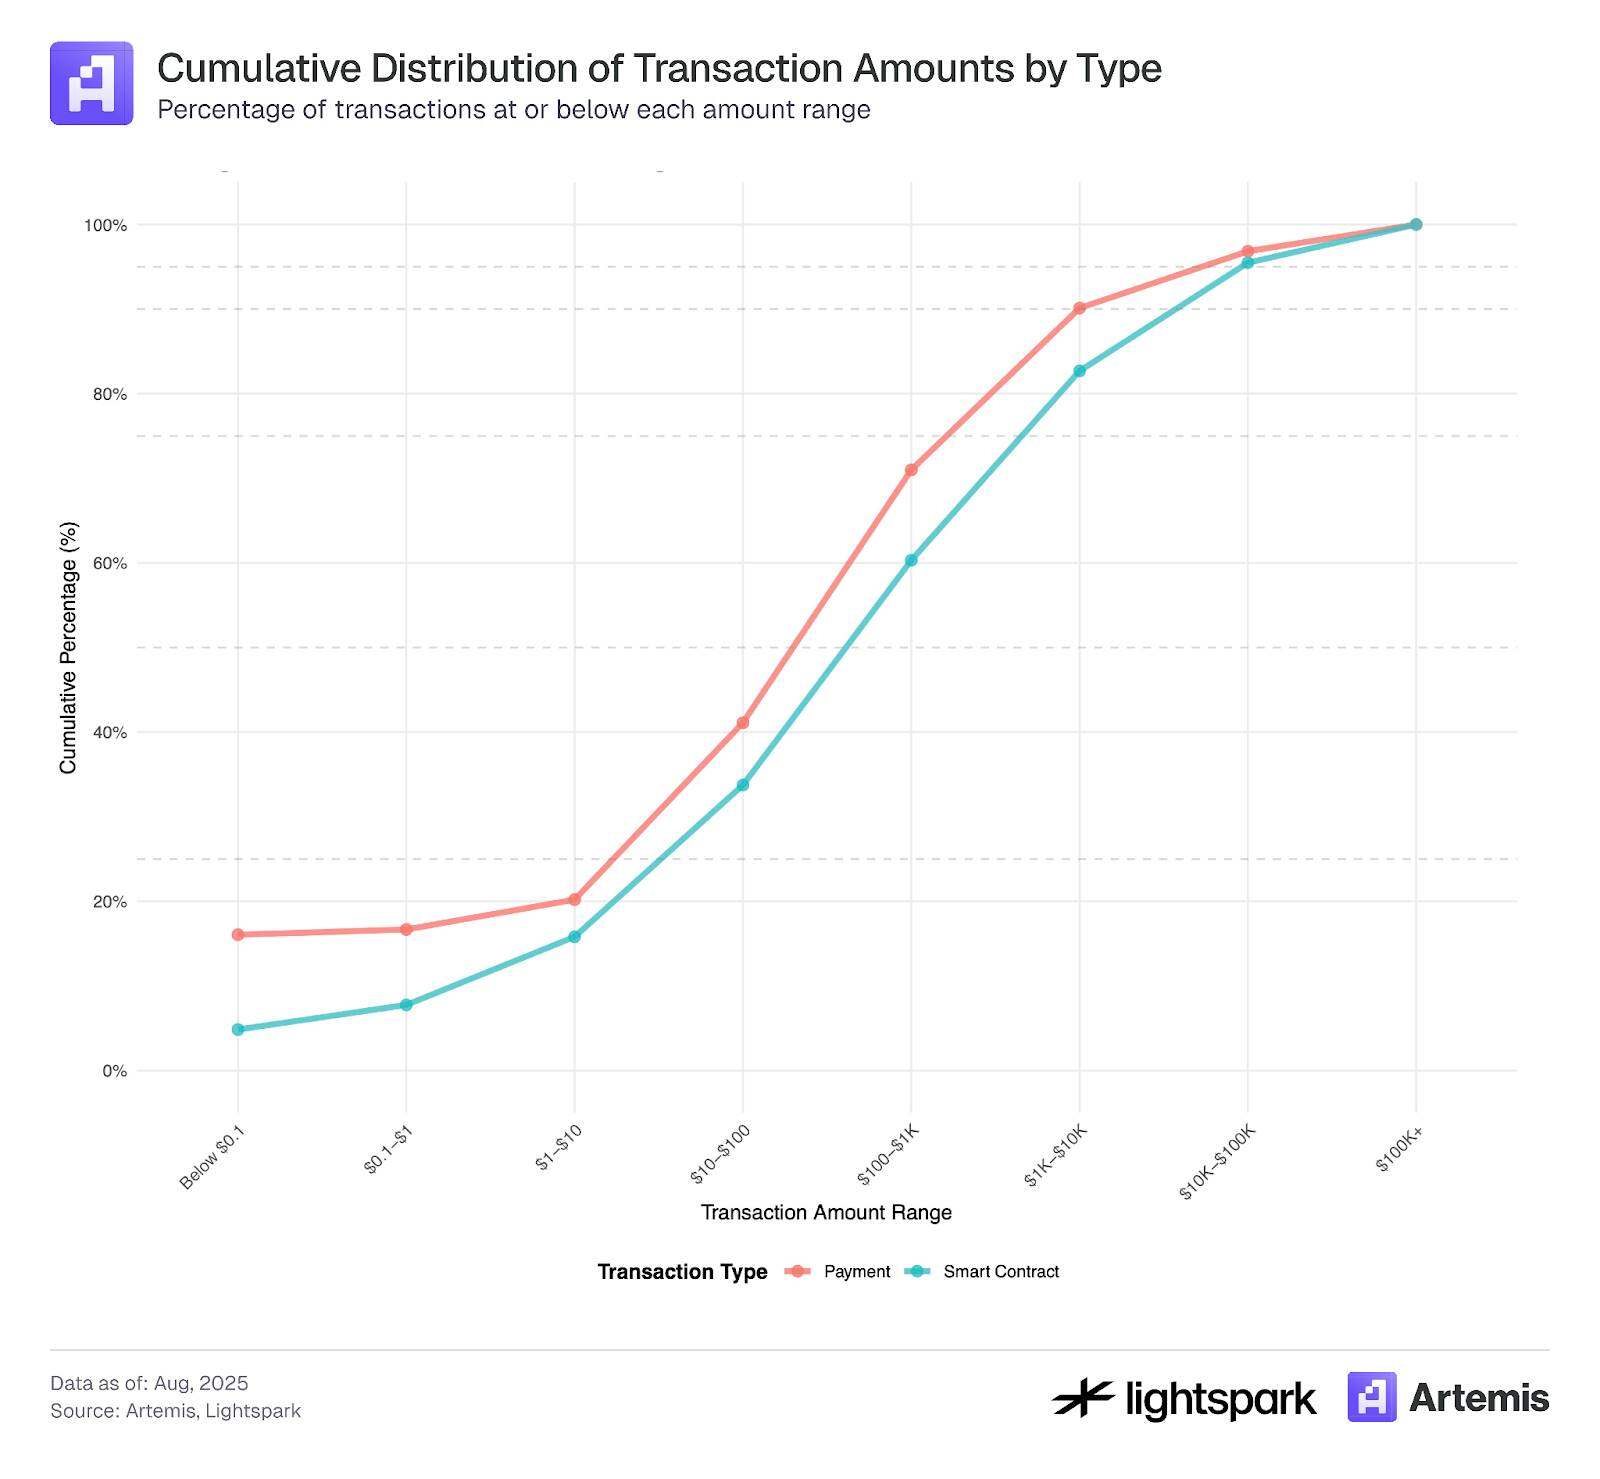
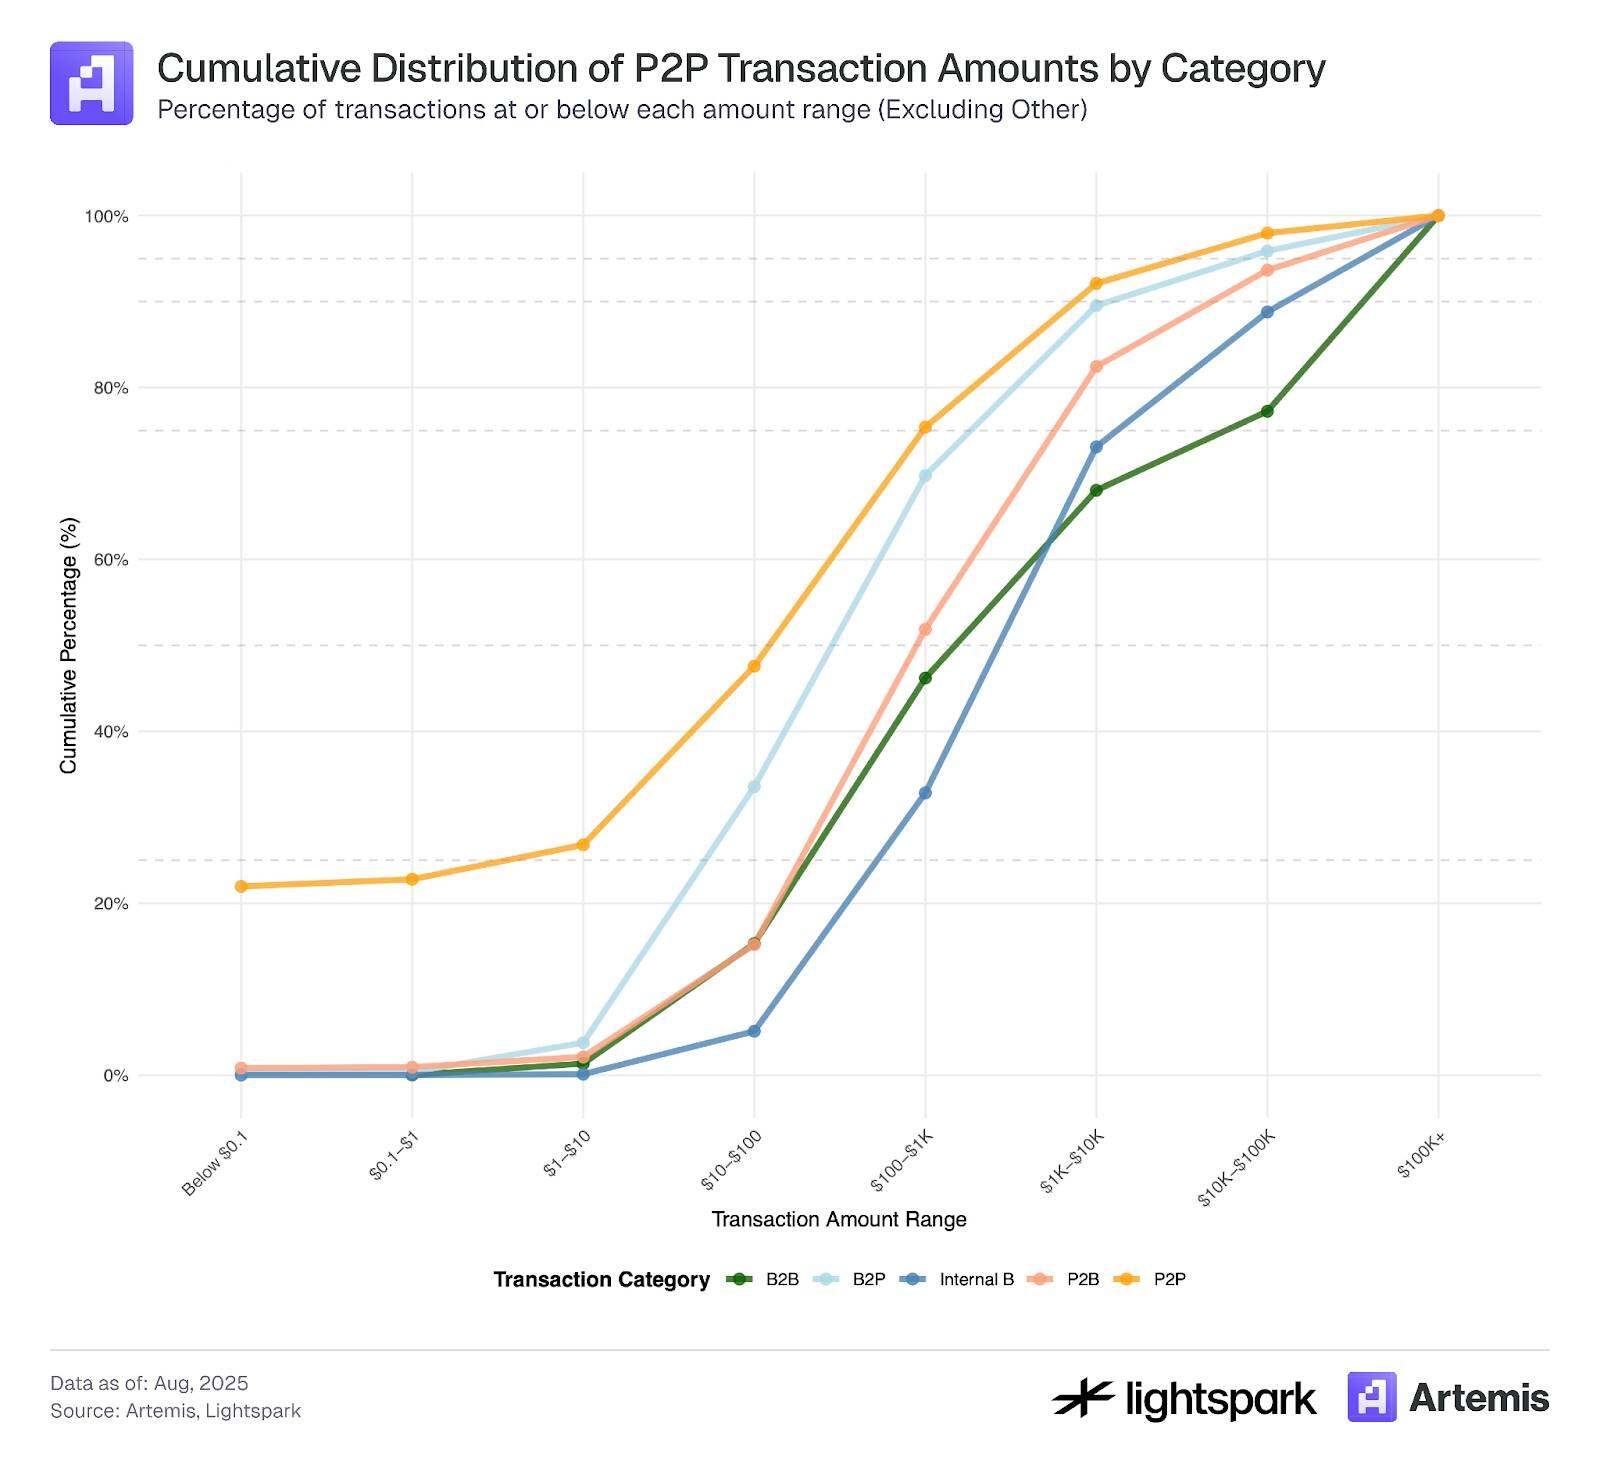
Finally, Figure 4 shows the cumulative distribution function (CDF) of transaction amounts for each payment category. The CDFs clearly show significant differences in the distribution of transaction amounts across different categories. Most transactions in EOA-EOA accounts with amounts below $0.1 are P2P transactions, further suggesting that these transactions may be driven more by bots and manipulated wallets than by the institutions centrally labeled in our dataset. Furthermore, the CDFs for P2P transactions further support the view that most transactions are smaller, while transactions labeled as B2B and internal B categories show significantly higher transaction amounts in their CDFs. Finally, the CDFs for P2B and B2P transactions fall between those of P2P and B2B.
Figure 4:
The sample data for this analysis covers transaction records from July 4, 2025 to July 31, 2025.
Figures 5 and 6 show the trends of each payment category over time.
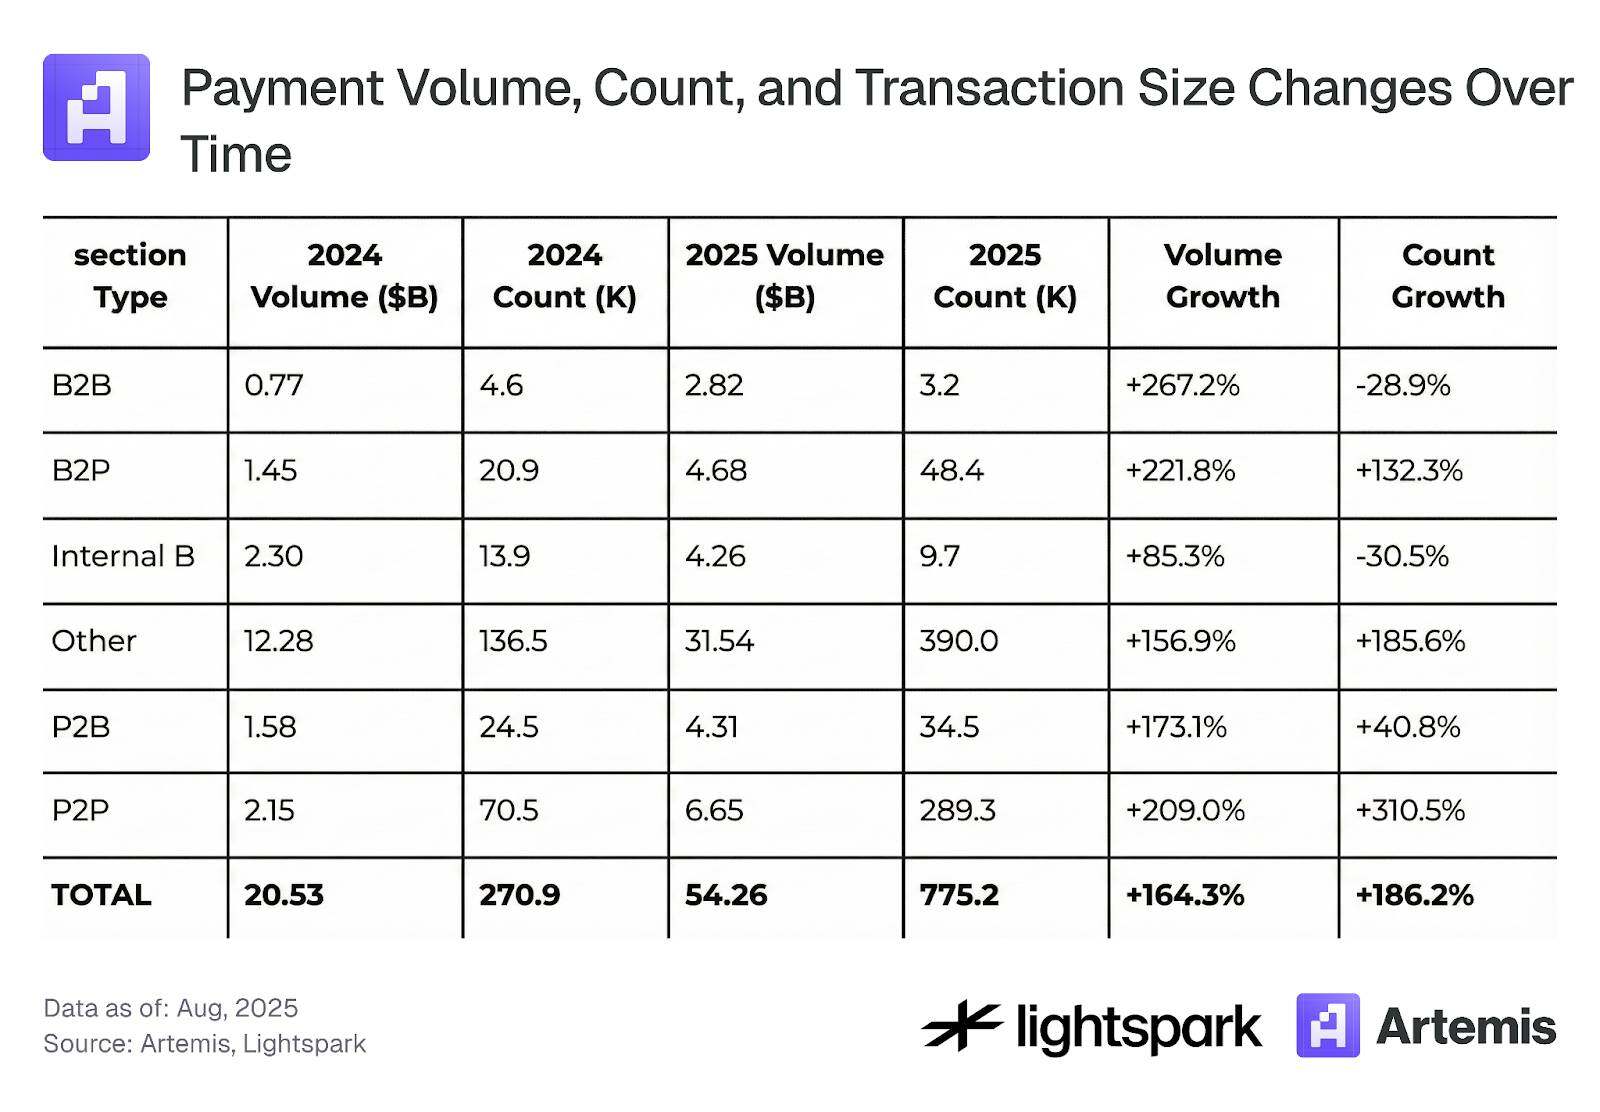
Figure 5 focuses on weekly changes, showing a consistent adoption trend and weekly transaction volume growth across all payment categories. Table 4 further summarizes the overall changes from August 2024 to August 2025.
Furthermore, Figure 6 illustrates the payment differences between weekdays and weekends, clearly showing a decrease in payment transaction volume on weekends. Overall, usage of all payment categories shows an increasing trend over time, both on weekdays and weekends.
Figure 5:

Figure 6:
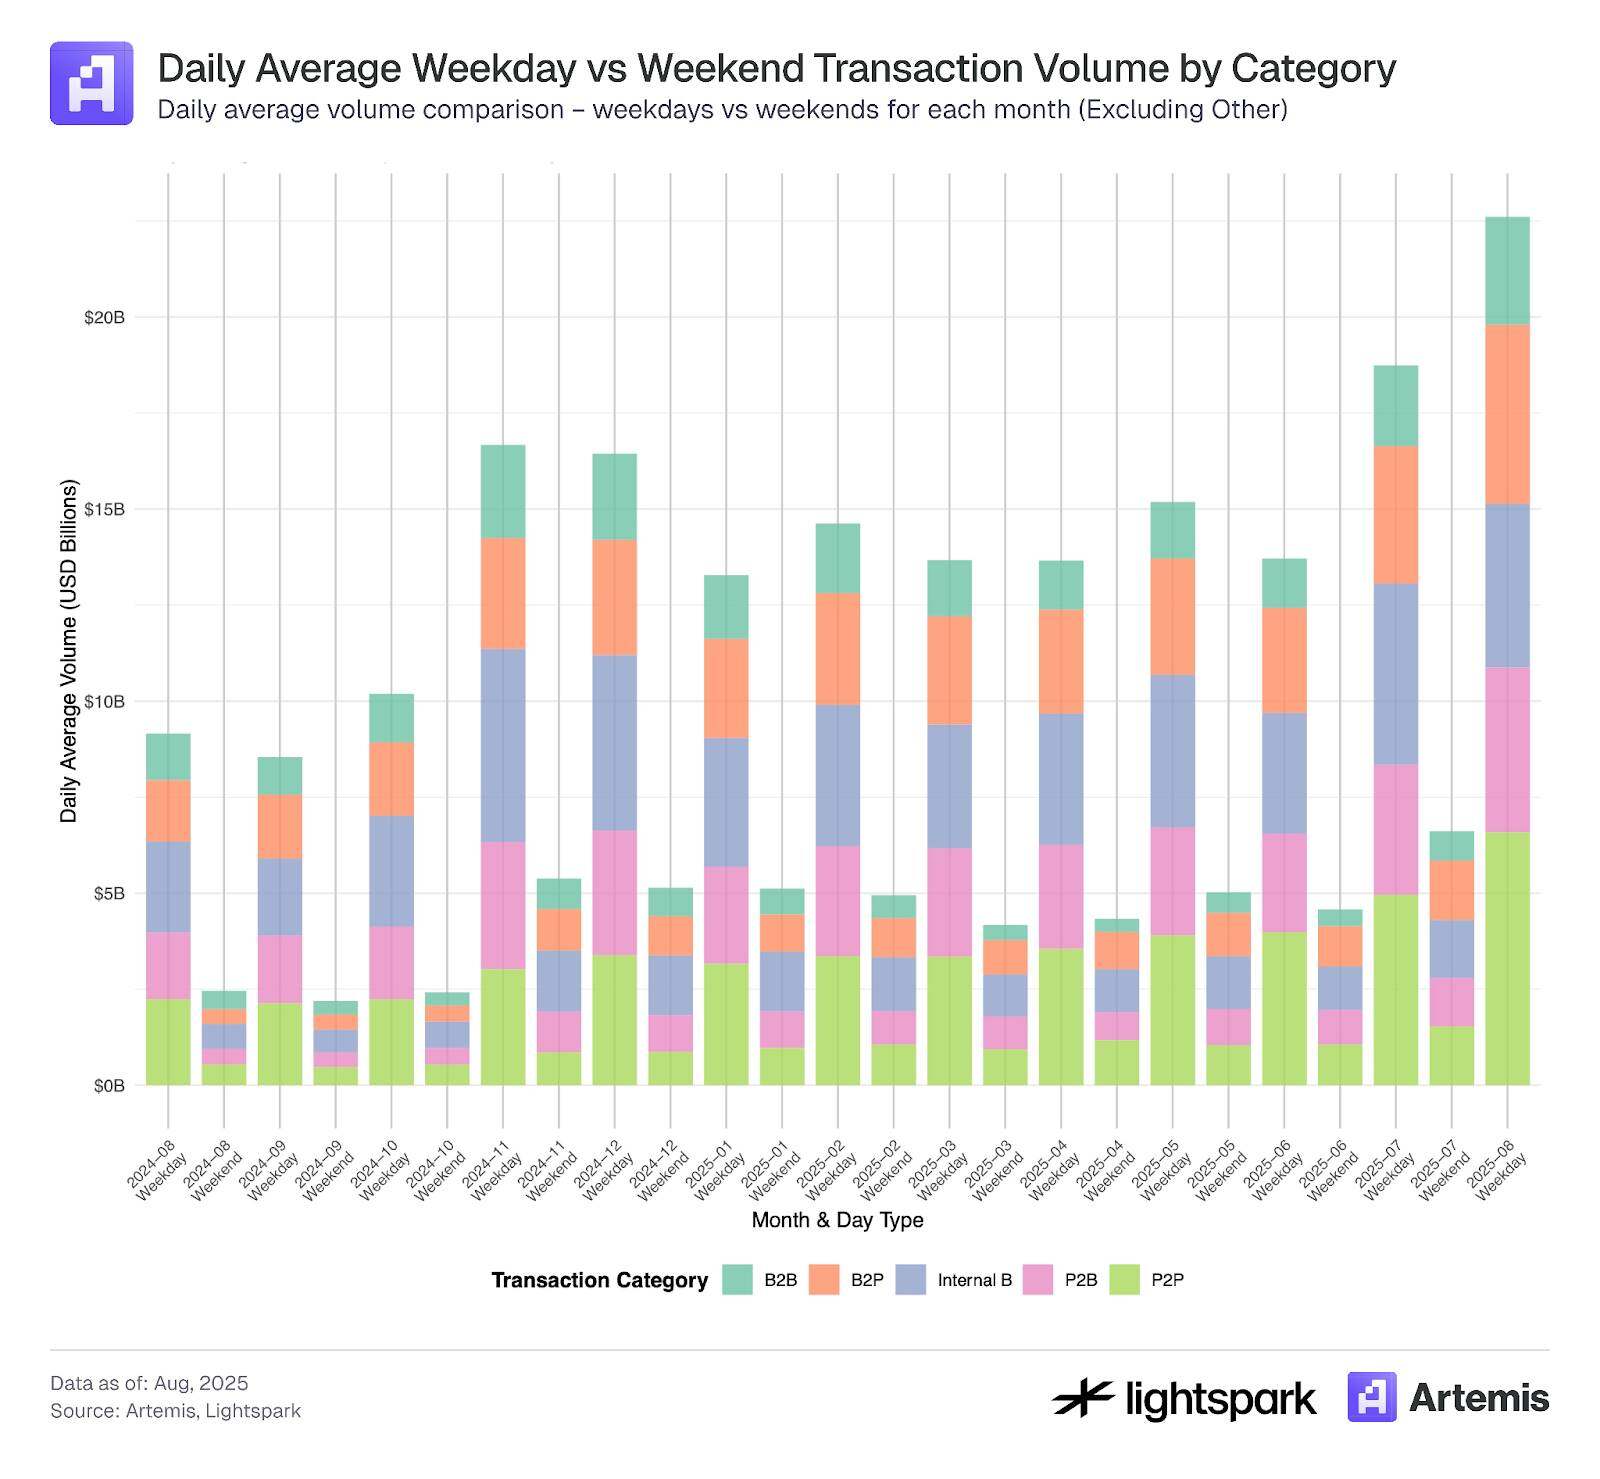
Table 4: Changes in Payment Transaction Volume, Number of Transactions, and Transaction Amount over Time
3.3 Concentration of Stablecoin Transactions
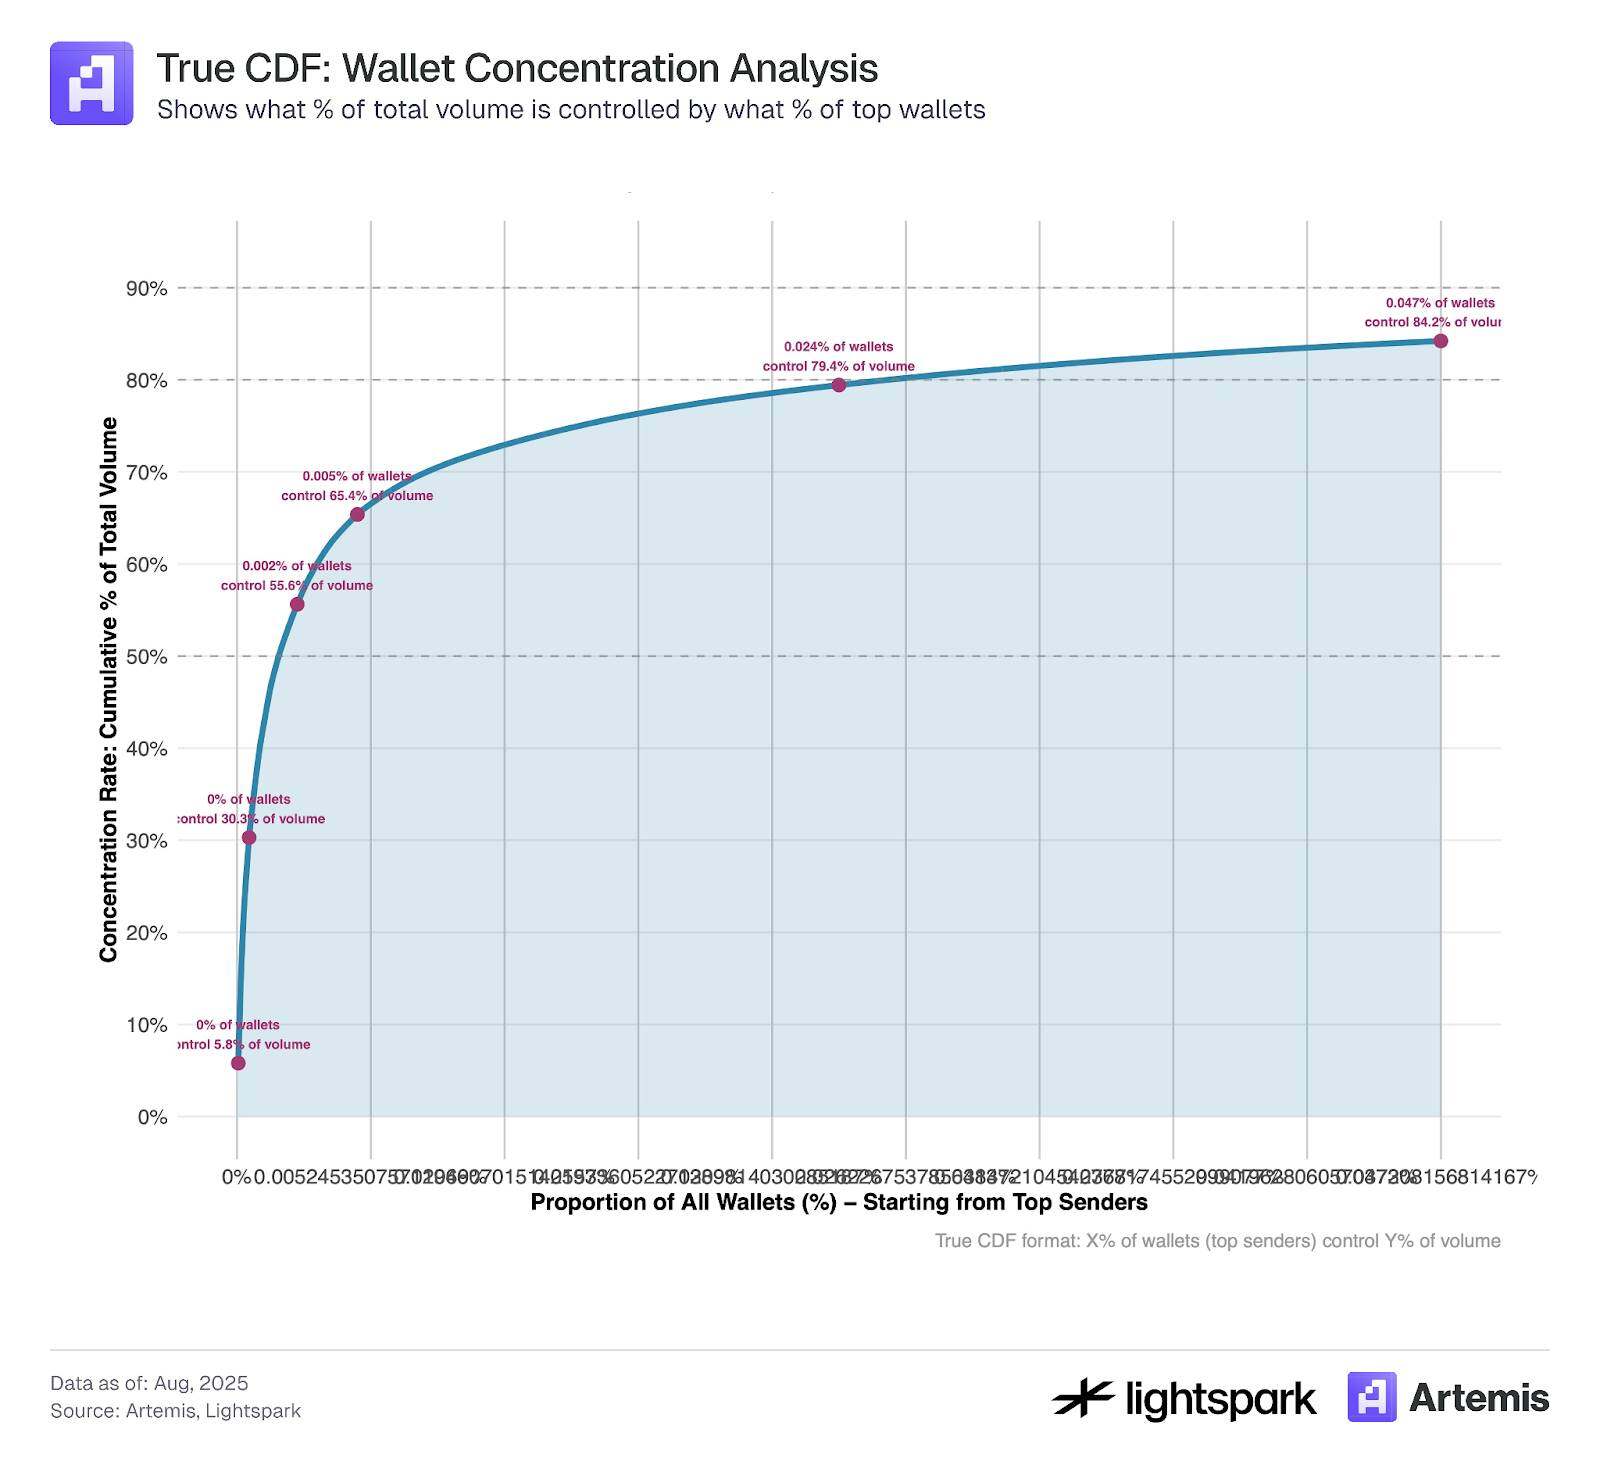
In Figure 9, we calculated the concentration of major sender wallets for sending stablecoins via the Ethereum blockchain. Clearly, the majority of stablecoin transfers are concentrated in a small number of wallets. During our sample period, the top 1,000 wallets contributed approximately 84% of the transaction volume.
This indicates that although DeFi and blockchain are designed to support and promote decentralization, they still exhibit highly centralized characteristics in some aspects.
Figure 9:
The data sample used in this analysis covers transaction records from July 4, 2025 to July 31, 2025.
4. Discussion
It is evident that stablecoin adoption is increasing over time, with transaction volume and frequency more than doubling between August 2024 and August 2025. Estimating stablecoin usage in payments is a challenging task, and an increasing number of tools are being developed to help improve this estimation. This study utilizes tagged data provided by Artemis to explore and estimate stablecoin payment usage recorded on the Ethereum blockchain.
Our estimates suggest that stablecoin payments account for 47% of total transaction volume (35% excluding internal Class B transactions). Given our limited restrictions on payment classification (primarily based on EOA-EOA transfers), this estimate can be considered an upper limit. However, researchers can further apply filtering methods, such as upper and lower limits on transaction amounts, depending on their research objectives. For example, increasing the minimum amount limit by $0.10 could exclude low-amount transaction manipulation mentioned in Section 3.1.
In Section 3.2, by further categorizing payment transactions into P2P, B2B, P2B, B2P, and internal B-type transactions using Artemis-tagged data, we found that P2P payments account for only 23.7% (all raw data) or 11.3% (excluding internal B-type transactions) of the total payment transaction volume. Previous research indicated that P2P payments account for approximately 25% of stablecoin payments, and our results are similar.
Finally, in Section 3.3, we observed that, in terms of transaction volume, most stablecoin transactions are concentrated in the top 1,000 wallets. This raises an interesting question: is the use of stablecoins developing as a payment tool driven by intermediaries and large companies, or as a P2P transaction settlement tool? Time will tell.
References
- Yaish, A., Chemaya, N., Cong, LW, & Malkhi, D. (2025). Inequality in the Age of Pseudonymity. arXiv preprint arXiv:2508.04668.
- Awrey, D., Jackson, HE, & Massad, TG (2025). Stable Foundations: Towards a Robust and Bipartisan Approach to Stablecoin Legislation. Available at SSRN 5197044.
- Halaburda, H., Livshits, B., & Yaish, A. (2025). Platform building with fake consumers: On double dippers and airdrop farmers. NYU Stern School of Business Research Paper Forthcoming.
- Cong, LW, Li, X., Tang, K., & Yang, Y. (2023). Crypto wash trading. Management Science, 69(11), 6427-6454.
For more information, please visit:


