
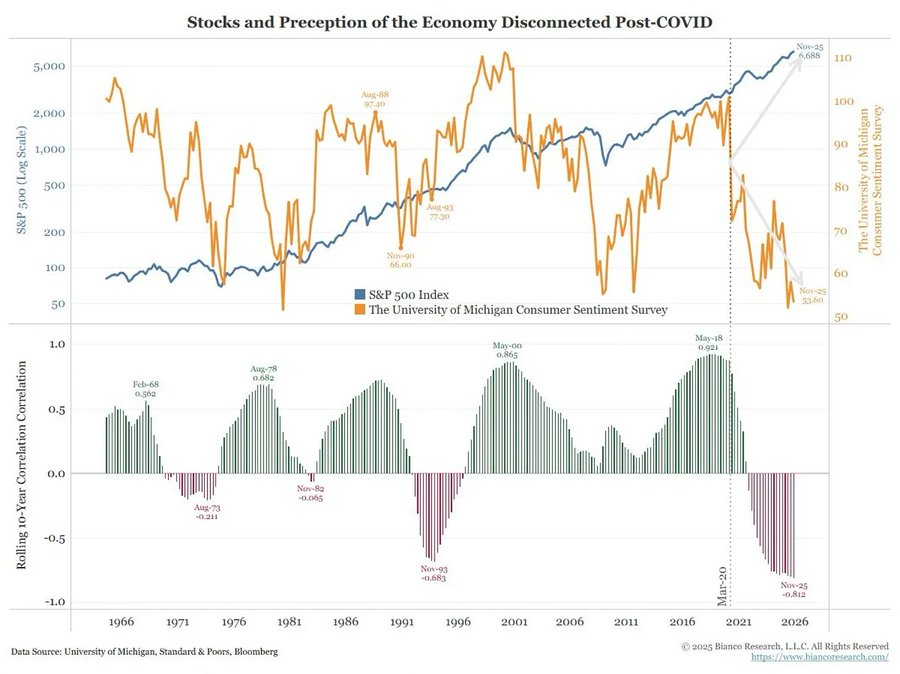
Why hasn't Bitcoin's hedging narrative materialized? Five macroeconomic indicators reveal the truth.
- 核心观点:宏观系统正进入更脆弱阶段。
- 关键要素:
- 美联储在数据迷雾中鹰派收紧。
- 科技巨头转向杠杆驱动增长模式。
- 私人信贷市场出现早期裂缝。
- 市场影响:风险资产波动加剧,信用敏感度提升。
- 时效性标注:中期影响
Author | @arndxt_xo
Compiled by Odaily Planet Daily ( @OdailyChina )
Translator | Dingdang ( @XiaMiPP )
Over the past few months, my stance has undergone a major shift: from "pessimistic to bullish" (a pervasive pessimism that often sets the stage for a market squeeze); to "I am very bearish, and I am genuinely concerned that the entire system is entering a more vulnerable phase."
This is not due to a single event, but rather based on the following five mutually reinforcing dynamic factors:
- The risk of policy missteps is rising. The Federal Reserve is tightening financial conditions amid data uncertainty and clear signs of a slowdown.
- The model of AI/tech giants has shifted from "cash surplus" to "leveraged growth." This shifts the risk from simple stock market fluctuations to more traditional credit cycle issues.
- Private lending and loan pricing are beginning to diverge. Although it is still early, signs of pricing pressure on models are already visible.
- The K-shaped economy is gradually evolving into a political problem. For a growing number of people, the social contract is no longer credible, and this will ultimately manifest itself at the policy level.
- Market concentration itself has become a systemic and political vulnerability. When a few tech giants dominate about 40% of the index's weighting , and these giants are geopolitically and leverage-sensitive, they cease to be merely growth engines and become targets of national security and policy objectives.
The baseline scenario may still be that policymakers will eventually "as before" reinject liquidity and support asset prices to enter the next political cycle. But the path to that outcome looks more turbulent, more reliant on credit, and more politically unstable, far more complex than the traditional "buy the dip" framework assumes.
1. Changes in macroeconomic stance
For most of this cycle, a "bearish but constructive" stance is reasonable:
- Inflation remains high, but its rate of increase is slowing.
- The policy remains supportive overall.
- While risky assets have been driven up, each correction has been accompanied by an injection of liquidity.
However, some factors have changed:
- Government shutdown: We experienced a prolonged government shutdown, which disrupted the release and quality of key macroeconomic data.
- Increased uncertainty in the statistical system: Senior officials have also acknowledged that the federal statistical system has been compromised, reducing the credibility of core data that underpins the pricing of trillions of dollars in assets.
- Against this backdrop, the Federal Reserve has instead adopted a more hawkish stance on interest rate expectations and its balance sheet , tightening financial conditions despite deteriorating long-term indicators.
In other words, the system is exacerbating uncertainty and stress, rather than getting rid of them. This is a completely different risk structure.
2. Tightening policies implemented amidst uncertainty
The core issue is not just whether policies are tightening, but in what aspects and how they are being tightened :
- Data "fog": After the shutdown, the release of key data (inflation, employment) was delayed, distorted, or questioned; the Fed's own monitoring tools became unreliable at the most critical time.
- Interest rate expectations: Although forward-looking indicators generally point to inflation continuing to decline early next year, the hawkish tone of Federal Reserve officials has significantly reduced market expectations for the probability of a short-term rate cut.
- Balance Sheet: During quantitative tightening, the Federal Reserve maintains its balance sheet stance and tends to push more duration to the private sector, which will substantially tighten financial conditions even if nominal interest rates remain unchanged.
Historically, the Federal Reserve's mistakes have often stemmed from "bad timing": tightening too late and cutting too late. The risk now is that we may repeat this pattern again—tightening when growth is slowing and data is unclear, rather than easing before the pressures materialize.
3. Tech giants and AI are shifting from "cash machines" to "leveraged growth."
The second structural shift is reflected in the nature of large technology companies and AI leaders:
- Over the past decade, the "Big Seven" have essentially resembled bonds: high market share, huge free cash flow, substantial repurchase scale, and extremely low net leverage.
- Over the past two or three years, these cash flows have increasingly been invested in AI capital expenditures: data centers, chips, and infrastructure.
- We are now entering a phase where AI spending increasingly relies on debt issuance rather than operating cash flow .
This has several implications:
- Credit spreads and credit default swaps are widening , as companies like Oracle leverage their resources to build AI infrastructure.
- Stock price volatility is no longer the only risk. We are now seeing early outlines of a typical credit cycle emerging in the previously "unbreakable" technology sector.
- Market structure exacerbated this situation. These companies' stocks, which have a large weighting in major indices, have shifted from "cash cows" to "leveraged growth, " altering the risk profile of the entire market.
This does not mean the AI bubble is over. If capital expenditures have sustainable returns, then debt-financed capital expenditures are justified.
But this does mean that the margin for error is smaller , especially in the context of high interest rates and tightening policies.
4. Early Cracks in Credit and Private Markets
Beneath the surface calm in the public markets, early pressures are emerging in private lending: significant price discrepancies are appearing between different institutions for the same loan (e.g., one quotes 70 cents while another quotes 90 cents). This is a classic precursor to a “ model pricing vs. market pricing ” conflict.
This is similar to the pattern observed in 2007–2008:
- 2007: Non-performing assets rose and interest rate spreads widened, while the stock index remained relatively calm.
- 2008: Markets previously considered "cash-like" (such as auction interest rate securities) suddenly froze.
At the same time, reserves in the Federal Reserve System began to decline; the Fed also became increasingly aware that if it did not expand its balance sheet, the "pipeline" of the financial markets might experience functional problems.
This does not mean that a crisis is inevitable, but it fits a situation where credit is quietly tightening while policy rhetoric remains focused on "data dependence" rather than proactive measures .

REPO (reverse repurchase agreement) is where the first signs of "declining reserves" appear.
In this spider chart, the most intuitive signal is that " the proportion of repurchase transactions that reach or exceed IORB " is the most direct indication that we are quietly leaving a state of truly abundant reserves.
During the period from 2018 to Q3 2019, volatility was relatively manageable: reserves were ample and most secured financing rates were below the interest rate on reserves (IORB) floor.
By September 2019 (on the eve of the repo market turmoil): this line widened sharply as more and more repo rates touched or broke through the IORB, a typical signal of collateral and reserve scarcity.
Now let's look at June 2025 vs. October 2025:
- The light blue line (June) remains safe; however, the red line in October is approaching the 2019 outline, indicating that more and more repurchase transactions are being pushed to the lower limit of the policy rate.
- In other words, dealers and banks are bidding up overnight funding costs because reserves are no longer “comfortably plentiful.”
- By combining this with other indicators on the spider chart (increased intraday overdrafts, increased Federal Reserve purchases of federal funds, and increased overdue payments), clear information can be obtained.
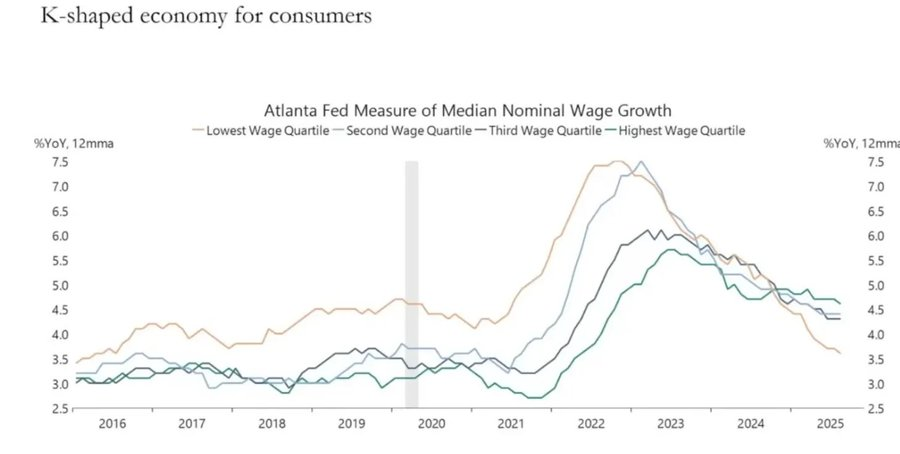
5. The K-shaped economy is becoming a political variable.
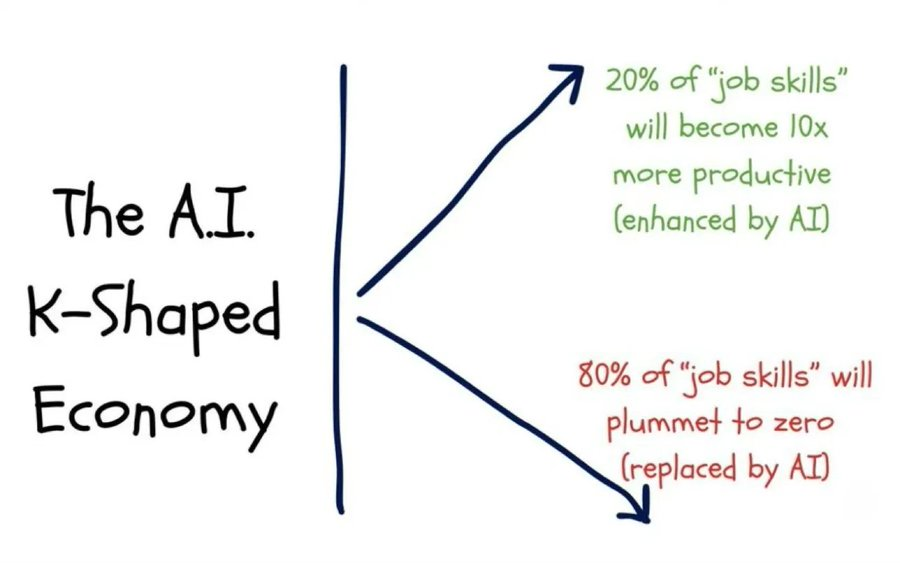
In his previous article, "The Two-Tier K-Shaped Economy," the author explained that a K-shaped economy refers to a situation where different parts of the economy move in completely opposite directions within the same cycle.
- The upper part of K → Capital markets, asset holders, technology industry, large enterprises → Rapid rise (profits, stock prices, and wealth rise simultaneously).
- The lower half of K → salaried workers, small and medium-sized enterprises, blue-collar industries → decline or stagnation.
The "K-shaped economic" divergence we used to talk about is now, in my view, no longer just an economic phenomenon, but a political variable :
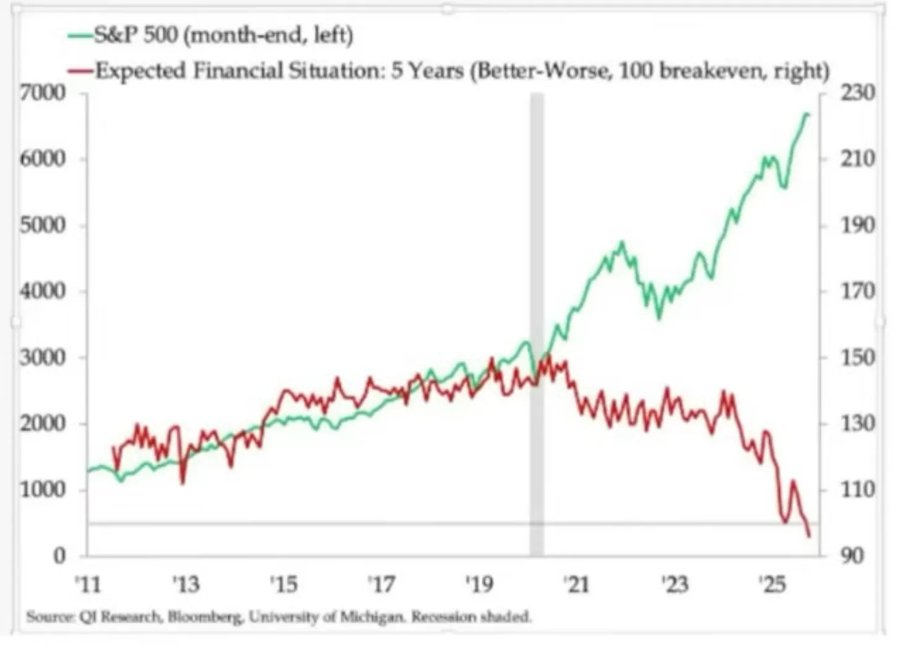
- Household expectations are clearly divergent. Longer-term financial prospects (e.g., 5-year expectations) differ significantly: some groups expect stability or even improvement; others expect a significant deterioration.
- Real-world stress indicators are also flashing warning signs: delinquency rates for subprime auto loans are rising; the age of first-time homebuyers is getting younger, with many approaching retirement age; and youth unemployment rates continue to rise in several markets.
For the expanding social groups, the problem is no longer just "inequality," but that the system itself is no longer functioning for them:
- They have no assets, limited wage growth, and almost no real path to participate in asset inflation.
- People's basic understanding of the social contract—"work hard, make progress, and eventually gain wealth and security"—is collapsing.
In such an environment, political behavior will change:
- Voters no longer choose "the best manager of the current system".
- They are increasingly willing to support radical or disruptive candidates on both the left and right because, in their view, their downside risk is extremely limited: "It can't get any worse anyway."
Future policies concerning taxation, redistribution, regulation, and monetary support will be formulated within this context.
This is clearly not neutral for the market.
6. Market concentration as a systemic and political risk
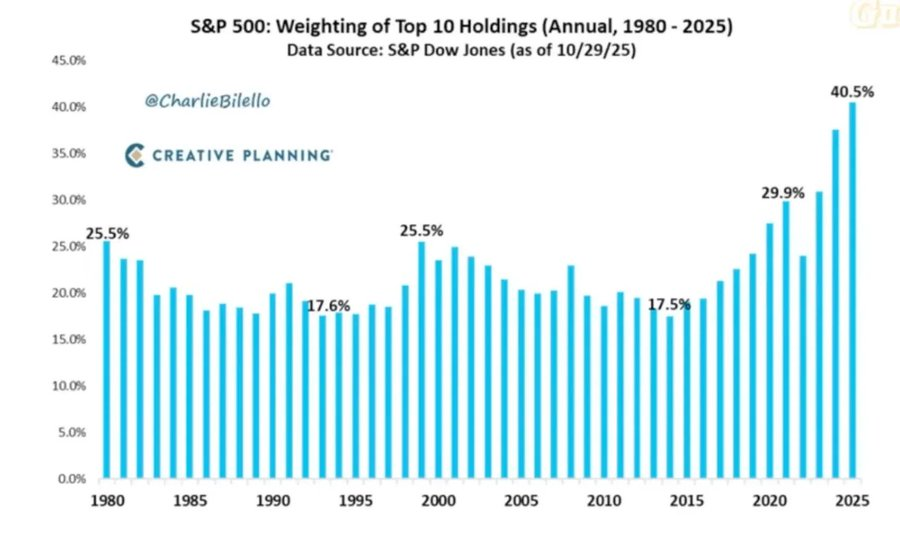
The total market capitalization is highly concentrated in a few companies. However, what is less discussed is the systemic and political implications behind this pattern:
- Currently, the top 10 companies account for about 40% of the market capitalization of major US stock indices.
This group of companies shares the following characteristics: they are core holdings of pension funds, 401(k) plans, and retail portfolios; their businesses are closely related to AI, they have significant exposure to the Chinese market, and they are highly dependent on interest rate paths; and they effectively act as monopolists in multiple digital sectors.
This presents three types of intertwined risks:
- Systemic market risk
Once these companies encounter profit, regulatory, or geopolitical shocks (such as the Taiwan issue or changes in Chinese demand), the impact will quickly spread to the entire family wealth system.
- National security risks
When such a large proportion of national wealth and productivity is concentrated in a few companies that have external dependencies, these companies themselves become strategic vulnerabilities.
- Political risk
In an environment where a "K-shaped" economic pattern coexists with a populist atmosphere, these companies are most likely to become focal points of discontent:
- Higher taxes, windfall profits tax, buyback restrictions;
- Antitrust-driven breakup;
- Stricter AI and data regulation.
In other words, these companies are not only growth engines, but are also becoming potential policy targets, and this possibility is rising.
7. Bitcoin, gold, and the yet-to-be-realized "perfect hedge" narrative.
In a world fraught with policy risks, credit pressures, and escalating political instability, one would expect Bitcoin to excel as a macro hedge. However, the reality is quite different:
- Gold is playing a traditional role as a crisis hedge : it is stable, has low volatility, and is becoming increasingly important in asset allocation.
- Bitcoin is more like a high-beta risk asset in trading : it is closely related to liquidity cycles; it is sensitive to leverage and structured products; and long-term OG holders are taking advantage of the current environment to reduce their holdings.
The initial narrative of decentralization/monetary revolution remains conceptually appealing, but the reality is:
- The current dominant capital flows mainly come from financialization activities : yield strategies, derivatives, and short vol.
- Bitcoin's true performance is closer to that of a tech beta than a neutral, robust macro hedge.
I still believe that 2026 could be a major turning point for Bitcoin (a new policy cycle, potential stimulus, and further erosion of trust in traditional assets could all contribute to this turning point).
However, investors need to recognize that at this stage, Bitcoin has not yet provided the hedging properties that many people expect; it remains part of the liquidity complex that we are concerned about.
8. Scenario Framework for Towards 2026
A useful way to understand the current environment is to view it as a “controlled bubble release” designed to make room for the next round of stimulus.
The possible order is as follows:
1) Mid-2024-2025: Controlled tightening and pressure.
- Government shutdowns and political disorder cause cyclical drags;
- The Federal Reserve has adopted a hawkish stance in its rhetoric and balance sheet, tightening financial conditions.
- Credit spreads widened slightly; speculative sectors (AI, long-duration technology, and some private lending) were the first to absorb the impact.
2) End of 2025-2026: Entering the phase of re-injecting liquidity in the political cycle.
- With inflation expectations declining and markets experiencing a correction, policymakers have regained "room for easing."
- Interest rate cuts and fiscal measures began to emerge, and were calibrated around growth and election goals;
- Due to the lag effect, the consequences of inflation will appear after key political junctures.
3) After 2026: System repricing.
The scale and form of the next round of stimulus will determine the future path:
- Either a new round of asset inflation will occur, accompanied by stronger political and regulatory intervention;
- Alternatively, we can address the structural issues of debt sustainability, concentration, and social contract more directly.
This framework is not decisive, but it is highly consistent with current incentives:
- Politicians prioritize reelection over long-term balance;
- The easiest policy tools to use remain liquidity and transfer payments, rather than structural reforms;
- To use these tools again, they first need to deflate the current bubble.
in conclusion
All the signals point to the same conclusion: the system is entering a more fragile and error-intolerant phase of its cycle.
Historically, policymakers have ultimately responded with massive liquidity. But before moving to the next phase, we must traverse a period dominated by the following characteristics:
- Stricter financial conditions
- Higher credit sensitivity
- More intense political turmoil
- And increasingly nonlinear policy responses.


