
HashWhale BTC Mining Weekly Report | Macro disturbances continue, and the competitiveness of large mining companies stands out (6.28-7.04)
Author: Monchi | Editor: Monchi
1. Bitcoin Market
From June 28 to July 4, 2025, the specific trend of Bitcoin is as follows:
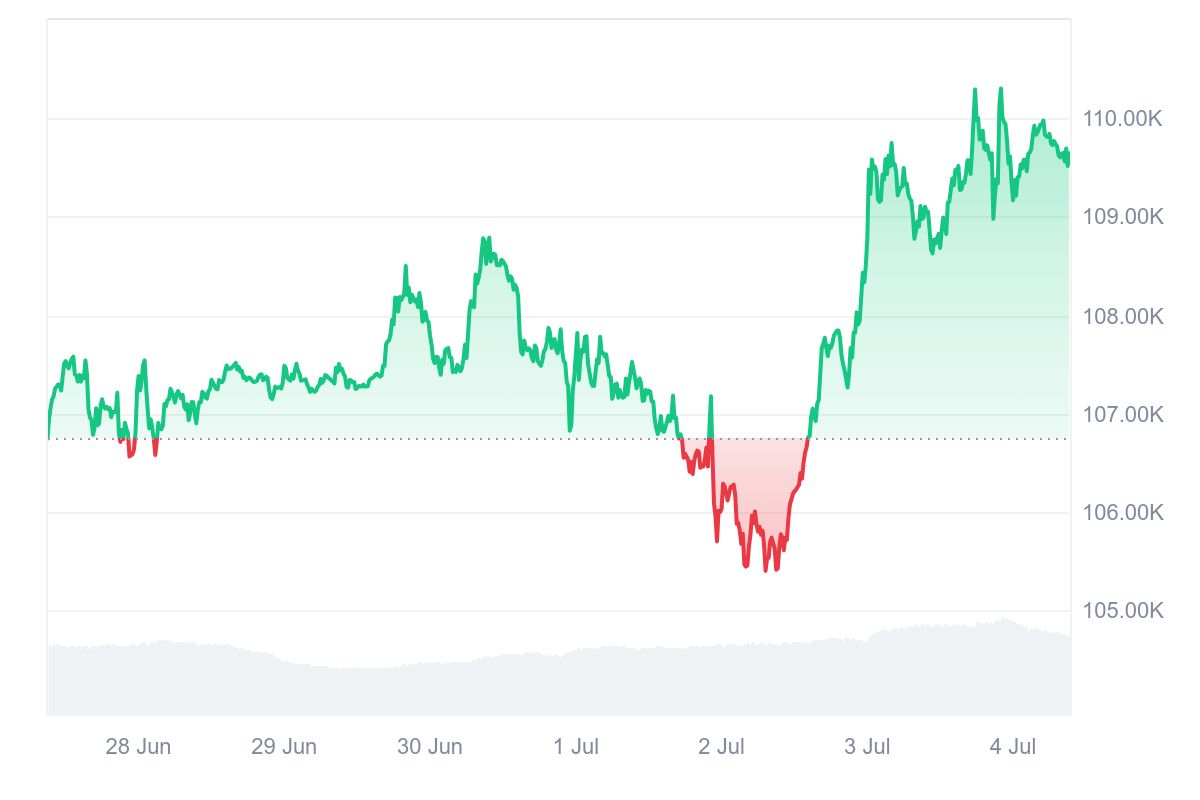
June 28 : Bitcoin continued its previous wide range of fluctuations, falling to $106,543 during the session, and then rebounded to $107,220, breaking away from the short-term wide range of fluctuations. After a slight decline, it continued to climb to $107,512, but fell again in the late trading, hitting $107,152, and finally closed at $107,484.
June 29 : The intraday fluctuation range narrowed significantly, and the price was in a narrow range between $107,200 and $107,500. The bulls strengthened in the evening, and the price quickly rose from $107,382 to $108,432, setting a new stage high, but then encountered resistance and fell back, closing at $107,745.
June 30 : Continuing the previous day's decline, the price temporarily stopped falling after dropping to $107,375 at the beginning of the session, and a new round of upward trend appeared. The price quickly rose to $108,779, but failed to stabilize at the high level. It then gradually fell back to $107,574 and fluctuated around $107,600. The market fluctuated violently again in the evening, and the price broke through the key support of $107,000 in the short term, falling to a minimum of $106,823, but soon rebounded to $107,817, indicating that the long-short game was fierce.
July 1 : Bitcoin showed an overall volatile downward trend, starting from $107,721 and fluctuating downward all the way. It hit a low of $106,500 in the evening and then briefly went sideways. It then rebounded to $107,172, but then fell back to a low of $105,696, and finally closed at $106,027, closing the day with a negative line.
July 2 : Bitcoin's initial decline continued, and it continued to fluctuate downward in the morning, hitting a low of $105,398 before stabilizing. It then rebounded strongly, with the price rising sharply to $109,615. The intraday fluctuation exceeded $4,200, setting a record for the largest single-day rebound in this cycle, indicating a strong willingness for longs to enter the market at low levels and a phased recovery in market sentiment.
July 3 : The bulls continued their rebound momentum, and the price reached $109,745 before a technical correction, falling back to $108,626 in the short term. After adjustments, it broke through the previous high again, reaching $110,293, and then fell back to consolidate. It hit a second high during the session, setting a high of $110,304 this week. Despite multiple attempts to stabilize above $110,000, it failed to stabilize and fell slightly to $109,166 in the late trading, indicating that there is strong resistance at this level.
July 4 : Bitcoin rose slightly, reaching $109,977 during the day, and then fell back to around $109,640 for sideways trading. As of now, the price is temporarily reported at $109,645, maintaining a high consolidation trend.
Summarize
This week, Bitcoin fluctuated widely. Affected by macro news, the overall market showed a three-stage trend of "sideways consolidation-retracement-strong rebound and high-level consolidation". From the 28th to the 29th, the market trading sentiment was cautious and Bitcoin was sideways. Due to the lack of key catalyst news, investors generally took a wait-and-see attitude, waiting for the release of the next stage of direction signals; from July 1st to 2nd, it continued to fluctuate and fall in a wide range. This decline was because traders were risk-averse before the release of important US economic data, waiting for the first unemployment claims or broader macro solutions to be announced on July 3rd to bring clarity; from July 2nd to 3rd, Bitcoin started a rapid rebound, mainly driven by the technical oversold rebound and the weak US employment data, which triggered the market's expectations of a Fed rate cut.
Bitcoin price trend (2025/06/28-2025/07/04)
2. Market dynamics and macro background
Fund Flows
1. Whale Movements and On-chain Funding Trends
Whale selling pressure increased: As of June 30, on-chain data showed that Bitcoin whales had sold more than 40,000 BTC (about US$4.3 billion), which was concentrated when the BTC price approached US$110,000, indicating that the market was facing significant selling pressure.
Long-term holders are active: The Liveliness indicator has risen, reflecting that long-term holders (LTH) have begun to actively transfer assets and the bearish sentiment in the market is heating up.
Miners and LTH simultaneously reduce their holdings: CryptoQuant analysis points out that the current scale of miners and LTH selling exceeds the funds of new buyers, indicating that the market demand is weak and potential prices are under pressure.
2. Overall flow of digital asset investment products
In the week of June 30, the total net inflow of global digital asset investment products was US$2.7 billion, marking the 11th consecutive week of net inflow. Among them, Bitcoin products inflow was about US$2.2 billion, accounting for 83%, indicating that BTC is still the preferred asset of institutions. The cumulative net inflow in the first half of the year has reached US$17.8 billion, a record high for the same period in history.
3. On-chain supply and liquidity status
New low for BTC reserves on exchanges: As of July 2, the proportion of Bitcoin reserves on exchanges fell to 14.5%, the lowest level in seven years, indicating a tightening of market liquidity, which is potentially bullish for medium- and long-term prices.
Declining on-chain supply activity: Over the past 30 days, the active on-chain supply of Bitcoin has fallen by about 17%, suggesting that short-term supply willingness has weakened and the market is waiting for the next round of price signals or turning points.
4. Changes in market value and capital scale
As of July 1, the total market value of Bitcoin was approximately US$2.109 trillion, down slightly from US$2.158 trillion on June 30. Although funds fluctuated significantly in the short term, they were still at historical highs overall, reflecting that the market still had strong support.
5. Spot Bitcoin ETF
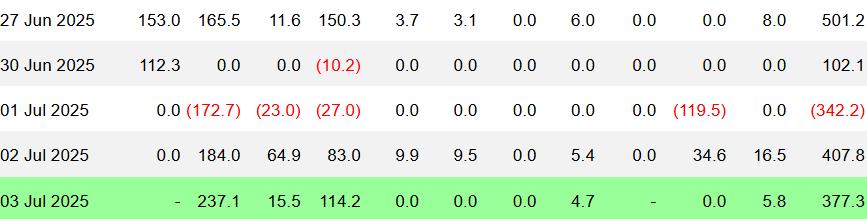
This week's daily ETF inflow/outflow details:
June 30: +$102.1 million
July 1: -$342.2 million
July 2: +$407.8 million
July 3: +$377.3 million
On July 1, there was a net outflow of more than $300 million in a single day, but there was a strong return in the following two trading days. On July 2 and 3, a total of nearly $790 million flowed in, basically offsetting the previous outflow pressure. Overall, after a short period of profit-taking, institutions quickly restarted their allocation actions, showing that they still maintain a positive attitude towards the medium- and long-term market trend.
ETF Inflow/Outflow Data Image
Weekly/quarterly funding data summary
June 24-28: Net inflow ≈ $2.22 billion, of which BlackRock IBIT contributed $1.31 billion, Fidelity $504 million, and GBTC had a net outflow of $5.69 million.
Net inflow for the whole month of June: US$4.6 billion, an increase of approximately 43,000 BTC.
Q2 full quarter net inflow: Bitcoin ETF total inflow ≈ 123,000 BTC (≈ US$12.6 billion).
Although there were capital outflows on some trading days in the short term, especially due to the disturbance of macro data and the Fed's interest rate hike expectations, the overall capital flow still maintained a strong net inflow trend, especially at the end of June, ETFs continued to attract funds, reflecting institutional investors' recognition and confidence in the value of Bitcoin's medium- and long-term allocation. As an important bridge connecting traditional capital markets and encrypted assets, ETFs are constantly consolidating their capital absorption capacity and market influence.
Technical indicator analysis
1. Relative Strength Index (RSI 14)
According to Investing.com data, as of July 4, 2025, Bitcoin's 14-day relative strength index (RSI) was 53.011, in the neutral to strong range (50-70). This value indicates that the current market has not entered an overbought or oversold state, and is in a relatively balanced trend pattern, slightly biased towards bullish forces. RSI remains above 50, indicating that buying still has a certain advantage, but the momentum is not strong, and no obvious trend breakthrough has yet formed.
If the RSI can continue to break through the 60 area and is accompanied by an increase in price volume, a new round of upward momentum is expected to form; on the contrary, if the RSI falls back below 50, it may suggest that short-term market momentum is weakening and we need to be alert to the risk of price shocks and pullbacks.
2. Moving Average (MA) Analysis
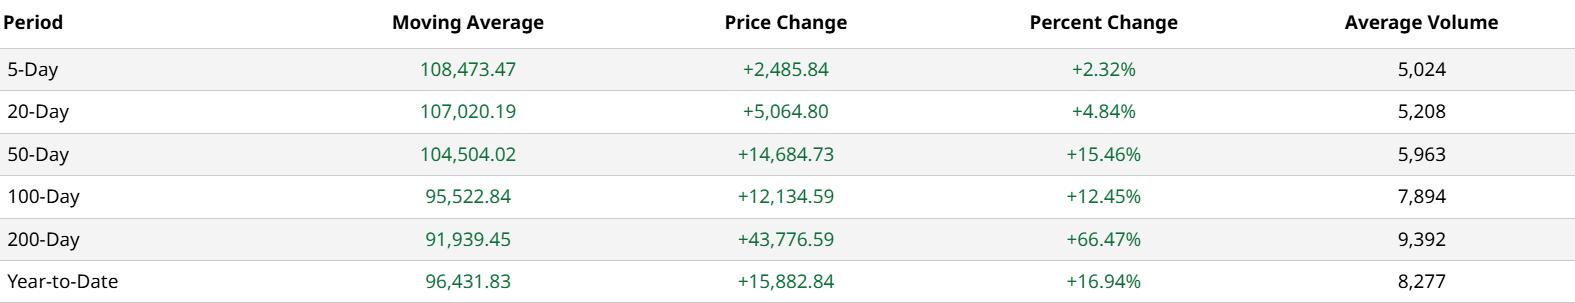
5-day moving average (MA 5): $108,473.47
20-day moving average (MA 20): $107,020.19
50-day moving average (MA 20): $104,504.02
100-day moving average (MA 100): $95,522.84
200-day moving average (MA 200): $91,939.45
Current market price: $109,645.94
MA 5, MA 20, MA 20, MA 100, MA 200 data pictures
From the arrangement of the moving averages of each period, it shows a standard bullish arrangement structure (short-term > medium-term > long-term). In particular, the current price is running above all major moving averages, indicating that Bitcoin is in a strong upward trend as a whole. In the short term, the upward slope of MA 5 and MA 20 indicates that the market maintains good momentum and investor sentiment is bullish.
It is particularly noteworthy that the current price is stable above MA 20 and MA 50, indicating that there is effective support in the short-term market correction. If it can continue to stay above MA 20 and accompanied by an increase in trading volume, it is expected to continue to push up prices to challenge a higher range; on the contrary, if it falls below MA 20, it may trigger a phased adjustment and test the support near MA 50.
3. Moving Average Convergence Divergence (MACD) Analysis
According to Investing.com data, as of July 4, the MACD fast line was 283.05, remaining in the positive range and continuing to rise, indicating that the market is in a bull-dominated pattern with sufficient momentum. This value is a two-week high, and technically supports further price increases.
MACD currently sends a "Buy" technical signal, and the market trend is bullish. It is expected to maintain high fluctuations or moderate upward in the short term. However, it is necessary to pay attention to whether the growth rate of the histogram slows down. If there are signs of top divergence (the price reaches a new high but the MACD histogram does not rise synchronously), it is necessary to be vigilant about technical adjustments caused by the weakening of short-term momentum. If MACD can continue to rise and maintain the golden cross state, the price is expected to continue to hit above $110,000; on the contrary, if a dead cross signal appears or the histogram turns negative, it may trigger a short-term retracement.
4. Key support and resistance levels
Support level : Bitcoin's current short-term key support levels are $109,000 and $107,500. In the context of technical price corrections, these two positions showed obvious support effects on July 3 and June 30, respectively. Among them, $109,000 successfully took over the downward trend during the intraday adjustment on July 3, showing strong buying power. $107,500 was not broken in the two rounds of corrections on June 30, further verifying its effectiveness as a structural support. If the price continues to fall, the next important support area is $105,500. This price effectively supported the downward trend during the sharp drop on July 2.
Resistance : The main resistance level facing Bitcoin in the short term is $110,300. In the upward test on July 3, the price approached this level twice but encountered significant selling pressure and failed to achieve an effective breakthrough, reflecting that there is a strong short-selling defense and selling pressure at this resistance level. If the subsequent market can break through with large volume, Bitcoin is expected to rise further and challenge higher resistance areas. At that time, it is necessary to focus on the simultaneous expansion of trading volume and the effectiveness of price stabilization.
On the whole, Bitcoin currently maintains a high-level oscillation pattern as a whole, and the technical side presents a relatively strong oscillation structure. Bulls are still dominant, but we need to pay close attention to the breakthrough and stabilization of key prices to determine the next trend direction.
Market sentiment analysis
1. Emotional profile
This week (June 28 – July 3), the overall sentiment of the Bitcoin market showed a volatile trend, showing that investors are highly sensitive and uncertain about the market direction. From June 28 to 30, the price of Bitcoin showed an upward trend, investor sentiment tended to be optimistic, and market trading sentiment warmed up; from July 1 to 2, the market showed a significant correction, the price of Bitcoin fell sharply, and the market panic sentiment rebounded; from July 2 to 3, Bitcoin rebounded strongly, with a single-day increase of 4.13%, effectively breaking through the previous downward trend, market confidence rebounded significantly, and sentiment quickly recovered.
Overall, the market rebounded quickly after a short-term correction, indicating that sentiment is still relatively resilient at the current stage, but the game between bullish and bearish sentiment is still relatively fierce in the short term.
2. Key Sentiment Indicators (Fear and Greed Index)
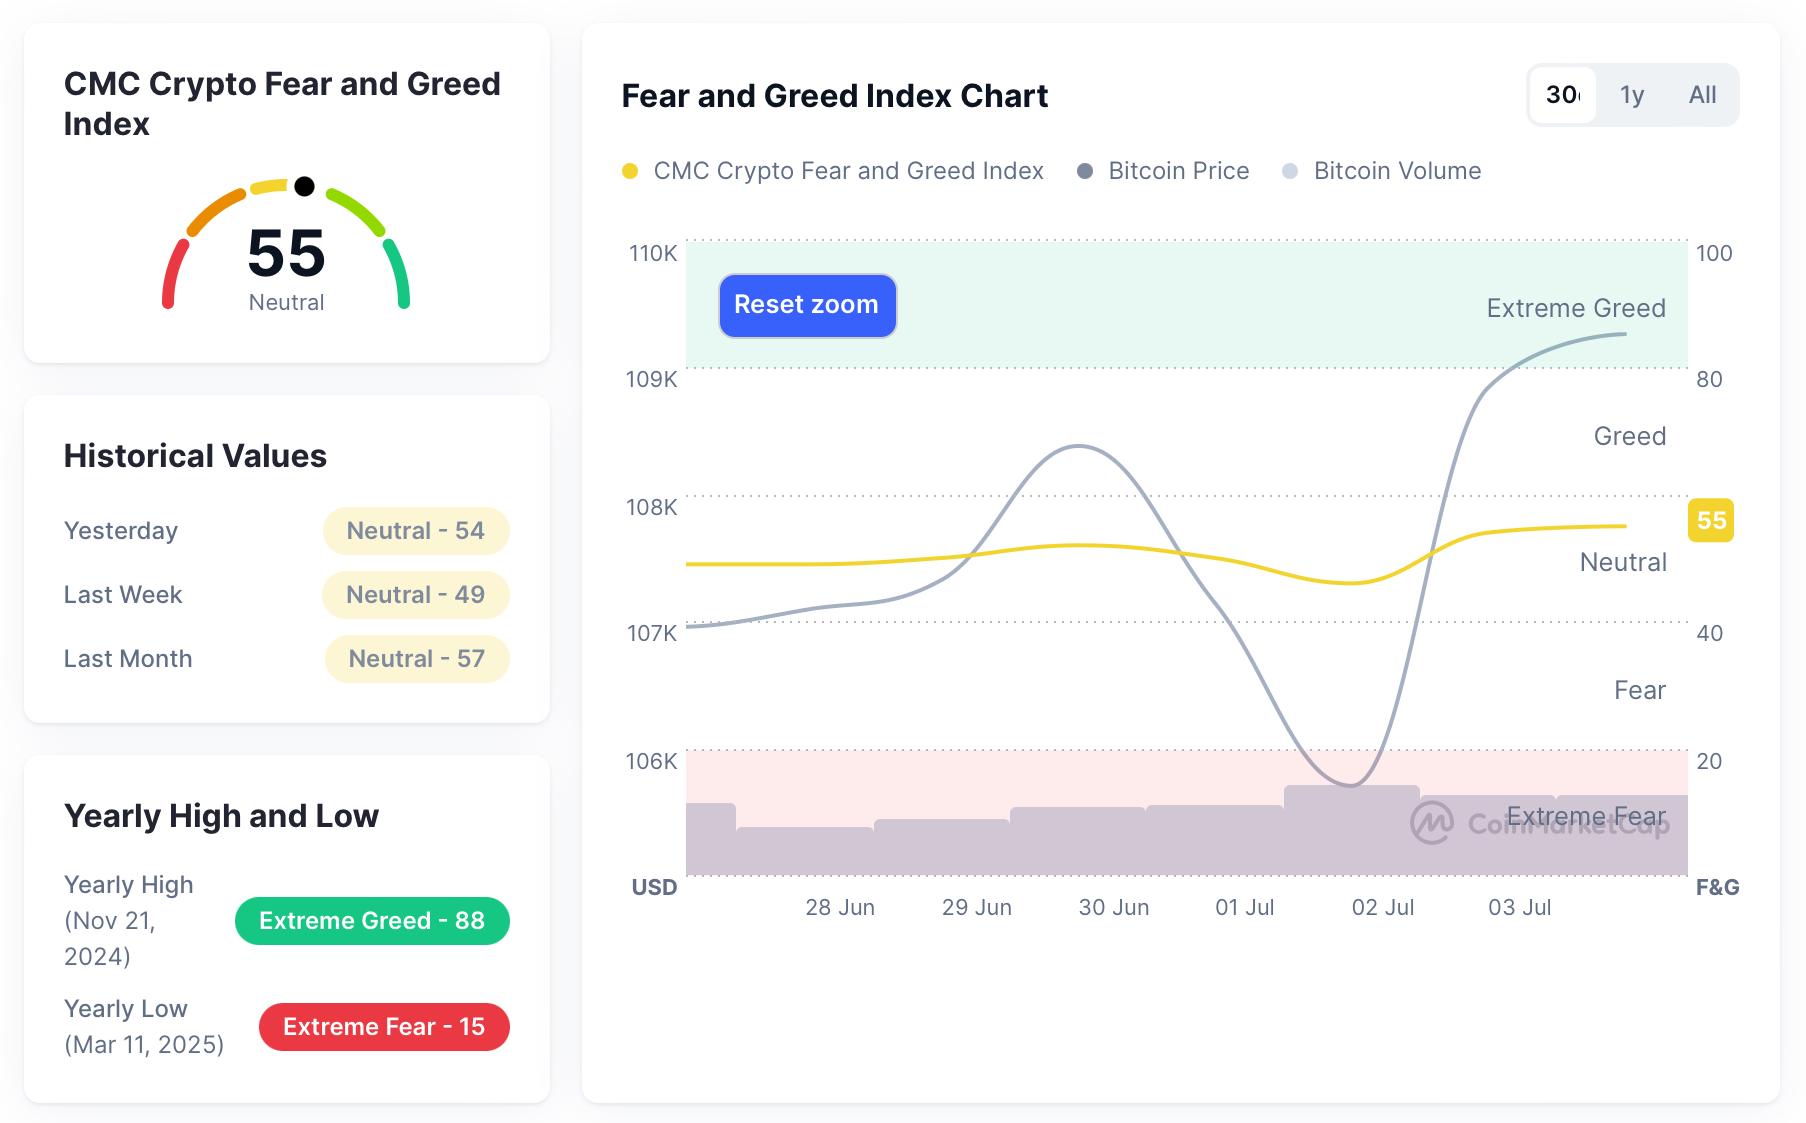
As of July 4, the Fear & Greed Index was at 55, which is in the "neutral" range. This shows that market sentiment tends to be cautiously optimistic, and investors have not yet entered a clear greed or fear stage.
Looking back at this week (June 28 – July 3), the daily values of the index were: 49 (neutral), 50 (neutral), 52 (neutral), 50 (neutral), 46 (neutral), 54 (neutral). Overall, although the index has always remained in the "neutral" range, the fluctuation range reflects the rapid switching of market sentiment, especially during periods of sharp price fluctuations, the index has obvious ups and downs. This phenomenon shows that the current market has not yet formed a consistent trend expectation, and investors are still paying close attention to multiple factors such as macroeconomic data, policy trends, and on-chain data to determine the future direction.
Fear and Greed Index Data Picture
Macroeconomic Background
1. Trump's policy offensive intensifies: tax cuts + attack on the Federal Reserve
July 1, "Big Beautiful Bill" tax reform bill advances
Trump's team pushed the "Big Beautiful Bill", a massive tax reform bill, through the Senate, with a scale of up to $4.5 trillion, covering corporate tax cuts, middle-class tax rebates, and a 50% reduction in capital gains tax. Although the bill still needs to be passed by the House of Representatives and there are still objections within the Republican Party, its strong "tax reduction" stance has been seen by the market as Trump's "post-election policy roadmap."
If substantial tax cuts are implemented, they will release liquidity in the medium to long term, boost valuations of risky assets, and provide medium-term benefits to non-sovereign assets such as Bitcoin.
On July 2, Trump again criticized Powell and the Fed
He publicly accused the Fed of "helping Biden win reelection" by delaying rate cuts, and hinted that he would "clean up" the Fed if elected. Although such politicized remarks create uncertainty in the short term, they reinforce market concerns that monetary policy will be subject to political interference, triggering short-term volatility.
Tax reform brings mid-term positive expectations, and Trump's remarks create short-term volatility opportunities. As a "decentralized asset", Bitcoin may attract attention from investors in the expectation of "system confrontation".
2. Tensions in the Middle East: Geopolitical conflicts re-emerge
On June 30, Israel launched an airstrike on Iranian targets in Syria . According to Reuters, Israel launched an airstrike on pro-Iranian armed positions in Syria, and Iran warned that it would "reserve the right to retaliate." The United States also mobilized an aircraft carrier to enter the eastern Mediterranean to deter. Although the incident did not escalate substantially, it stimulated risk aversion and caused Bitcoin to break through a key position in the short term. If the conflict intensifies (such as Iran mobilizing allied forces or the US military intervening), Bitcoin may be favored by funds as a "war safe-haven asset"; on the contrary, if the situation eases, there is a risk of adjustment after the "good news is realized."
3. U.S. stocks strengthened, and risk sentiment spilled over to the crypto market
As of June 30, the S&P 500 and the Nasdaq hit new all-time highs <br>Driven by the rise of technology stocks, tax cut expectations and geopolitical risks, the US stock market continued to be strong. The recovery of capital risk appetite also drove Bitcoin to a short-term high of $108,000, showing a significant linkage between traditional and crypto markets. Against the backdrop of high risk sentiment, Bitcoin benefited from cross-asset rotation allocation, and its short-term upward momentum was enhanced.
4. Weak economic data strengthens expectations of rate cuts
The ISM manufacturing index released on July 1 fell to 48.9, below the boom-bust line . According to the official ISM report, the ISM manufacturing PMI in June was 49.0%, which was slightly higher than 48.5% in May, but still below the boom-bust line, marking the fourth consecutive month of contraction in the manufacturing industry.
Initial jobless claims rose to 240,000 on July 3, exceeding market expectations
The number of initial unemployment claims released on July 3 was 239,000, higher than market expectations, indicating some loosening in the job market. The number of continuing claims remained at about 1.68 million, still relatively stable but rising. Combined with the decrease in JOLTS job vacancies in June and the slowdown in corporate recruitment, it reflects that the labor market is cooling down and the pace of employment recovery is slowing down. This series of data reinforces the market's expectation that the Federal Reserve will start cutting interest rates before the end of the year.
NFP and ADP data showed that the weak labor market trend continued . The market expected NFP to add about 110,000 jobs in June and the unemployment rate to rise to 4.3%; ADP private sector employment even recorded -33 K, far below expectations.
In the short term, the cooling of the economy strengthens bets on a rate cut in Q4, which is conducive to the re-heating of the logic of Bitcoin as an "anti-inflation asset"; in the medium term, if the data continues to weaken and core inflation falls simultaneously, the probability of the Fed's policy shift this year will increase, which is expected to open a new round of upward channel for Bitcoin; risk, if the stickiness of inflation is not resolved (such as rents and core services remain strong), the Fed may continue its "wait-and-see" attitude, which will suppress market optimism.
3. Hash rate changes
Between June 28 and July 4, 2025, the Bitcoin network hash rate fluctuated as follows:
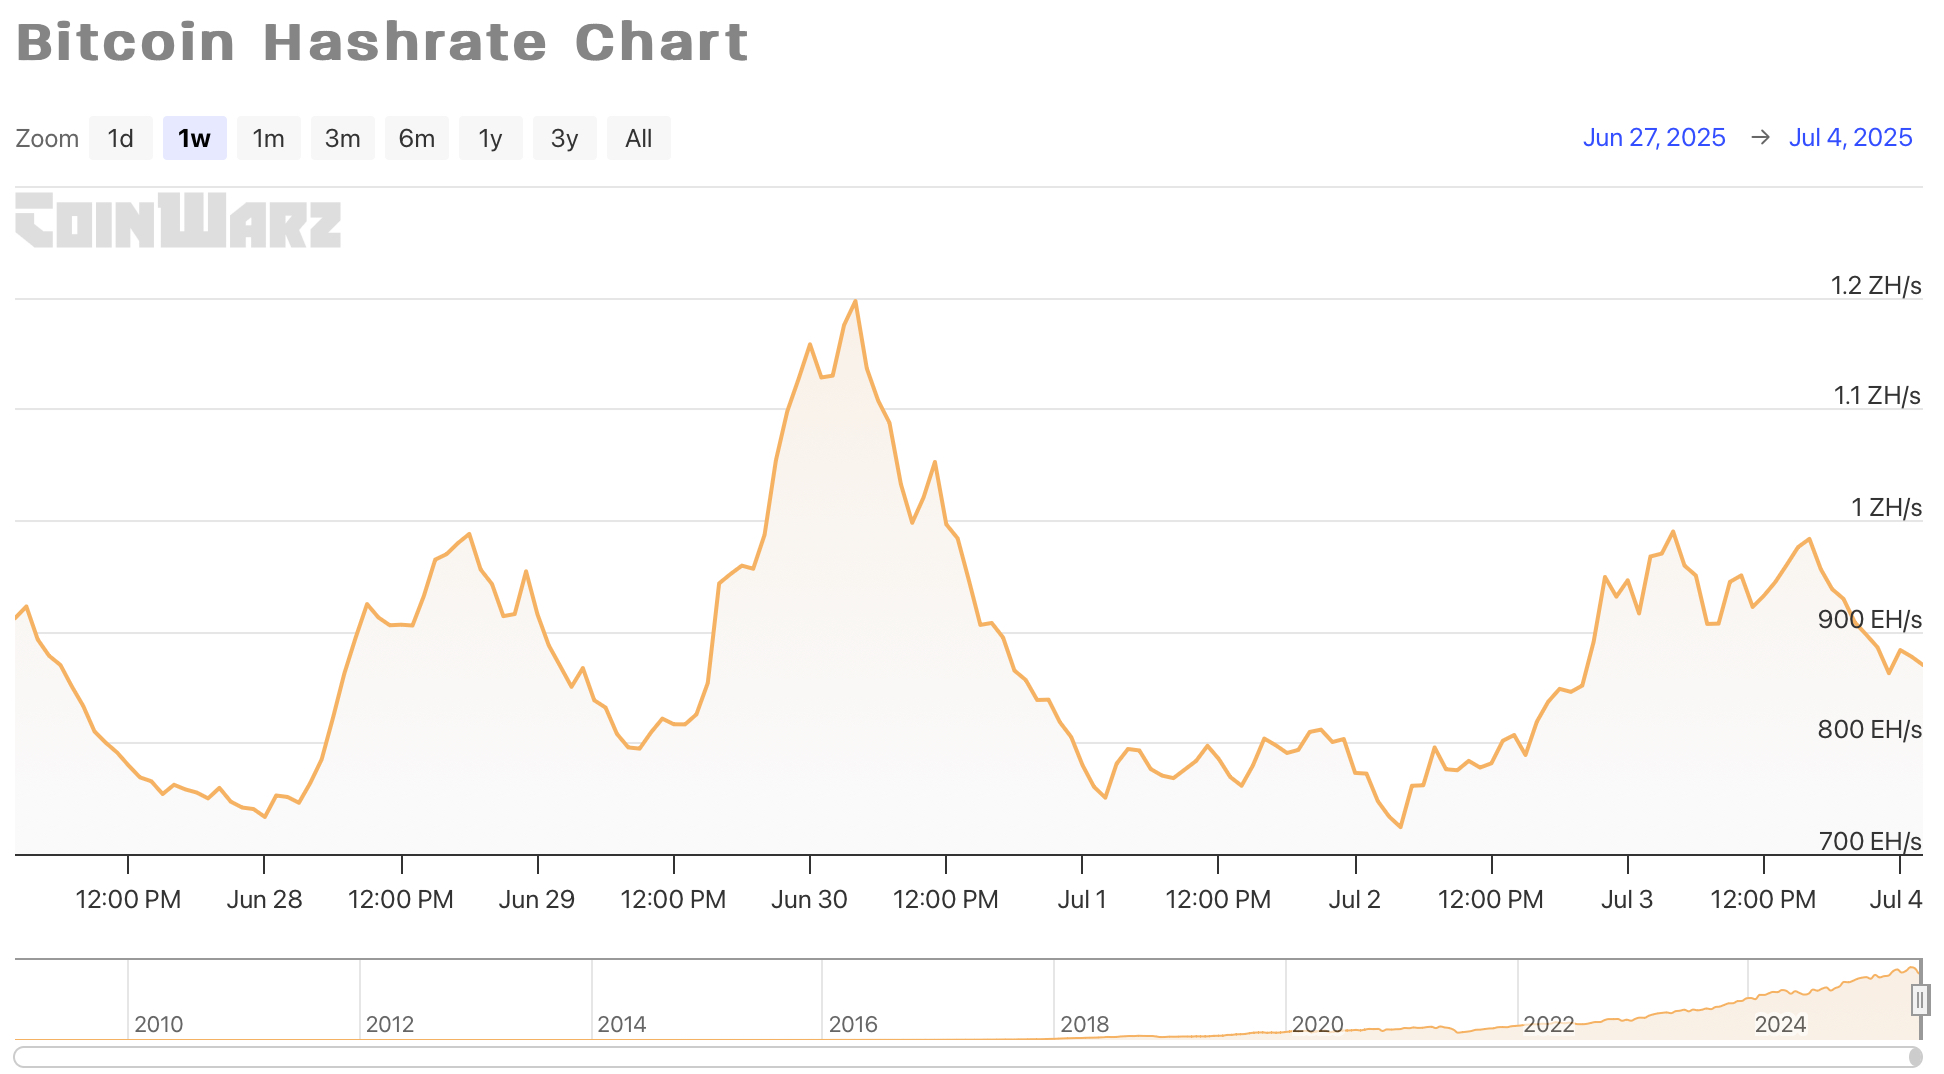
On June 28, the total Bitcoin network computing power (hash rate) rose and then fell back, rising rapidly from 733.27 EH/s to a daily high of 987.48 EH/s, and then fell back to 915.33 EH/s at the end of the day. On June 29, the hash rate continued the previous day's decline and fell further to 794.63 EH/s, then rebounded and rose sharply to 1126.8 EH/s, indicating a rapid return of computing power. On June 30, the total network hash rate continued to rise, reaching a peak of 1196.7 EH/s this week, but then fell sharply to 779.70 EH/s at the end of the day, with a significant correction. On July 1, the Bitcoin hash rate maintained a low-level fluctuation trend, running between 750 EH/s and 820 EH/s overall, and closed at 772.82 EH/s at the end of the day, indicating that miners may be in a dynamic adjustment stage. On July 2, the hash rate of the entire network showed a slow recovery trend during the day after running at a low level the previous day. It gradually rose from 724.12 EH/s to 948.79 EH/s near the end of the day, indicating that some miners' computing power was reconnected to the network and the pace of computing power release was accelerated. On July 3, the hash rate of the entire network continued the upward trend of the previous day, rising to 989.68 EH/s. After a brief and slight decline, it rebounded to 983.02 EH/s, and then fell again, falling to 862.41 EH/s near the end of the day, showing a trend of computing power fluctuations.
Overall, the hashrate remained below 1 ZH/s (i.e. 1000 EH/s) for most of this week, especially from July 1 to July 2, when the hashrate fluctuated at a relatively low level, which may be related to the temporary shutdown of mining farms or the outflow of hashrate due to Iran’s recent military actions, which led to a short-term release of hashrate and an overall decline in network hashrate. Such geopolitical risks have had a significant impact on the layout and stability of hashrate, reflecting miners’ sensitive response to emergencies and the flexibility of hashrate allocation.
Bitcoin network hash rate data
4. Mining income
According to YCharts data, the total daily income of Bitcoin miners this week (including block rewards and transaction fees) is as follows: June 28: $49.72 million; June 29: $57.85 million; June 30: $49.33 million; July 1: $45.81 million; July 2: $52.80 million. It can be seen that the average daily total income of miners this week is roughly maintained between $45 million and $53 million, with limited overall fluctuations and relatively stable performance. The income structure is still dominated by block rewards, and the proportion of transaction fee income fluctuates less, indicating that the recent on-chain transaction activity is at a neutral level. In the context of the current high-level fluctuation range of Bitcoin prices, block rewards still constitute the main income, and the proportion of transaction fee income is low but stable, reflecting that the on-chain transaction activity is at a neutral level and has not yet entered an extremely hot or cold state.
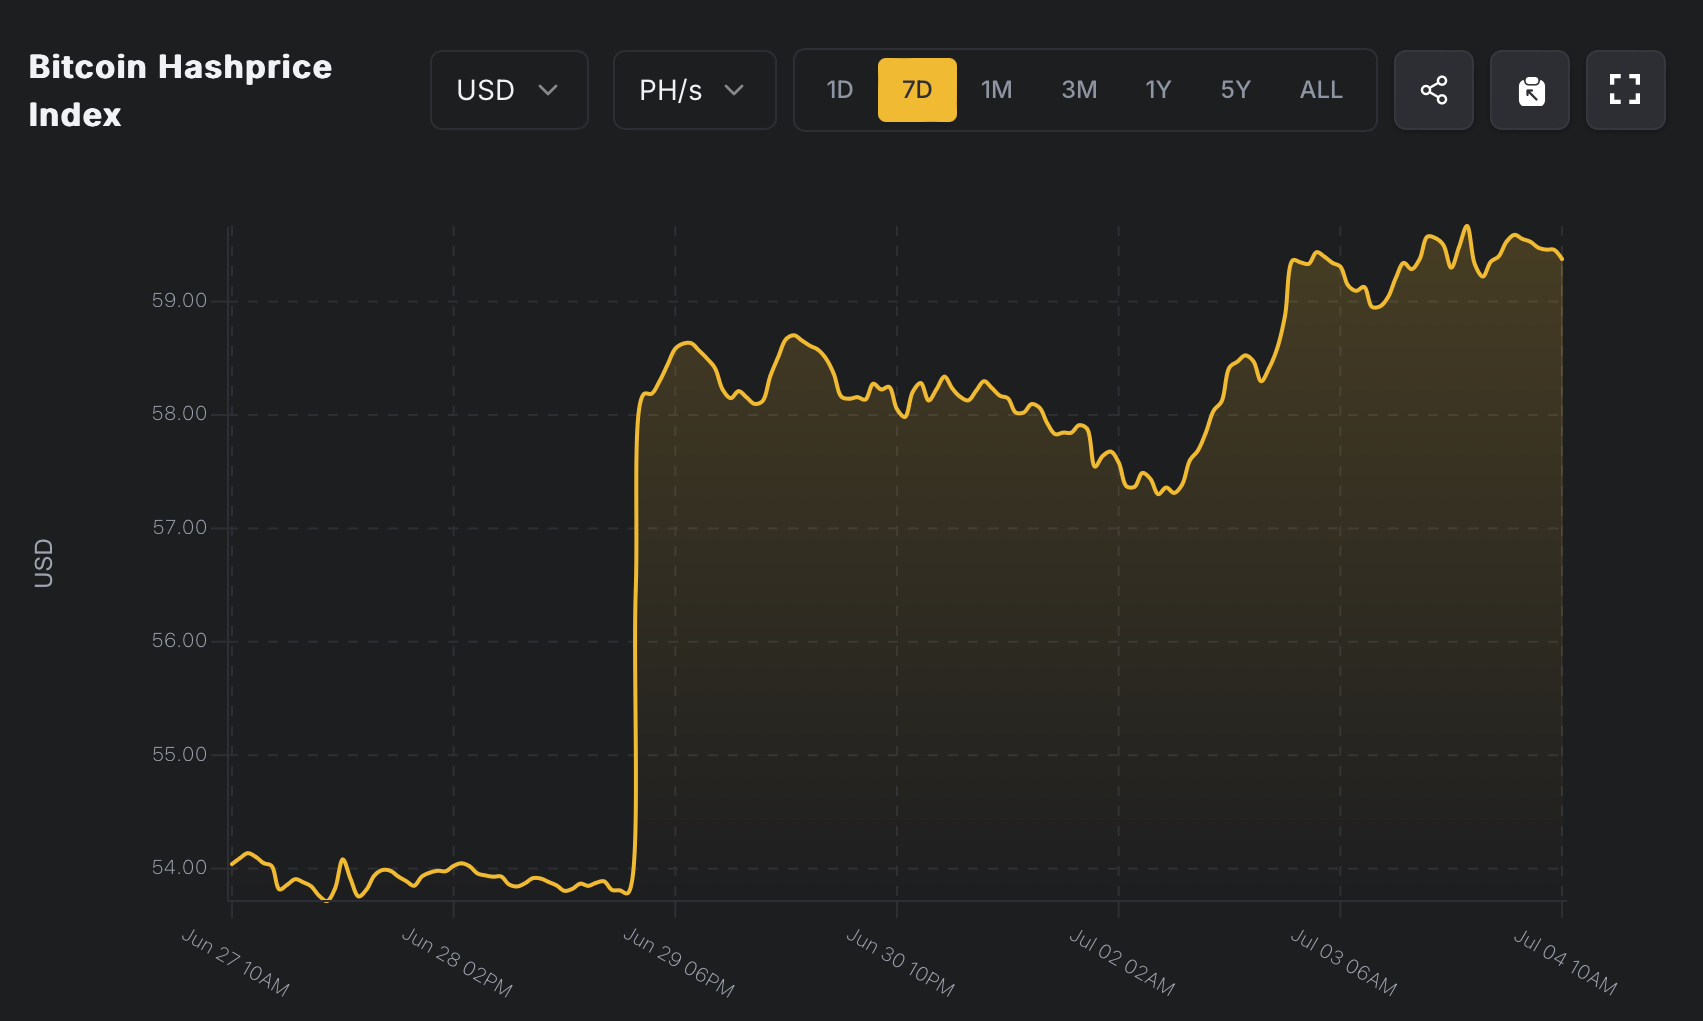
From the perspective of Hashprice (daily revenue per unit of computing power), this week's performance showed the structural characteristics of "short-term rapid increase". As of the time of writing on July 4, Hashprice was temporarily reported at $59.35/PH/s/day, close to a relatively high level. According to Hashrate Index data, from June 28 to 29, Hashprice was stable at around $53.85/PH/s/day with slight fluctuations. Starting at noon on June 29, the unit computing power revenue suddenly rose, from $53.78/PH/s/day to $58.18/PH/s/day, a single-day increase of nearly 8.2%. This abnormal movement may be directly related to geopolitical emergencies (such as Israel's air strikes on Iran on June 29). According to multiple sources, the attack damaged some of Iran's power infrastructure and affected many local Bitcoin mining bases, causing the regional computing power to run at a low level in the short term, lengthening the time for the entire network to generate blocks, and increasing the proportion of Bitcoin rewards that can be obtained per unit computing power, thereby driving the Hashprice (unit computing power income) to rise rapidly. On June 30, Hashprice rose to $58.70/PH/s/day; on July 2, it fell slightly to $57.30/PH/s/day; on July 3, it rose again, reaching a high of $59.43/PH/s/day this week, close to the second highest level. The strengthening of Hashprice has offset the squeeze effect brought about by the increase in computing power after the halving to a certain extent, and increased the living space of small and medium-sized miners in the short term.
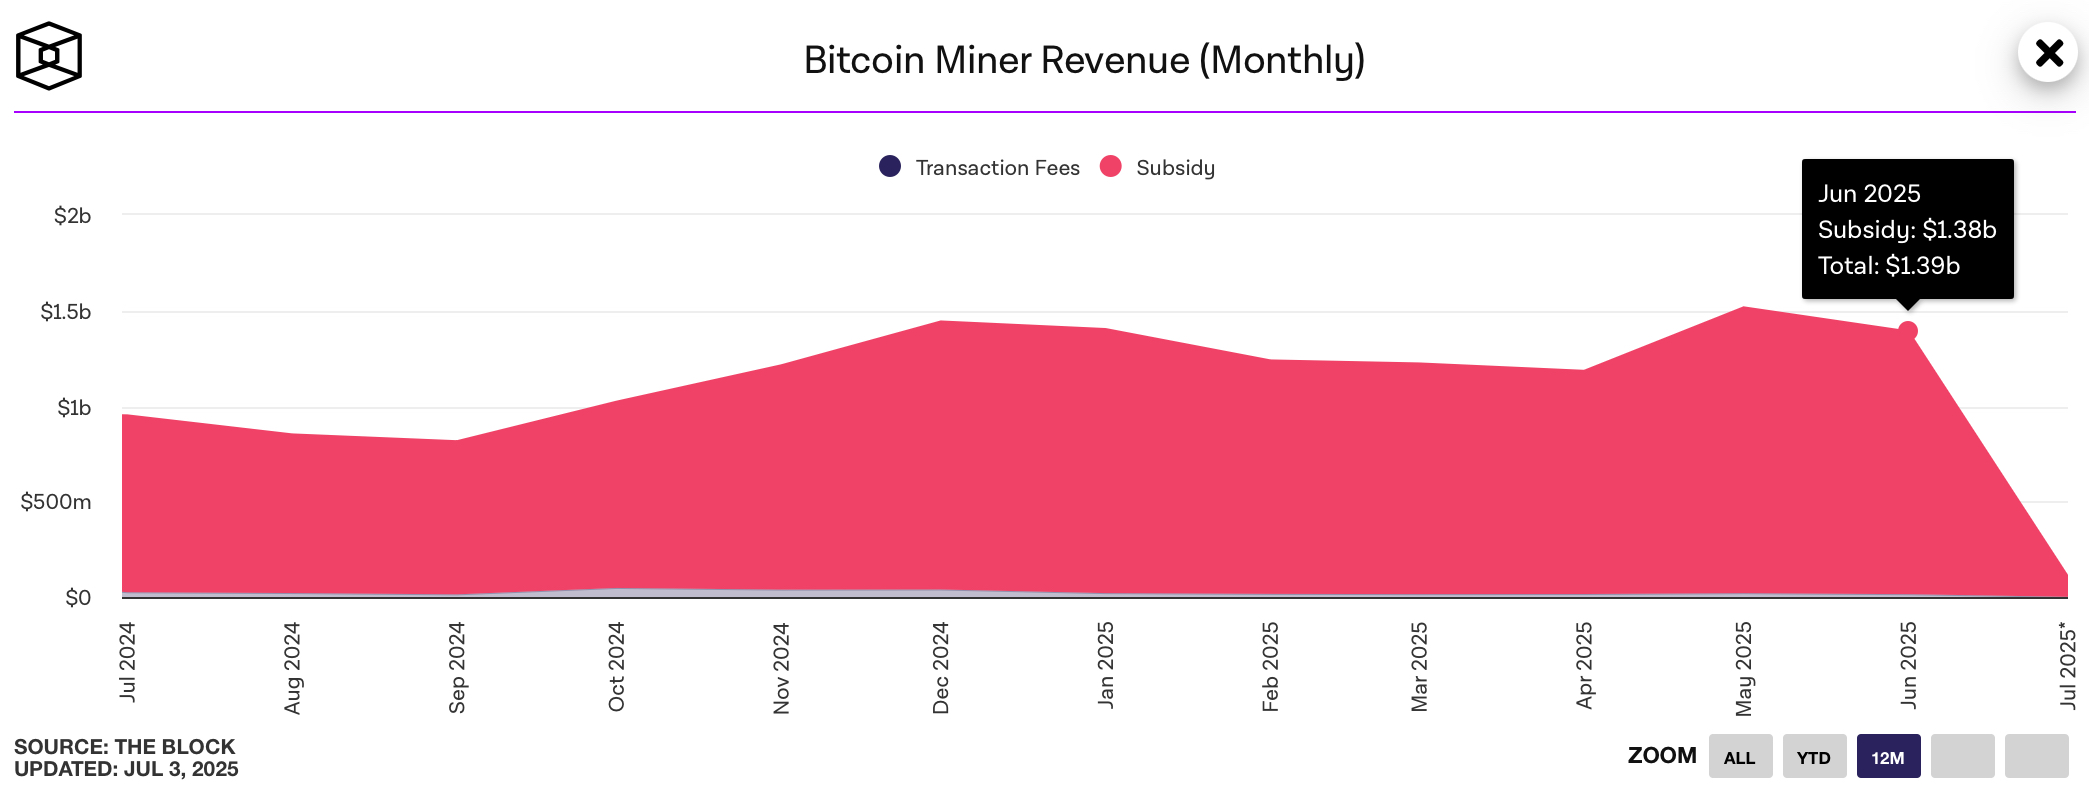
According to data from The Block, the total revenue of Bitcoin miners in June 2025 is about $1.39 billion, down about 8.6% from $1.52 billion in May 2024. Despite a certain decline, the monthly revenue of $1.39 billion is still at a historical high, indicating that the fundamentals of the current Bitcoin network are still resilient, especially in the context of high-priced fluctuations and stable network usage, the profitability of the mining industry chain is still sustainable. In the medium and long term, with the introduction of new businesses such as AI+blockchain, the entry of more institutional investors, and the global optimization of energy structure, the mining ecology may present a more diversified development pattern.
Hashprice data
Bitcoin miners monthly income data
5. Energy costs and mining efficiency
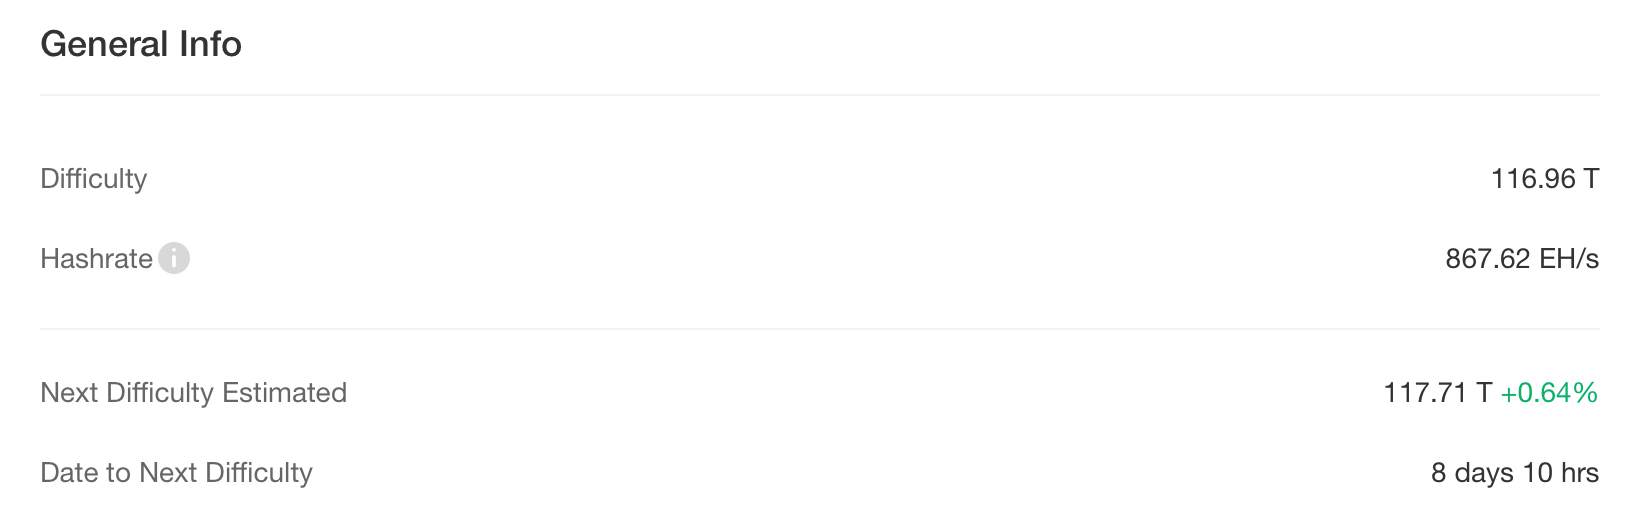
According to CloverPool data, as of July 4, 2025, the total computing power of the Bitcoin network has reached 867.62 EH/s, and the current mining difficulty of the entire network is 116.96 T. The next round of difficulty adjustment is expected to be carried out on July 12, with an estimated increase of 0.64%, when the difficulty will rise to 117.71 T. This reflects that the overall computing power of the network remains high and shows a moderate growth trend. On the one hand, the slight increase in difficulty shows that the current market confidence is good and miners are still willing to continue to invest in computing power; on the other hand, it also shows that the recent computing power growth rate is relatively stable, without excessive expansion or drastic fluctuations.
From the perspective of mining costs, according to the latest MacroMicro model, as of July 2, 2025, the unit production cost of Bitcoin is approximately US$87,939.87, while the spot price during the same period is US$108,859.32, corresponding to a mining cost-to-price ratio of 0.91. This indicator is generally regarded as an important reference value for assessing the sustainability of mining activities. Historical data shows that when the ratio is between 0.8 and 1.0, it means that the mining industry is in a "healthy range" - miners can obtain reasonable profits, and at the same time, the irrational expansion of computing power will not be caused by excessive profits. The current level of 0.91 shows that miners across the network are still in a stable profit state, but the overall profit margin is limited and is still constrained by factors such as electricity costs, equipment efficiency and operating scale.
It is worth noting that according to the latest information released by CryptoQuant CEO Ki Young Ju on July 2, the current unit mining cost of Marathon Digital Holdings (MARA), one of the leading mining companies in the United States, is only about US$51,000, with a profit margin of nearly 2 times, which is far lower than the industry average. This significant cost advantage is mainly due to its large-scale operation, high-performance mining machine deployment and low electricity price strategy, highlighting the strong competitiveness of large mining companies in energy efficiency management and resource integration. The profit gap between leading miners and small and medium-sized mines is accelerating, forming a clear structural differentiation: large mines have the ability to make continuous profits, while small and medium-sized miners, especially those that rely on old equipment or are located in areas with high electricity prices, have increasingly compressed profit margins and face greater operating pressure and exit risks.
Therefore, although Bitcoin mining still has considerable economic returns from a macro perspective, there is a clear profit stratification phenomenon within the industry. If Bitcoin prices fluctuate downward in the future, or global energy costs rise further, the mining cost-current price ratio may exceed the critical point of 1.0, becoming an important leading signal that affects the adjustment of computing power, the reorganization of miners and the rhythm of market supply.
Bitcoin mining difficulty data
6. Bitcoin related news
Global corporate Bitcoin holdings dynamics (statistics for this week)
1. Cel AI (UK)
On June 28, British artificial intelligence company Cel AI planned to raise approximately US$10.3 million through additional issuance to purchase Bitcoin as part of its Bitcoin treasury strategy.
2. BlackRock
On June 29, it was reported that US asset management giant BlackRock increased its holdings of Bitcoin worth US$1.15 billion this week, bringing the total market value of its holdings to a record high of US$77.7 billion.
3. Bitcoin Treasury Corporation (Canada)
On June 28, Bitcoin Treasury Corporation, a Bitcoin financial company listed on the Toronto Stock Exchange Venture Exchange in Canada, once again increased its holdings by 478.57 BTC, bringing its total holdings to 771.37 BTC.
4. Al Abraaj (Bahrain)
On June 30, Al Abraaj Restaurants Group (stock code: ABRAAJ), a listed company on the Bahrain Stock Exchange, increased its holdings of 2 BTC, and its total holdings currently reach 7 BTC.
5. Metaplanet (Japan)
On June 30, Metaplanet, a company listed on the Tokyo Stock Exchange, purchased 1,005 new BTC, bringing its total holdings to 13,350. On the same day, the company became the world's fifth largest Bitcoin holding company, second only to Strategy, MARA, XXI and Riot.
6. Vaultz Capital (UK)
On June 30, British investment company Vaultz Capital increased its holdings of 40 BTC, and its total holdings now reach 50.
7. Strategy (formerly MicroStrategy, United States)
On June 30, Strategy, a US-listed enterprise intelligence software company, increased its holdings by 4,980 BTC between June 23 and 29, bringing its total holdings to 597,325 BTC.
8. The Smarter Web Company (UK)
On July 1, The Smarter Web Company, a technology company listed in London, UK, increased its holdings of 230.05 BTC, bringing its total holdings to 773.58 BTC.
9. Vanadi Coffee (Spain)
On July 1, Spanish coffee chain Vanadi Coffee increased its holdings of 10 BTC, bringing its total holdings to 64.
10. Monochrome (Australia)
On July 1, it was reported that the Australian crypto asset management company Monochrome's spot Bitcoin ETF (IBTC) held 931 BTC.
11. Figma (United States)
On July 2, Figma, a well-known American design software company, disclosed that it held a Bitcoin ETF worth nearly US$70 million and was approved to purchase an additional US$30 million in BTC.
12. Genius Group (United States)
On July 2, Genius Group (GNS), an artificial intelligence company listed on the New York Stock Exchange, increased its Bitcoin reserves to 120 on July 1, an increase of 20%. The company plans to expand its holdings to 1,000 BTC in the next six months.


