
加密市场情绪研究报告(2024.01.19–01.26):灰度史上最大幅减持BTC的一周,是遭遗弃还是易主?
The week with the largest reduction in holdings in Grayscale’s history
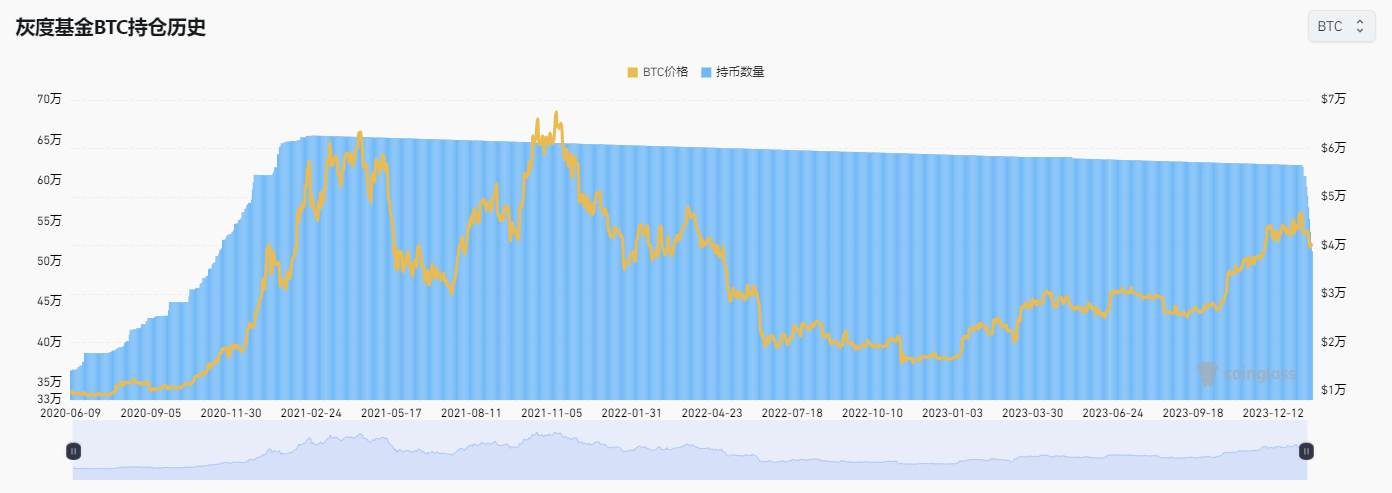
Grayscale 2020.6 to date number of positions
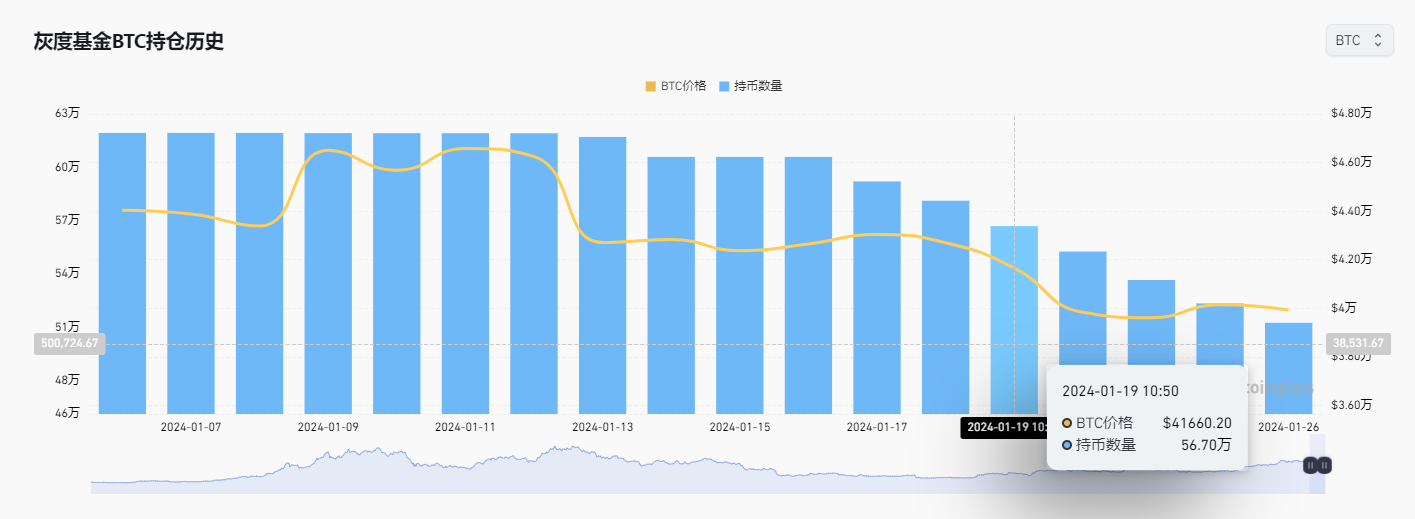
The number of positions held by Grayscale since 2024.1
Grayscale’s holdings dropped by 9.6% this week starting from 1.19, reducing its holdings by 54,400 BTC, becoming the largest reduction in holdings in history.
Is Bitcoin abandoned or changing hands?
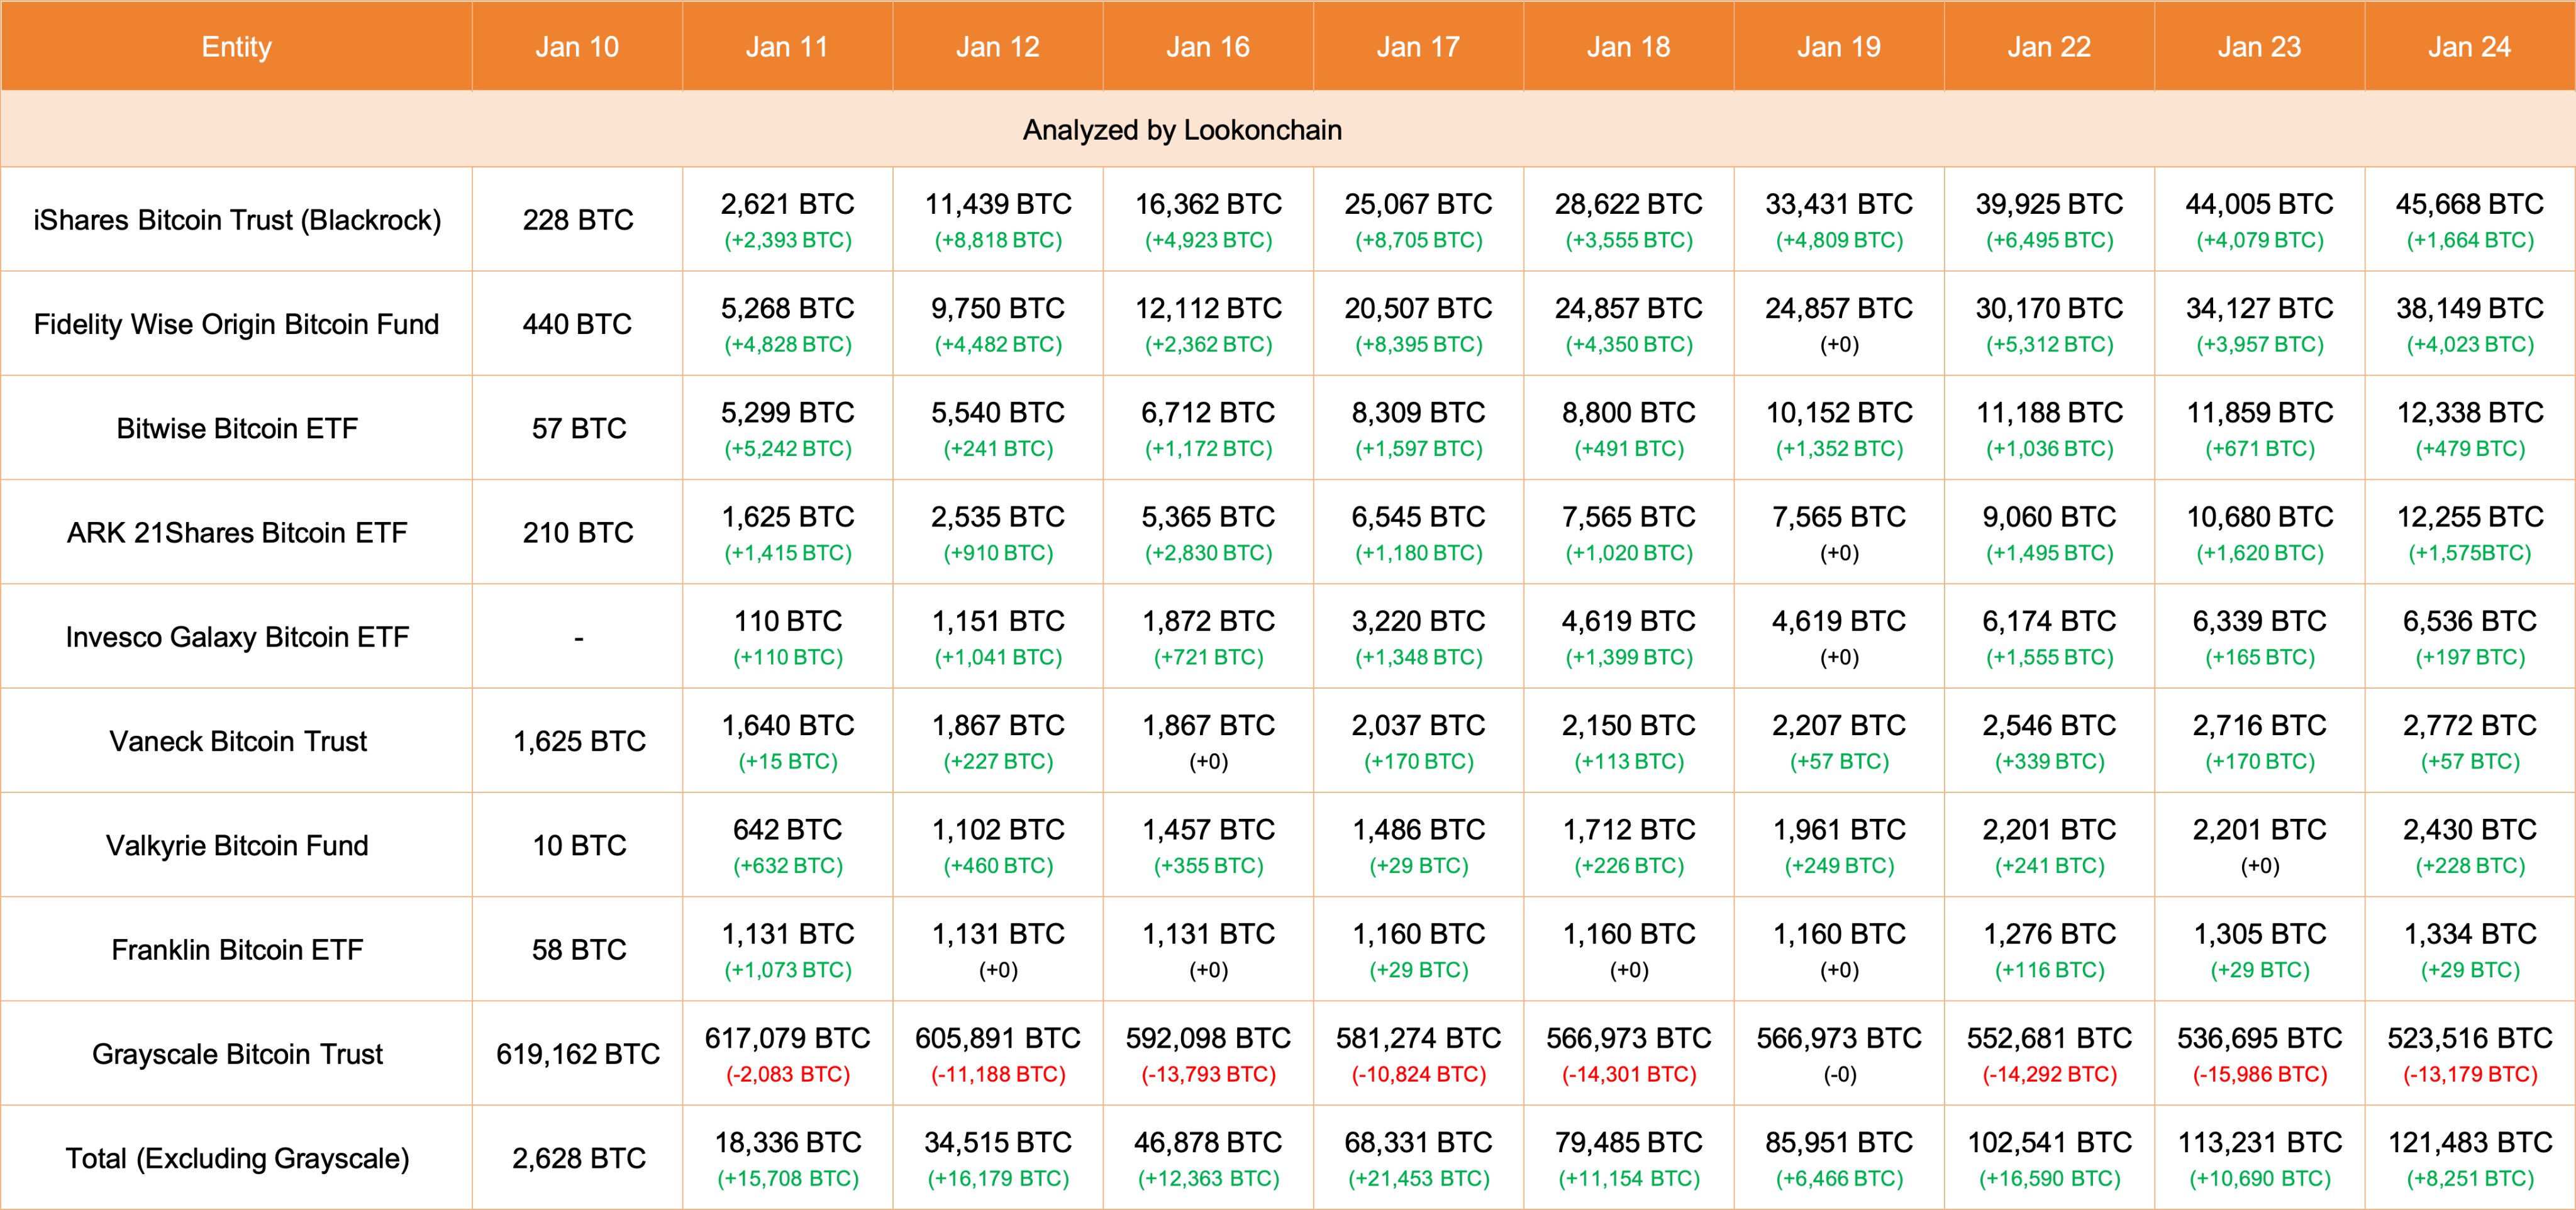
Changes in BTC holdings, data source:https://twitter.com/lookonchain/status/1750488209518391381
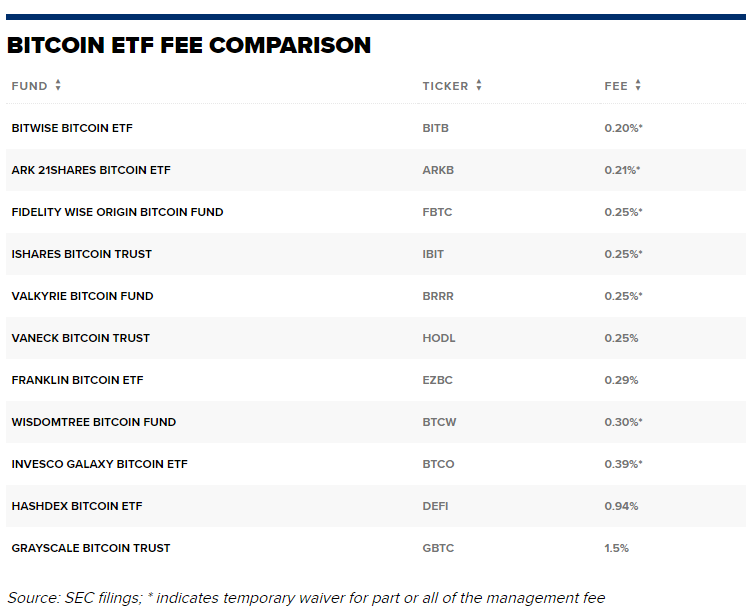
Bitcoin ETF Management Fee Data Comparison
With the passage of the Bitcoin ETF, there have been some changes in the market. According to data, since January 10, Grayscale Fund has reduced its overall holdings of 95,646 Bitcoins, while the other eight Bitcoin ETFs have increased their holdings by 118,855 Bitcoins, which means that overall institutional holdings have increased by 23,209 Bitcoins. Bitcoin. This shows that Bitcoin has not been abandoned, but that positions have changed hands.
As an early entrant into the cryptocurrency market, Grayscale Fund has been one of the major players in the Bitcoin space among institutional investors. However, due to the high management fees of Grayscale funds, some investors began to reduce their holdings of Bitcoin and seek more cost-effective investment options.
On the contrary, BlackRock and Fidelity funds were among the institutions that accumulated the most Bitcoin this week, relying on their low management fees and brand influence. Investors are more likely to choose ETF funds such as BlackRock and Fidelity funds as investment vehicles for Bitcoin. These well-known asset management companies enjoy a good reputation and brand influence. In addition, the Bitcoin investment products they offer may have lower management fees, which may be more attractive for larger institutional investors especially under long-term investment considerations.
Bitcoin halving is about 80 days away from today (2024.01.26)
Countdown to halving:https://www.nicehash.com/countdown/btc-halving-2024-05-10-12-00?_360safeparam=1289146171
Market technical and emotional environment analysis
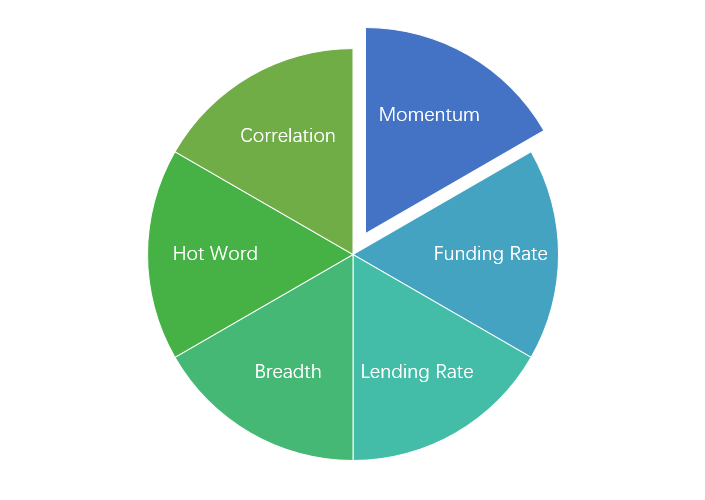
Sentiment analysis components
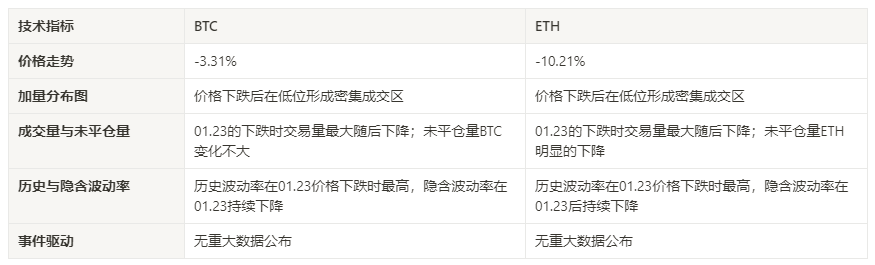
Technical indicators
Price trend
BTC price fell by -3.31% and ETH price fell by -10.21% in the past week.
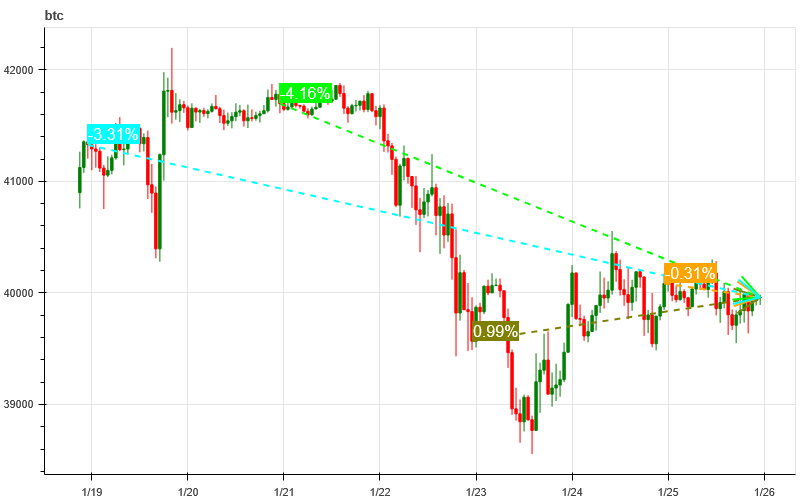
The picture above is the price chart of BTC over the past week
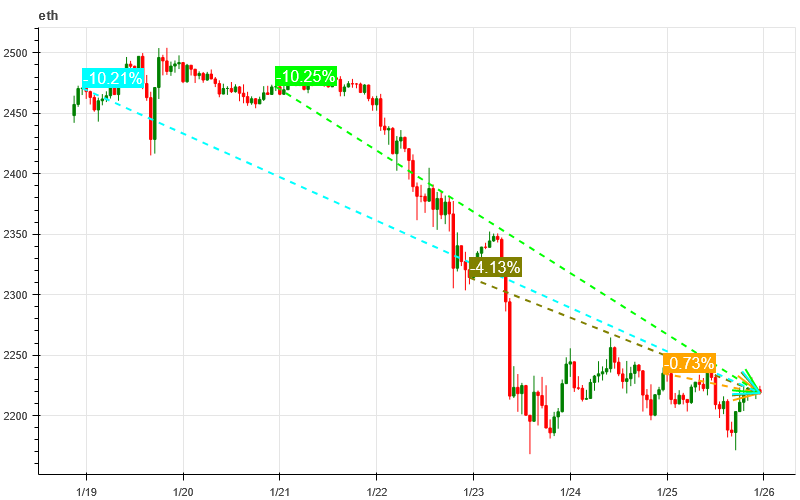
The picture above is the price chart of ETH over the past week
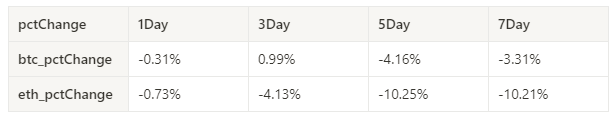
Table showing the rate of price change over the past week
Price and volume distribution chart (support and resistance)
After falling in price over the past week, BTC and ETH formed intensive trading areas at low levels.
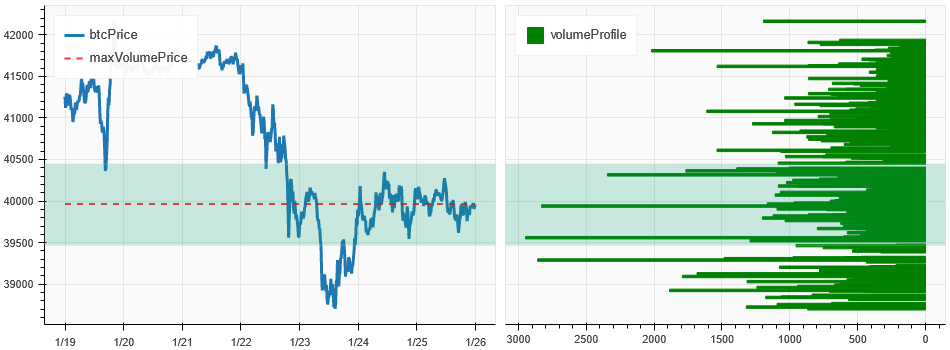
The picture above is the distribution map of BTC’s intensive trading areas in the past week.
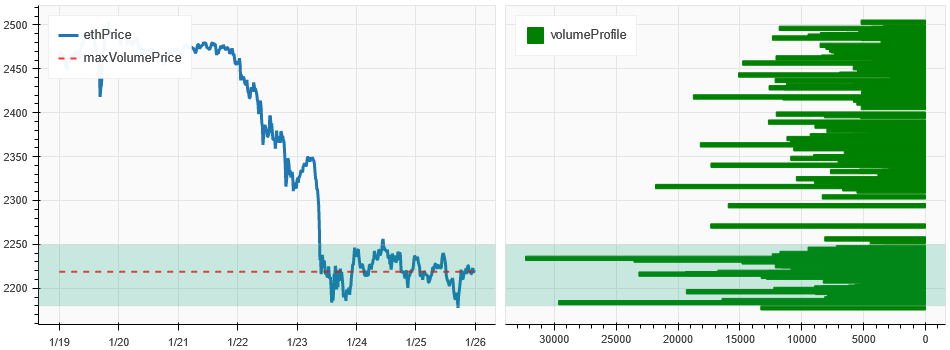
The picture above is the distribution map of ETH’s intensive trading areas in the past week.
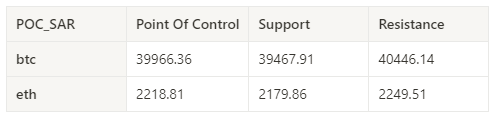
Table showing the intensive weekly trading ranges for BTC and ETH over the past week
Volume and Open Interest
In the past week, the trading volume of BTC and ETH was the largest when it fell to 01.23 and then declined; the open interest of BTC did not change much, while ETH dropped significantly.
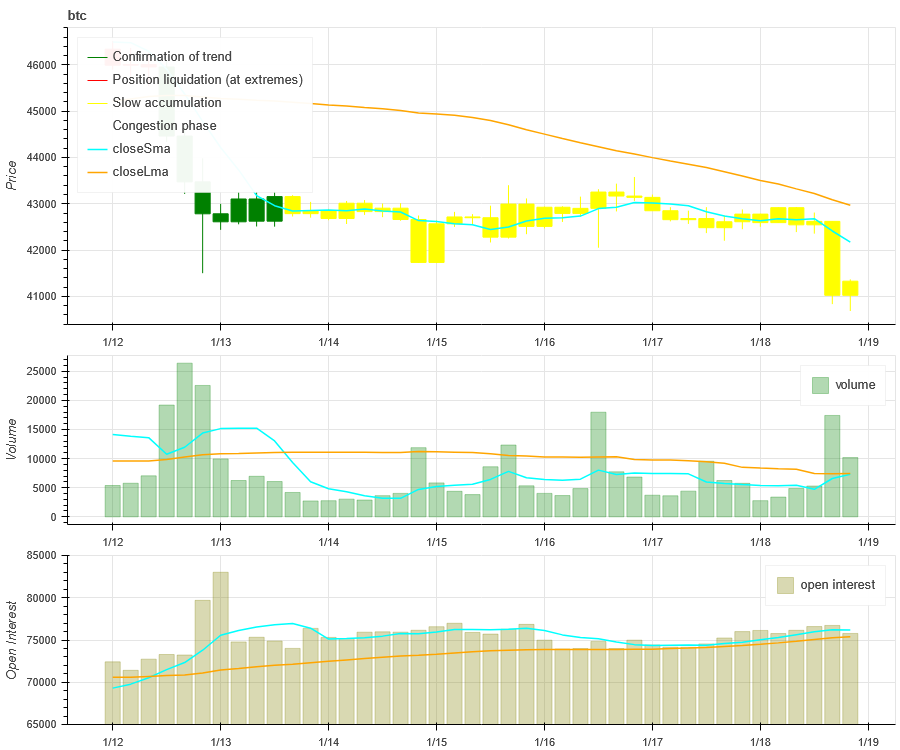
The price trend of BTC at the top of the picture above, the middle is the trading volume, the bottom is the open interest, the light blue is the 1-day average, and the orange is the 7-day average. The color of the K line represents the current status. Green means that the price rise is supported by trading volume, red means positions are being closed, yellow means positions are slowly accumulating, and black means congestion.
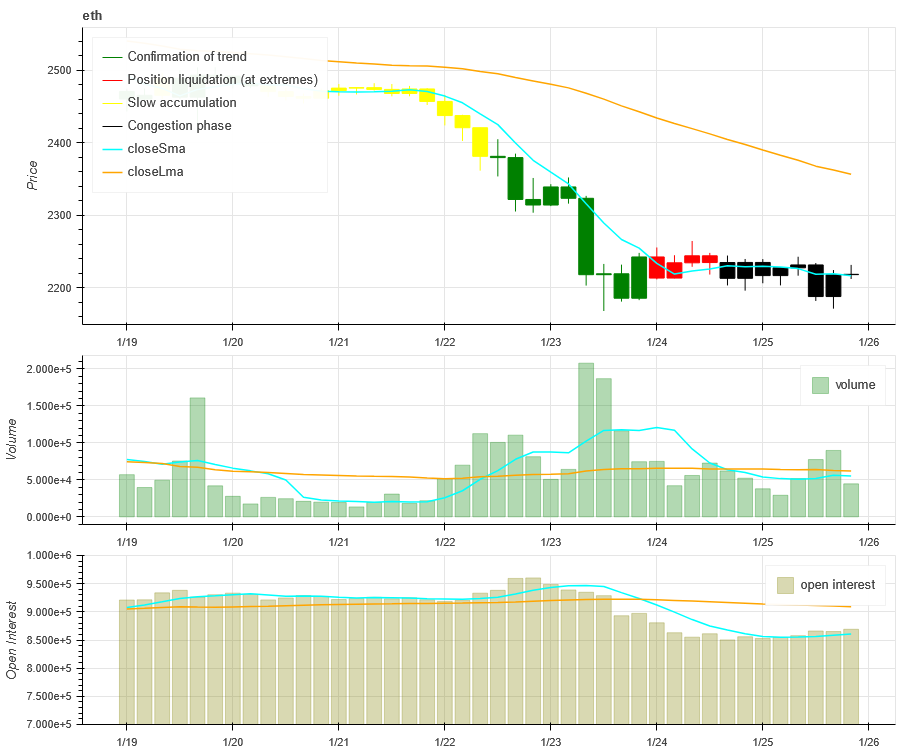
The price trend of ETH at the top of the picture above, the middle is the trading volume, the bottom is the open interest, the light blue is the 1-day average, and the orange is the 7-day average. The color of the K line represents the current status. Green means that the price rise is supported by trading volume, red means positions are being closed, yellow means positions are slowly accumulating, and black means congestion.
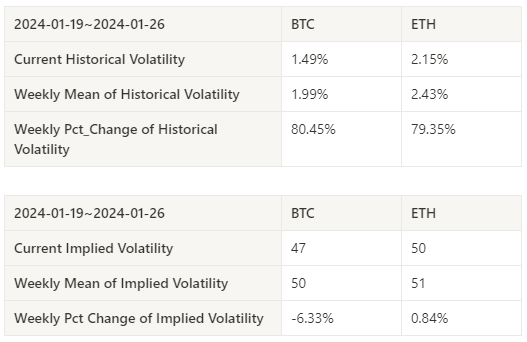
Historical Volatility vs. Implied Volatility
Historical volatility for BTC and ETH over the past week was highest at 01.23 when the price declined, and implied volatility continued to decline at 01.23.
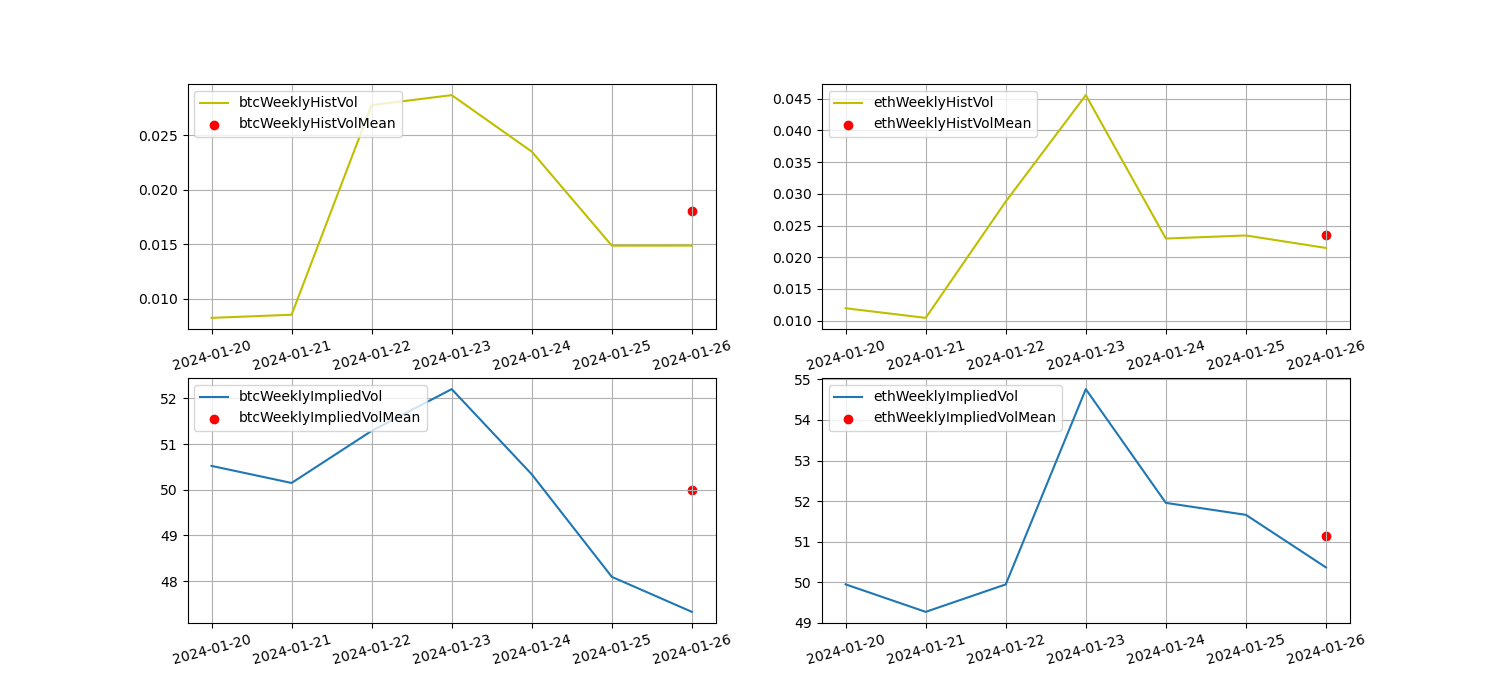
The yellow line is historical volatility, the blue line is implied volatility, and the red dot is its 7-day average
event driven
There are no major data releases this week.
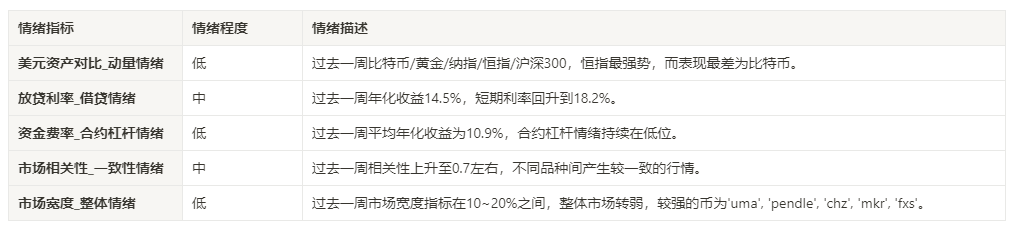
sentiment indicator
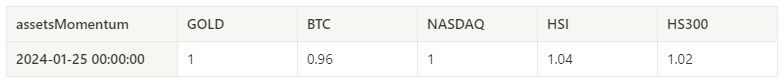
momentum sentiment
Among Bitcoin/Gold/Nasdaq/HSI/CSI 300, HSI was the strongest over the past week, while Bitcoin was the worst performer.
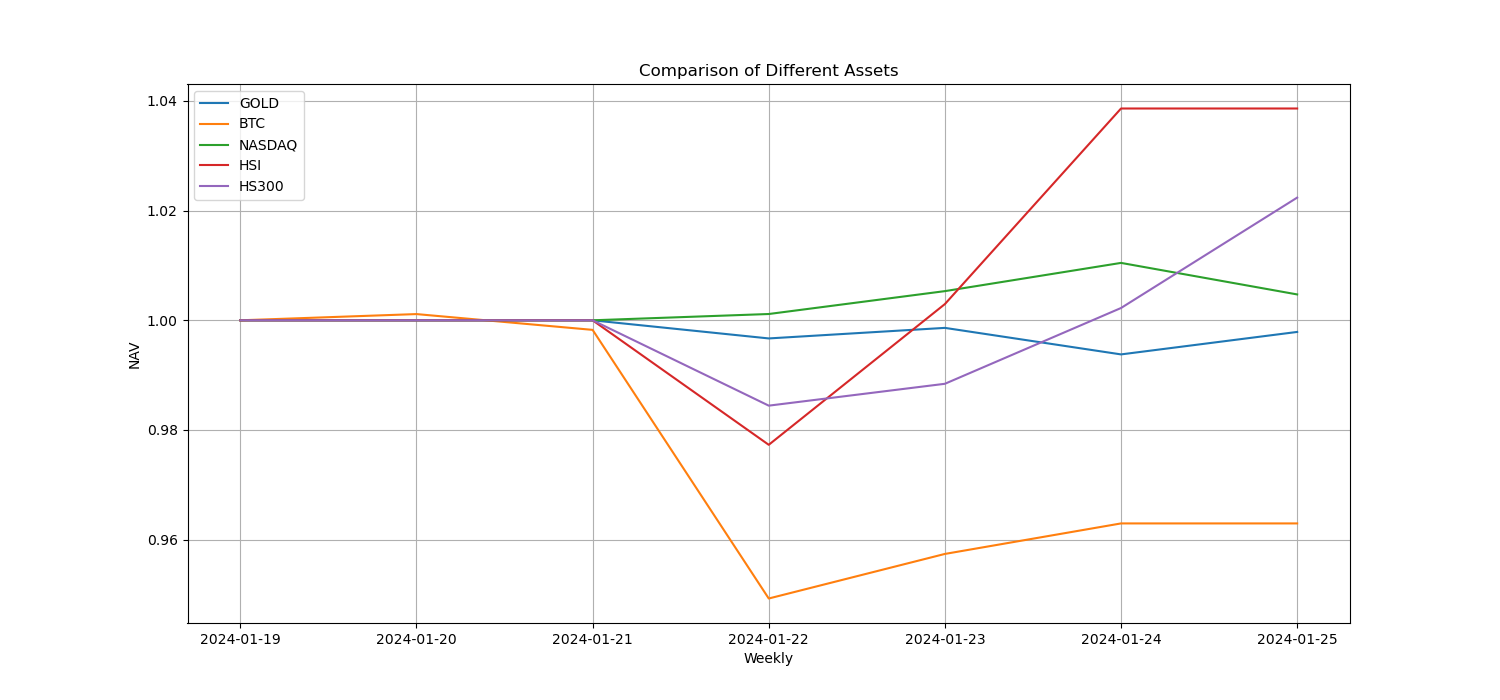
The picture above shows the trends of different assets over the past week.
Lending interest rate_Lending sentiment
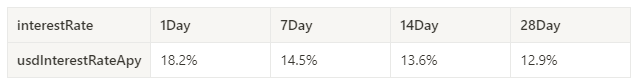
The annualized return on USD lending averaged 14.5% in the past week, and short-term interest rates rose back to 18.2%.
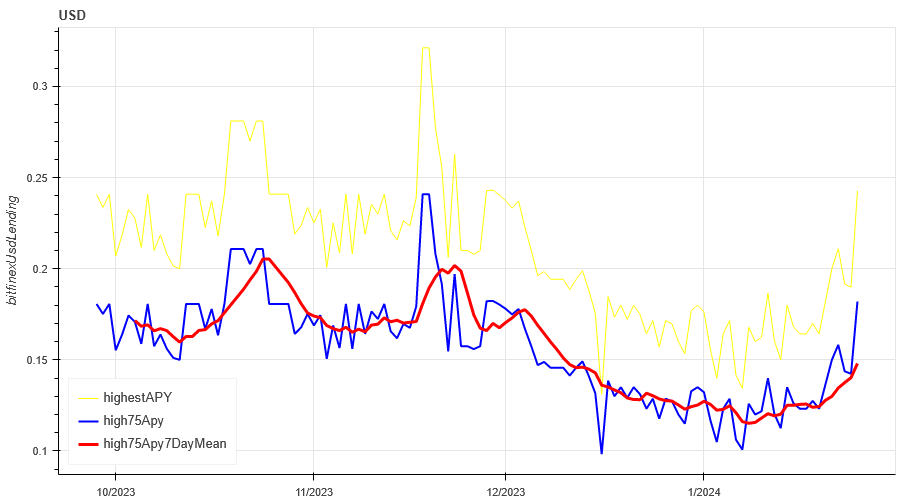
The yellow line is the highest price of the USD interest rate, the blue line is 75% of the highest price, and the red line is the 7-day average of 75% of the highest price
Funding Rate_Contract Leverage Sentiment
The average annualized return on BTC tariffs in the past week was 10.9%, and contract leverage sentiment continues to be low.
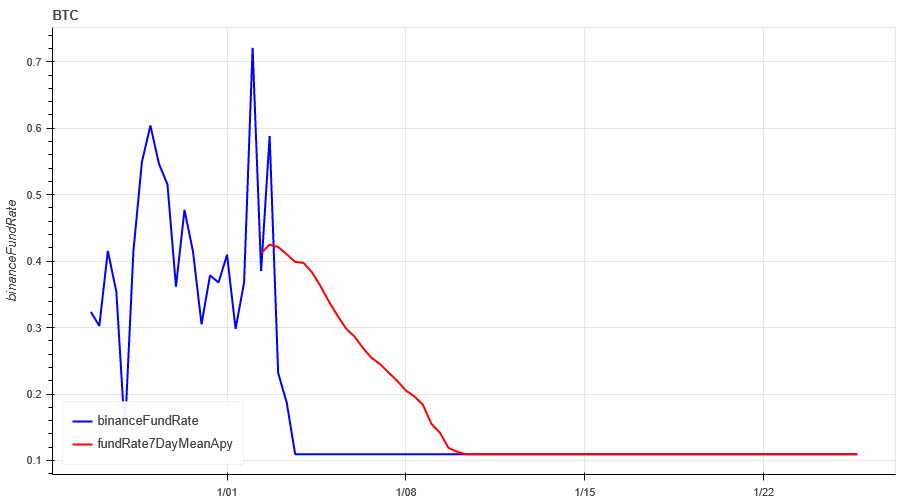
The blue line is the funding rate of BTC on Binance, and the red line is its 7-day average
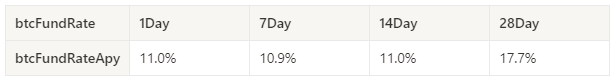
The table shows the average return of BTC fees for different holding days in the past
Market Correlation_Consistent Sentiment
The correlation among the 129 coins selected in the past week has increased to around 0.7, resulting in more consistent prices among different varieties.
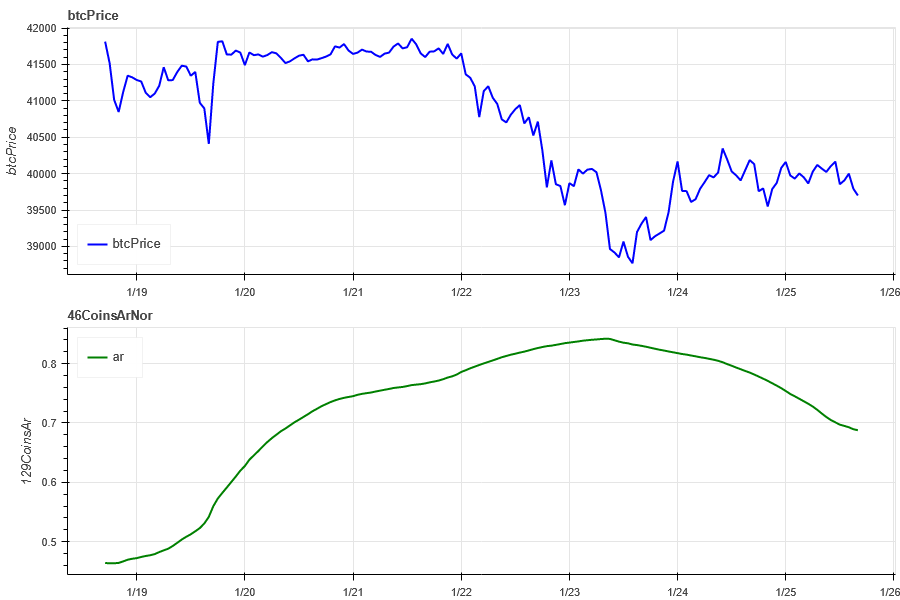
The blue line in the above picture first shows the Bitcoin price, and the green line is [ 1000 floki, 1000 lunc, 1000 pepe, 1000 shib, 100 0x ec, 1inch, aave, ada , agix, algo, ankr, ant, ape, apt, arb, ar, astr, atom, audio, avax, axs, bal, band, bat, bch, bigtime, blur, bnb, btc, celo, cfx, chz, ckb , comp, crv, cvx, cyber, dash, dgb, doge, dot, dydx, egld, enj, ens, eos,etc, eth, fet, fil, flow, ftm, fxs, gala, gmt, gmx, grt, hbar , hot, icp, icx, imx, inj, iost, iotx, jasmy, kava, klay, ksm, ldo, link, loom, lpt, lqty, lrc, ltc, luna 2 , magic, mana, matic, meme, mina, mkr, near, neo, ocean, one, ont, op, pendle, qnt, qtum, rndr, rose, rune , rvn, sand, sei, sfp, skl, snx, sol, ssv, stg, storj, stx, sui, sushi, sxp, theta, tia, trx, t, uma, uni, vet, waves, wld, woo, xem , xlm, xmr, xrp, xtz, yfi, zec, zen, zil, zrx] overall correlation
Market Breadth_Overall Sentiment
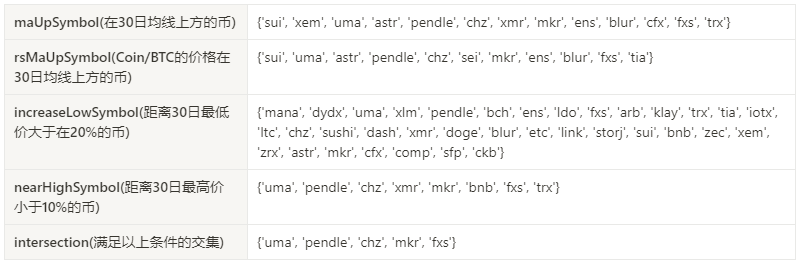
For the 129 coins selected in the past week, 10% have prices above the 30-day moving average. Compared to BTC, 20% have prices above the 30-day moving average. 10% have prices greater than 20% from the lowest price in the past 30 days. , the proportion that is less than 10% from the highest price in the past 30 days is 7%, the overall market is weakening, and the stronger coins are uma, pendle, chz, mkr, fxs.
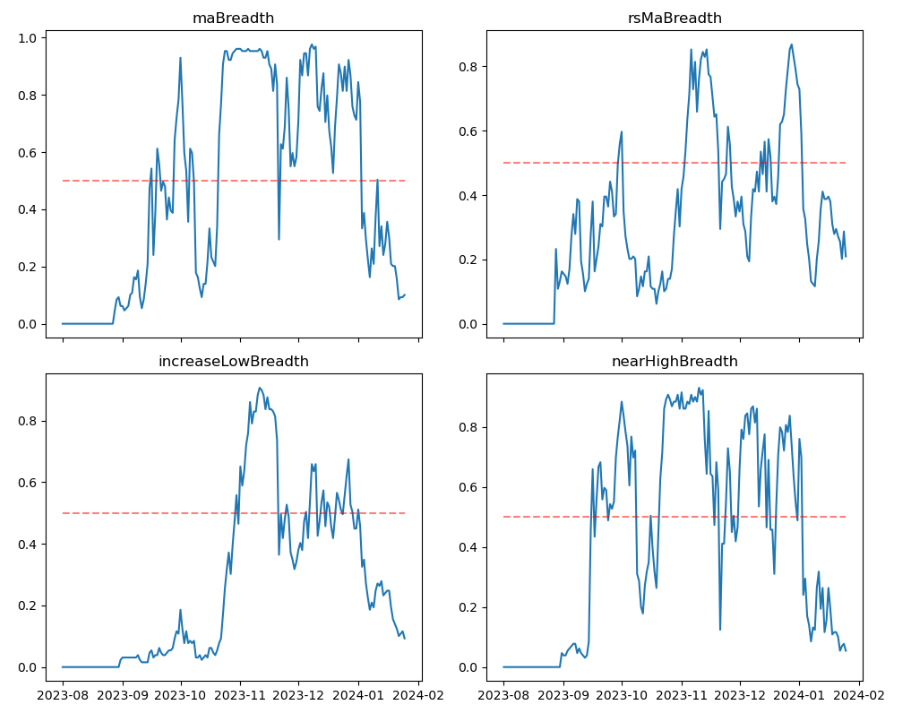
The picture above is [ 1000 floki, 1000 lunc, 1000 pepe, 1000 shib, 100 0x ec, 1inch, aave, ada, agix, algo, ankr, ant, ape, apt, arb, ar, astr, atom, audio, avax, axs, bal, band , bat, bch, bigtime, blur, bnb, btc, celo, cfx, chz, ckb, comp, crv, cvx, cyber, dash, dgb, doge, dot, dydx, egld, enj, ens, eos,etc, eth , fet, fil, flow, ftm, fxs, gala, gmt, gmx, grt, hbar, hot, icp, icx, imx, inj, iost, iotx, jasmy, kava, klay, ksm, ldo, link, loom, lpt , lqty, lrc, ltc, luna 2 , magic, mana, matic, meme, mina, mkr, near, neo , ocean, one, ont, op, pendle, qnt, qtum, rndr, rose, rune, rvn, sand, sei, sfp, skl, snx, sol, ssv, stg, storj, stx, sui, sushi, sxp, theta , tia, trx, t, uma, uni, vet, waves, wld, woo, xem, xlm, xmr, xrp, xtz, yfi, zec, zen, zil, zrx] The proportion of each width indicator on the 30th day
Summarize
This weeks market prices for BTC and ETH both continued to fall. The trading volume and implied volatility of both fell after rising on 1.23. The open interest of ETH dropped significantly. The market is still in a state of low volatility adjustment and decline; 129 The Binance breadth indicator shows that the overall trend this week continues to be weak, and most coins in the market have returned to a downward trend. The coins with stronger prices include uma, pendle, chz, mkr, and fxs; in terms of events, , there is no major data release this week.
Binance CopyTrading: CTA_ChannelCMT
Twitter: @DerivativesCN
Website: https://dcbot.ai/


