
LD Capital: Looking at BTC price changes from the Federal Reserve’s monetary policy cycle
Original author: Lisa, LD Capital

Almost all asset prices are affected by the monetary and fiscal policies of the Federal Reserve, and BTC is naturally no exception. Being in the crypto market requires you to always pay attention to various data on the U.S. economy, the attitude of Federal Reserve officials’ speeches, the direction of monetary policy, etc. With the passage of a BTC spot ETF, the impact of the USD tide on the crypto market will become increasingly apparent. This article will focus on the chart below to review the BTC price trend at different stages.
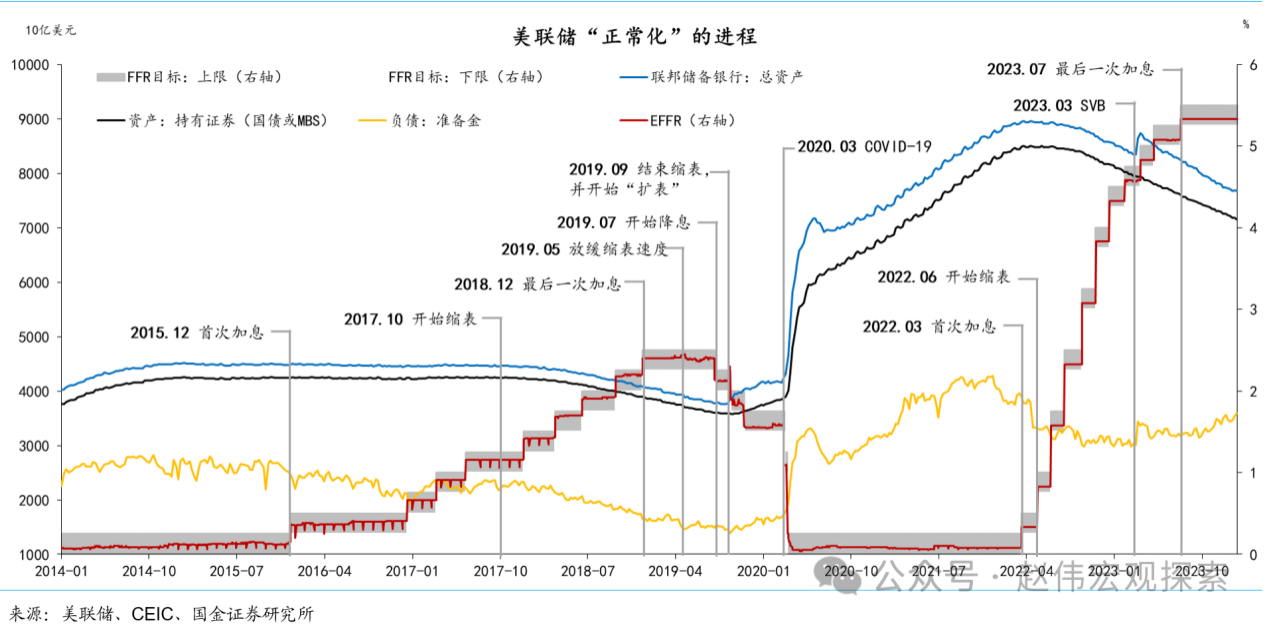
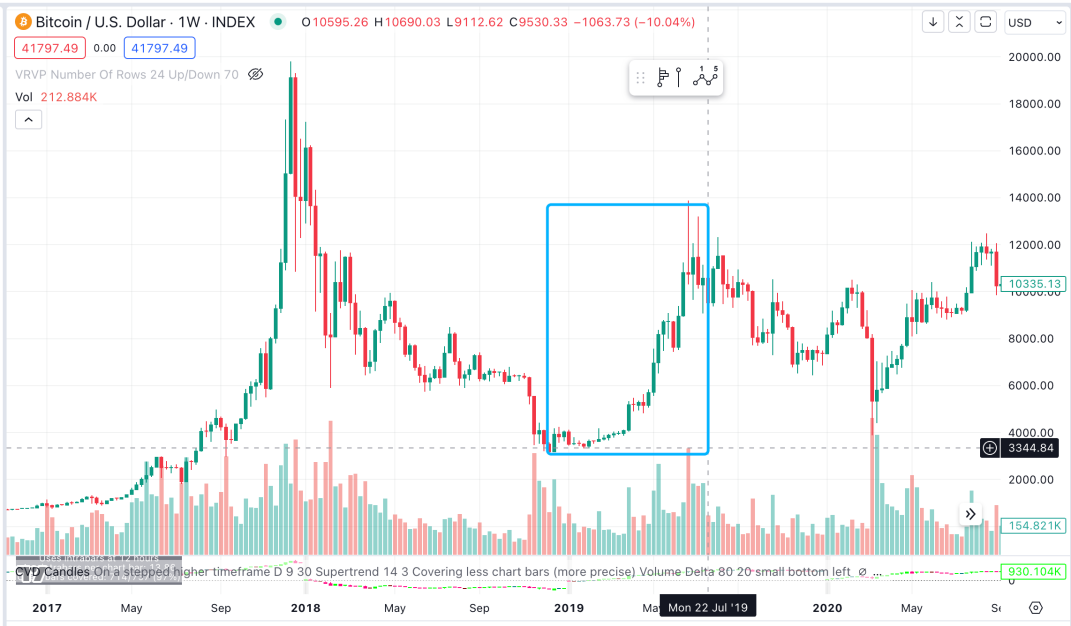
The Fed raises interest rates for the last time before starting to cut interest rates
Time: 2018/12 to 2019/7
BTC price performance: first went sideways and then rose, from about 3,500 to $12,000
The main rise begins in 2019/4 (similar to the 2019/5 period when the balance sheet shrinkage slows down). It can be considered that the market is trading on interest rate cut expectations 3 months in advance.
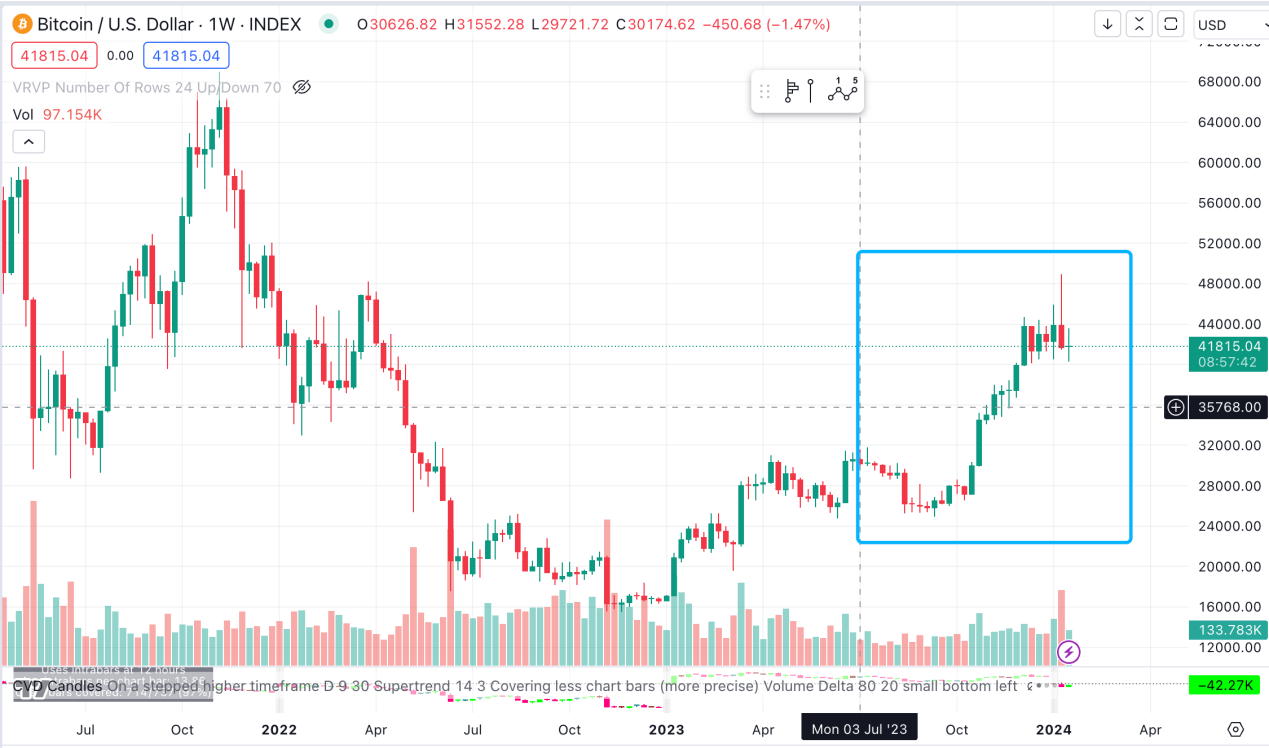
This historical period corresponds to the current market stage. It has been about 6 months since the last time the Federal Reserve raised interest rates (2023/7). Similar to the past, the BTC price also fell in October 2023 (after the interest rate hike stopped). 3 months) ushered in a major uptrend. In the past six months, the price of BTC has been greatly affected by ETF expectations, but it still coincides with the rules of the past cycle in terms of time and shape.
The Fed begins to cut interest rates until before the epidemic disruption
Time: 2019/7 to 2020/3
BTC price performance: first fell and then rose
After the interest rate cut began, the price fell, from about 10,000 to 7,000 in December, a drop of 30% (the end of the balance sheet reduction in 2019/9 did not have a significant positive impact during this period), and rebounded to 10,000 from December 2019 to February 2020.
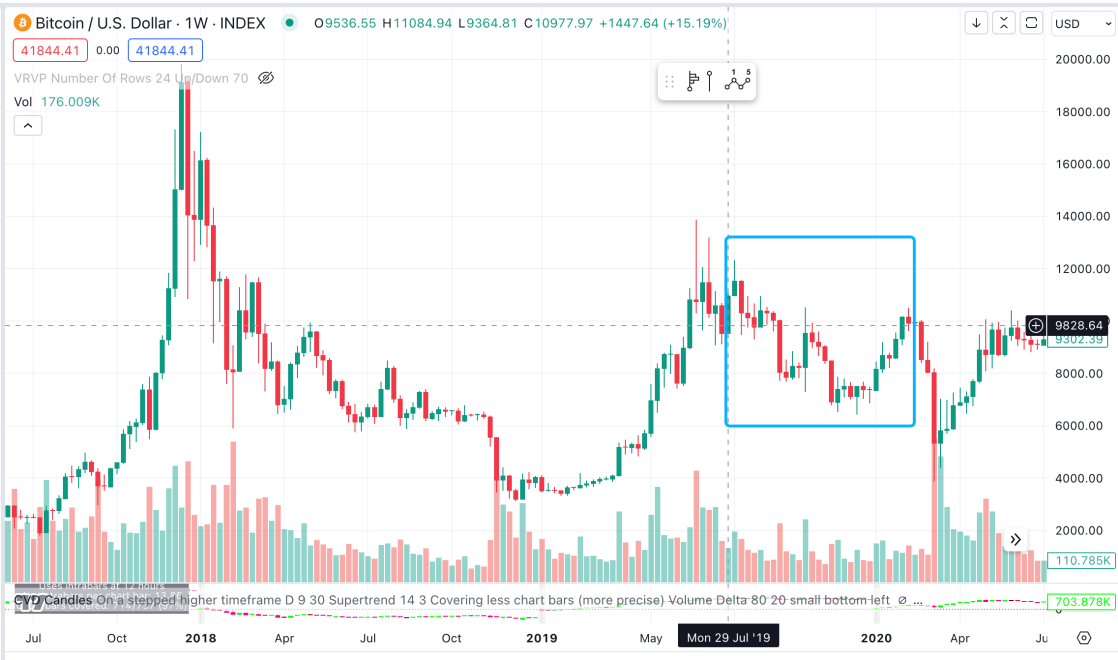
This stage is the stage that the market will enter in 24 years. In history, after the implementation of an interest rate cut and the end of balance sheet reduction, the overall performance of BTC fell first and then rose.
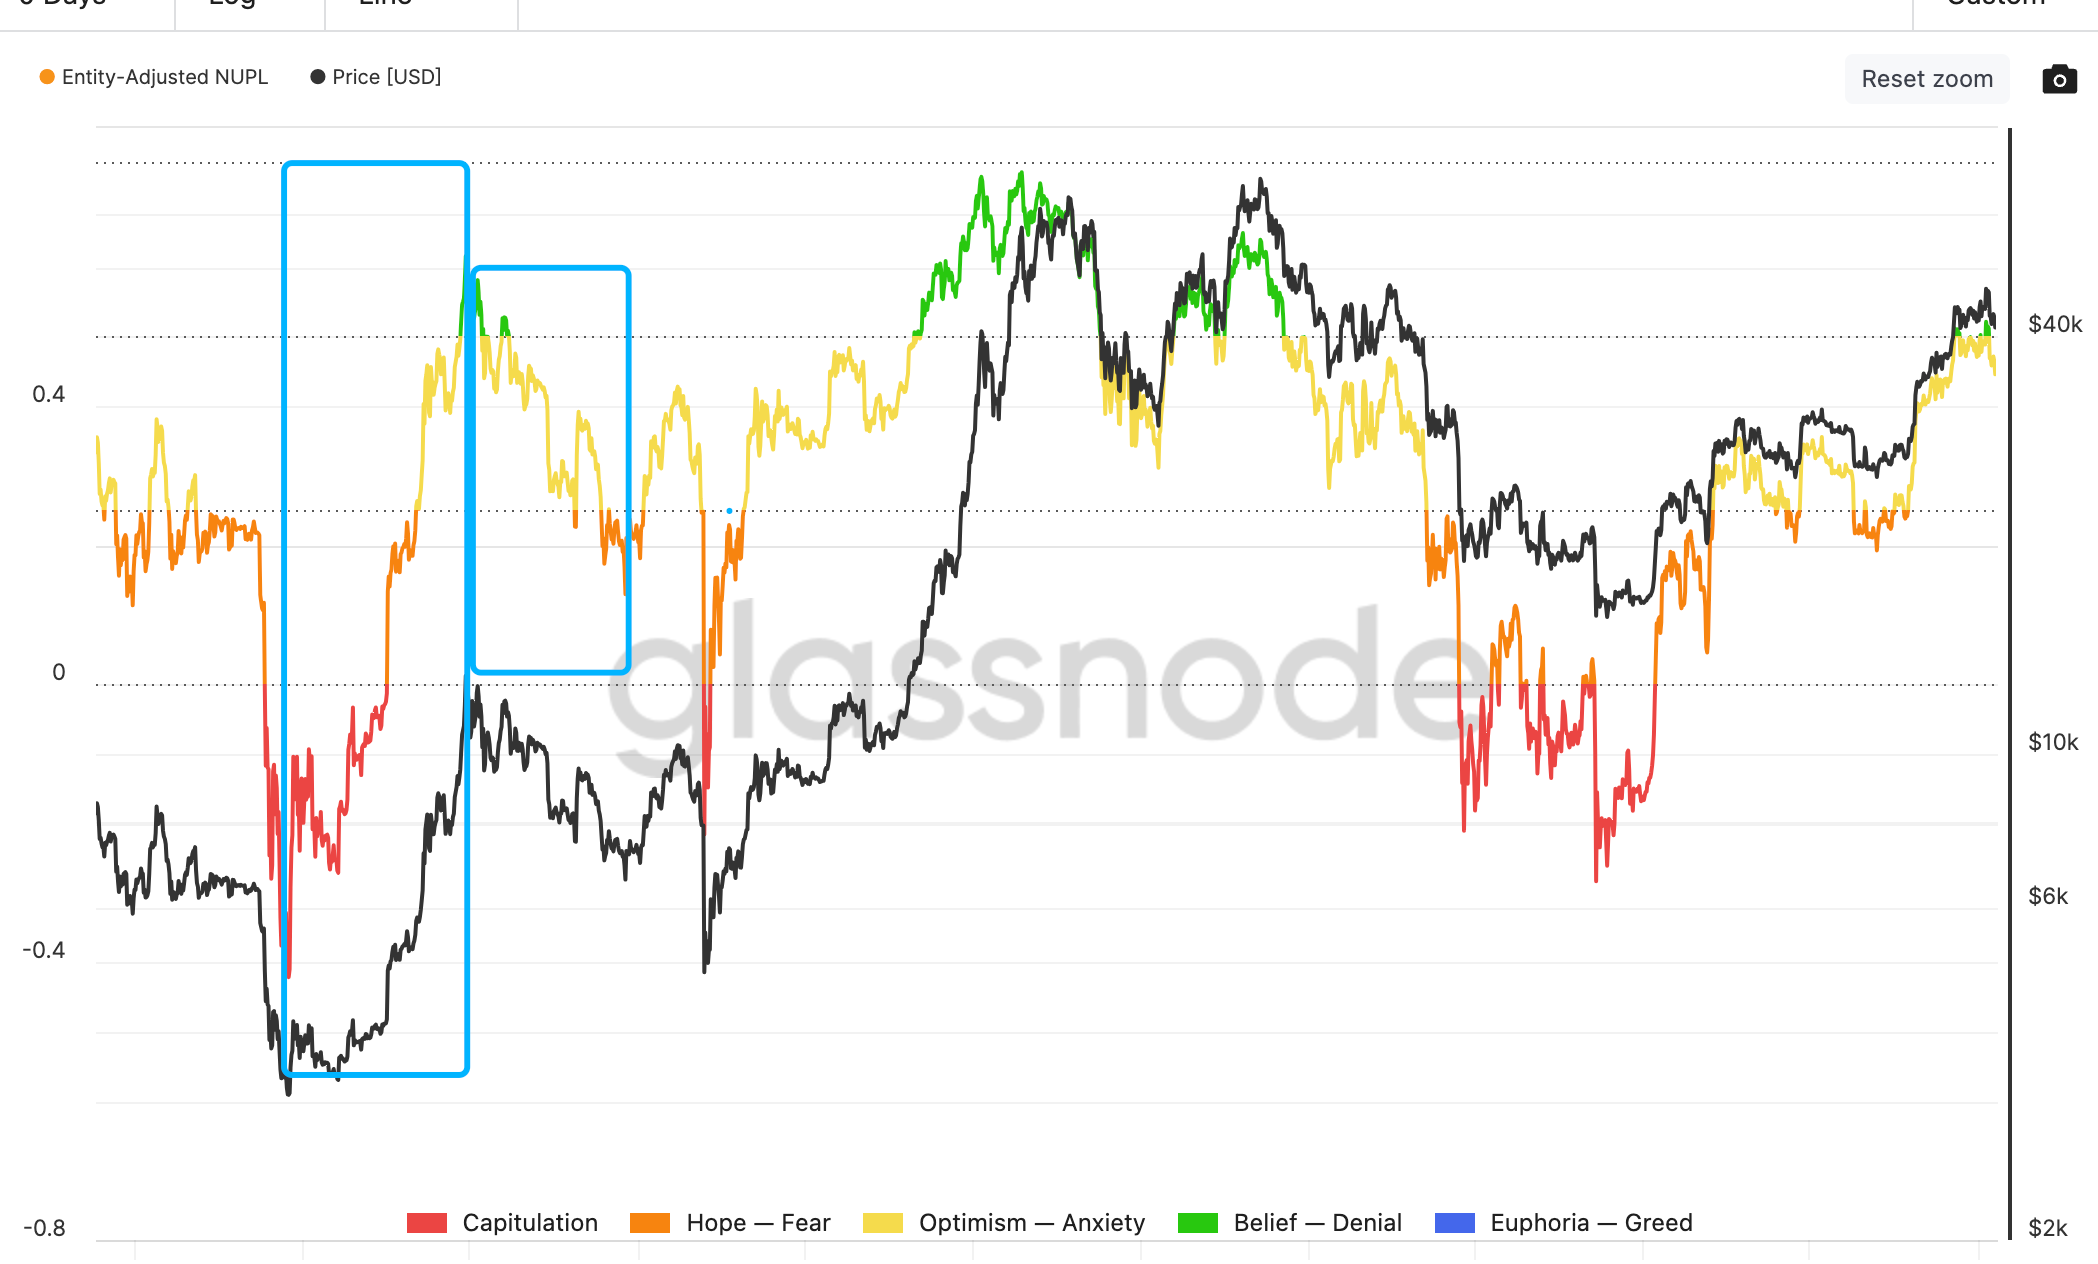
The combination of the above two stages and the angle of NUPL can well determine the high and low position of the stage.
Relaxation stage under the influence of the epidemic
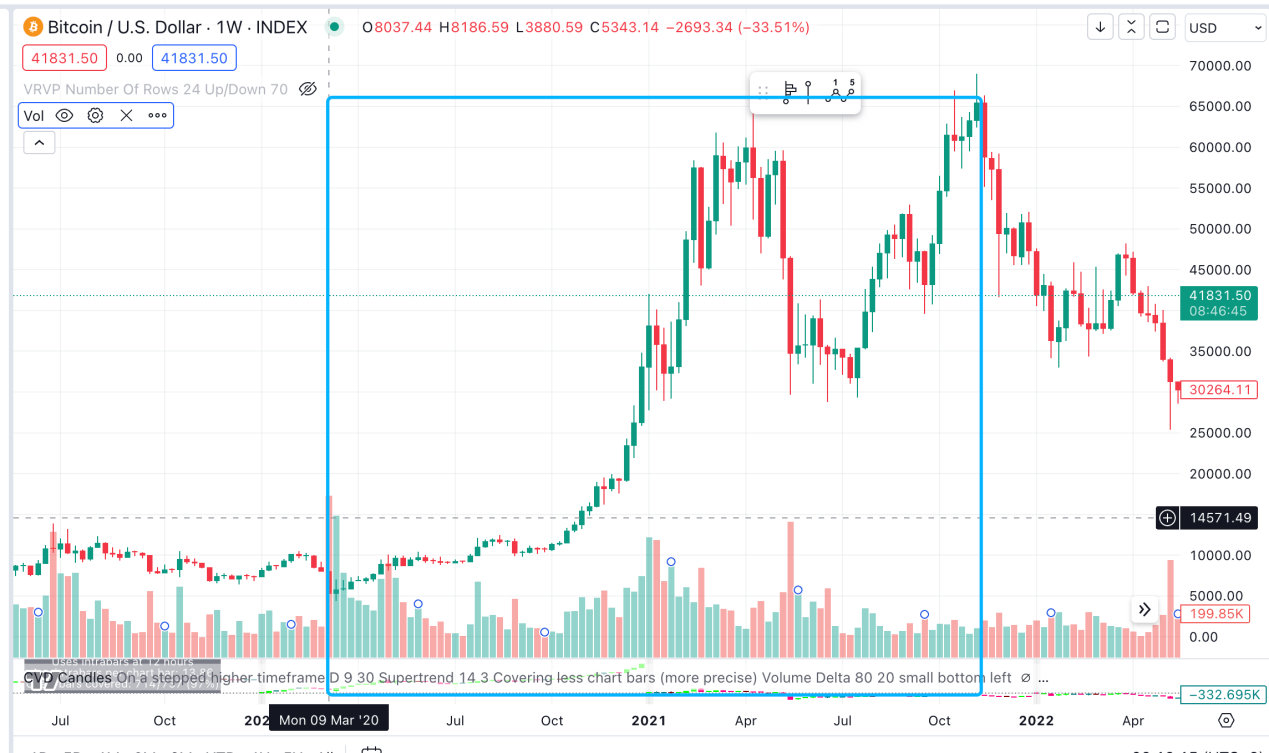
Later in March 2020, affected by the covid epidemic, the Federal Reserve quickly cut interest rates and launched large-scale QE, coupled with the 2020/5 halving. After a brief decline, the market ushered in a main rise, and BTC rose roughly from 5,000 to 65,000.
The peak of the BTC market occurred in 2021/11, 4 months before the end of easing (the first interest rate hike in 2022/3). It can be considered that the market traded interest rate hike expectations 4 months in advance, which is close to the time difference of the previous advance trading of interest rate cuts.
In the absence of a black swan event, it may be difficult for this bull market to reproduce such radical monetary policies and rising rates or magnitudes, but the direction remains the same.
Tightening resumes, Fed begins raising rates for last time
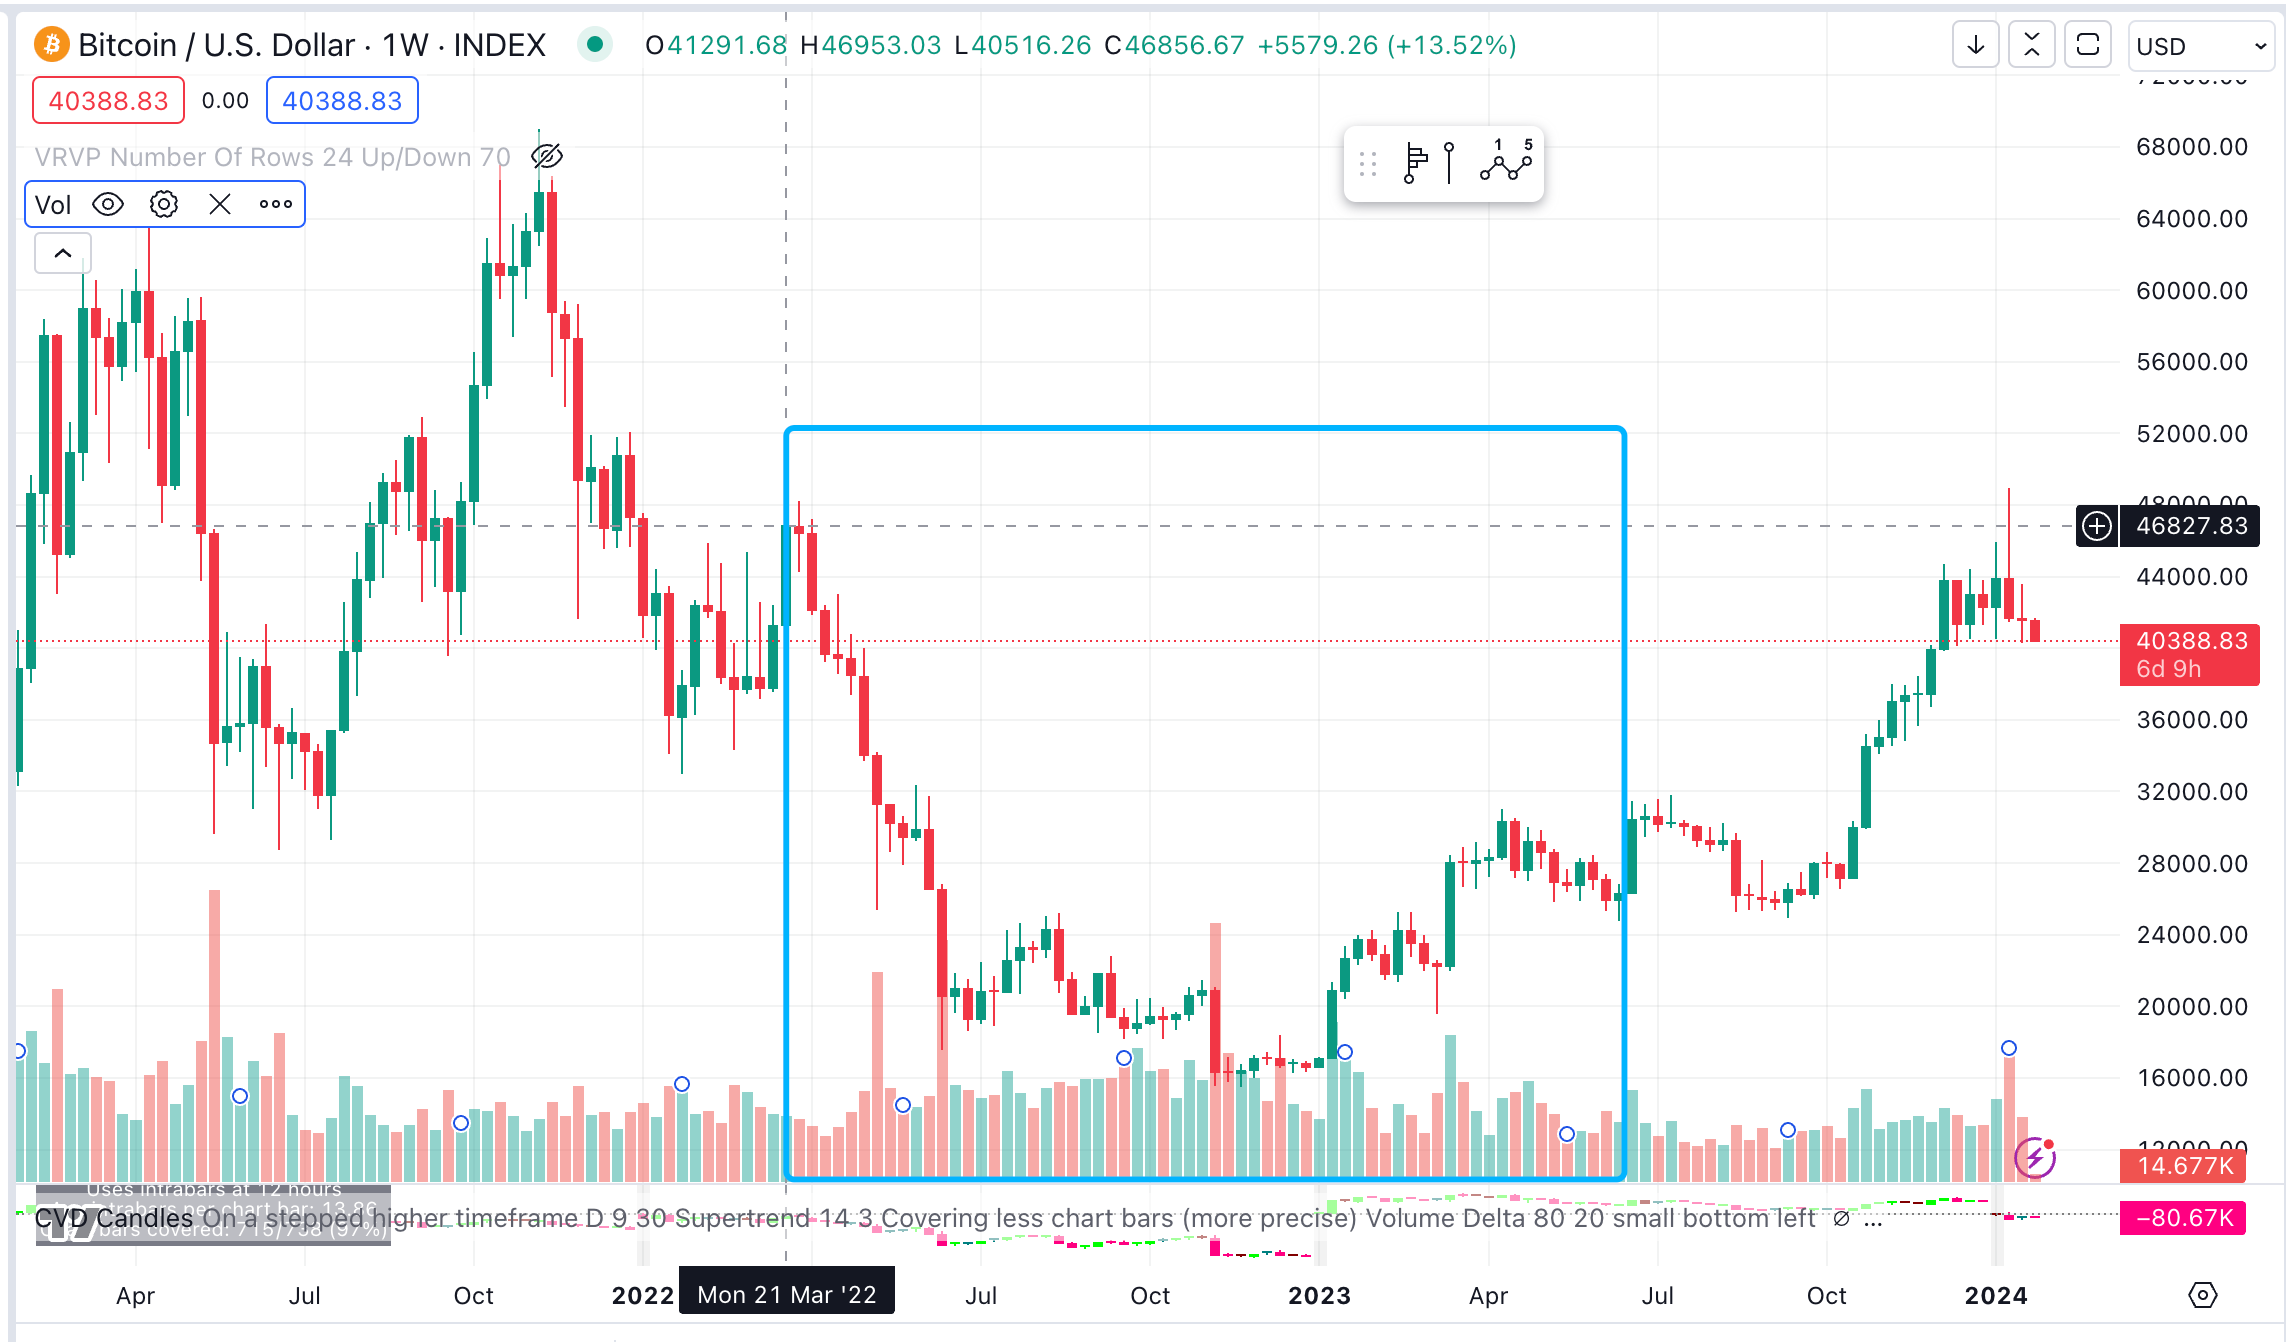
Time: Start raising interest rates in 2022/3 to the last rate hike in 2023/7; Start shrinking balance sheet to the present in 2022/6
BTC price performance: dropped from about 46,000 to as low as 16,000, fell for about 9 months and then began to rebound in early 2023
The simultaneous rise of BTC and the Nasdaq index starting in early 2023 may be related to the markets expectation that U.S. bond interest rates will peak in stages and the Feds interest rate hikes will slow down.
Overall, it seems that interest rate cuts will have a greater impact on the BTC market than balance sheet shrinkage. So when will the interest rate cuts start this year?
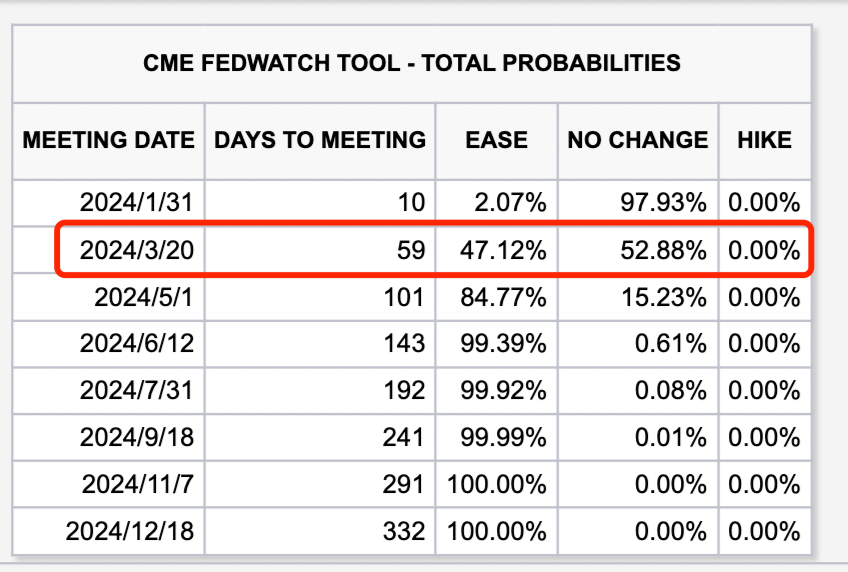
Federal Reserve Chairman Jerome Powell issued a dovish signal after the December FOMC meeting, leading to heightened expectations for a rate cut by the Federal Reserve. The latest data in the United States is relatively strong. The U.S. CPI increased by 3.4% year-on-year in December (previous value: 3.1%), and the core CPI increased by 3.9% year-on-year (previous value: 4.0%), both higher than expected. At the same time, the labor market is still tight, and the current market forecast The probability of no interest rate cut in March is 52.88%.
As for the expected interest rate cut in 2024, it will be either in March or May. If we wait and see, the market may have a correction by then. Of course, spot ETFs are a major disturbance to the market. The implementation of favorable conditions and the selling pressure of GBTC are the dominant factors affecting the price of BTC in the near future. At the same time, the BTC halving time is also much earlier than the previous cycle (the previous halving occurred 10 months after the interest rate cut began). This halving is sandwiched between the two starting points for interest rate cuts expected by the market. Although the rise after the halving benefit usually lags behind the actual date of its occurrence, the timing can still partially smooth out the possible decline after the interest rate cut.


