
Crypto Market Sentiment Research Report (2024.01.12–01.19): Challenges brought to trading by institutions’ gradual entry into the market
Challenges brought to trading by institutions gradually entering the market
The return of long volatility strategies declines year by year (Performance Decay)
Partial strategy failure caused by rapidly changing environment (Regime Shift)
Developing unique and sustainable strategies becomes more difficult (Is there a Holy Grail trading strategy?)
Challenges brought to trading by institutions gradually entering the market (2024)
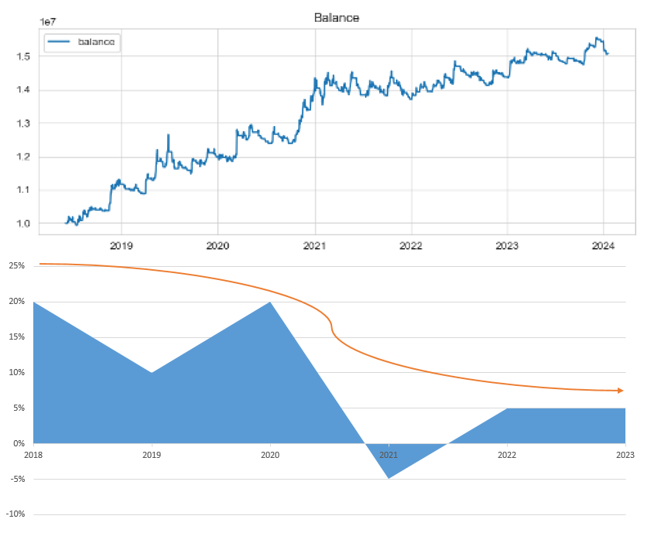
Turtle High and Low Price Breakout Strategy Performance and Annualized Returns
Performance decline of long volatility strategies:In a sustained low-volatility environment, long-volatility strategies face the challenge of declining returns year by year. These strategies rely on increases in market volatility to profit, but opportunities are limited in low-volatility markets, causing the strategies to underperform. Taking the turtle breakout strategy as an example, the picture above shows a simple long position when the price breaks through the highest price of 13 days in the past period, and a long position when the lowest price breaks through the lowest price of 3 days in the past period. Otherwise, it is a short position. The annualized returns from 2018 to 2023 were 20%, 10%, 20%, -5%, 5%, and 5% respectively. In the past three years, there has been an obvious decline in returns.
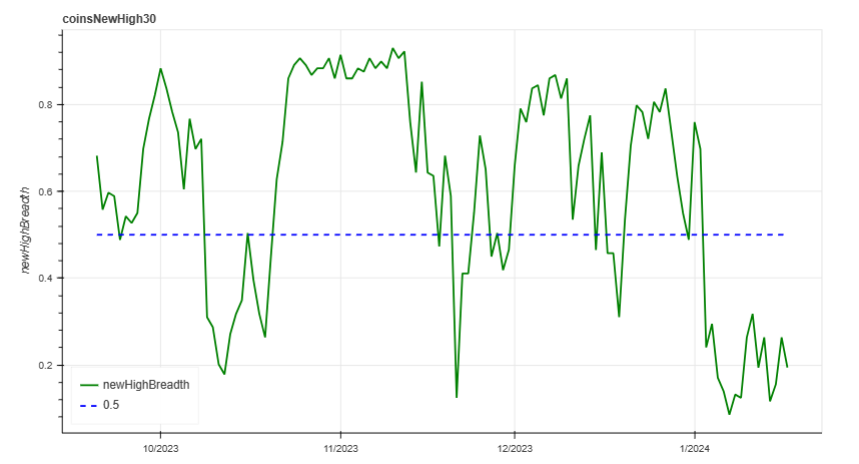
129 coins hit new 30-day highs
2. The rapidly changing environment has caused some strategies to fail:The rapidly changing market environment requires strategies to be highly adaptable and responsive. Factors such as emergencies, major news releases or swings in market sentiment can cause a strategy to expire or perform poorly in a short period of time. The increase in market noise and randomness also increases the instability of strategy signals. Taking the small coin hotspot strategy as an example, the chart above shows the proportion of 129 coins hitting 30-day highs. It performed well from the market launch in mid-October 2023 to the end of December. However, starting in January 2024, as the Bitcoin ETF passed , the overall market turned sharply downward, and the hot small currency strategy failed in the short term.

Market game competition is fierce
3. Developing unique and sustainable strategies becomes more difficult: The participation of institutional investors increases the intensity of market competition. Institutions have more resources, technology and expertise and are able to take advantage of advanced trading algorithms and high-speed execution. This makes it more difficult to find unique and sustainable strategies. In addition, institutional participation also causes market prices to respond more quickly and efficiently, and trading opportunities become more transient and limited.
2024 Environmental Response Plan

Establish and maintain diversified portfolio investments in multiple currencies and strategies, and observe declining strategies, and update, iterate and replace them in a timely manner to build a portfolio with a higher fault tolerance rate. Such a portfolio can spread risk, provide more investment opportunities, and maintain flexibility and adaptability by monitoring and adjusting strategies.
Mining new external data and innovating and iterating strategies. Take advantage of technological advances and widely available data resources to find new market information, trading opportunities and trends. At the same time, we constantly explore new trading strategies and improve existing strategies to improve the effectiveness and adaptability of trading.
More strictly select currencies for trading in the entire market, paying special attention to targets with small market capitalization.. By comprehensively evaluating factors such as sentiment hotspots, technical indicators, and market liquidity of potential trading targets, we select trading targets that are in line with our strategies and risk preferences. Pay special attention to small-cap stocks as they typically have greater volatility and trading opportunities, but also come with higher risks.
Through the comprehensive application of the above solutions, the focus is on maintaining an investment portfolio with high fault tolerance, adaptability and innovation. This requires constantly updating and optimizing strategies, mining new external data, rigorously screening transaction targets, and continuously observing and adjusting recession strategies in the portfolio. At the same time, risks need to be carefully managed to ensure appropriate risk control and implementation of fund management strategies.
2024 Crypto Market Sentiment Research Report Upgrade
In order to better understand the changes in the market sentiment environment and discover relatively strong currencies, both the weekly report and the small currency strategy have added the strength and weakness index relative to BTC to filter out relatively strong and low-correlated currency names.
The Bitcoin halving is about 95 days away from today (2024.01.19)
Countdown to halving:https://www.nicehash.com/countdown/btc-halving-2024-05-10-12-00?_360safeparam=1289146171
Market technical and emotional environment analysis
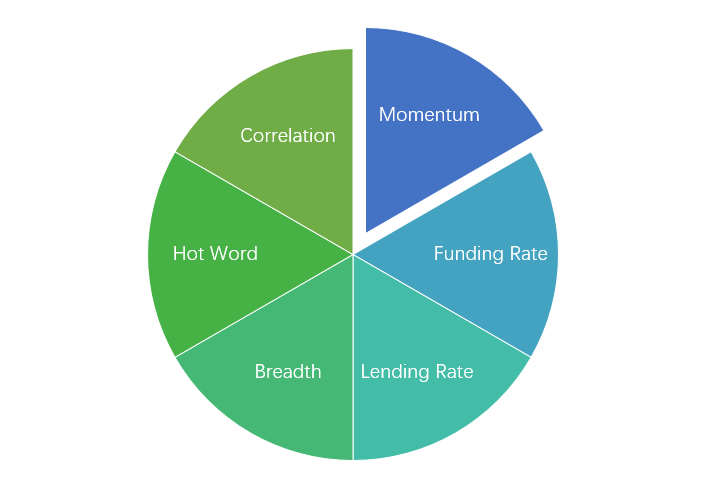
Sentiment analysis components
Technical indicators
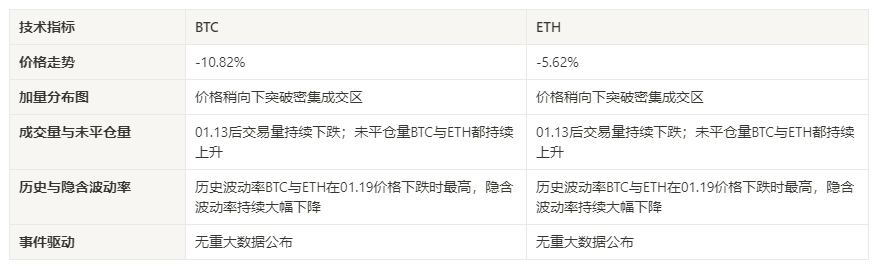
Price trend
BTC price increased by -10.82% and ETH price increased by -5.62% in the past week.
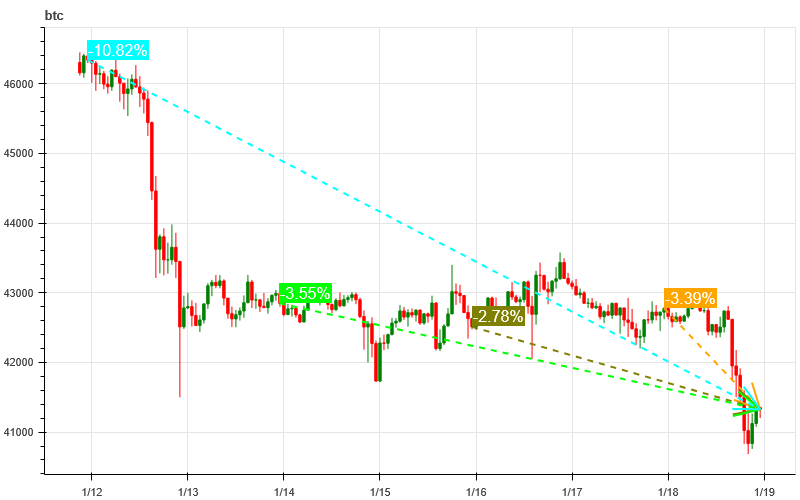
The picture above is the price chart of BTC over the past week
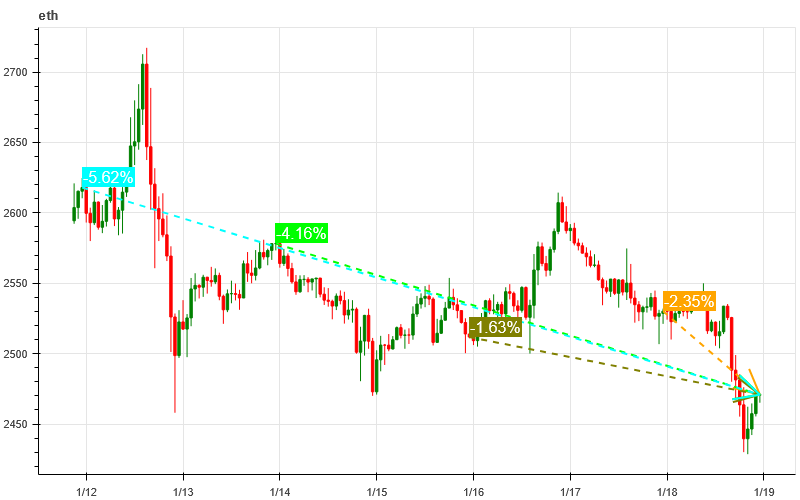
The picture above is the price chart of ETH over the past week
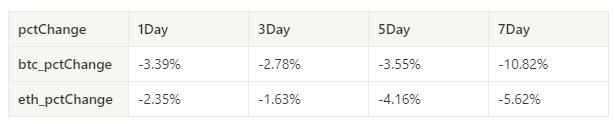
Table showing the rate of price change over the past week
Price and volume distribution chart (support and resistance)
In the past week, both BTC and ETH prices have slightly broken through the intensive trading zone downwards.
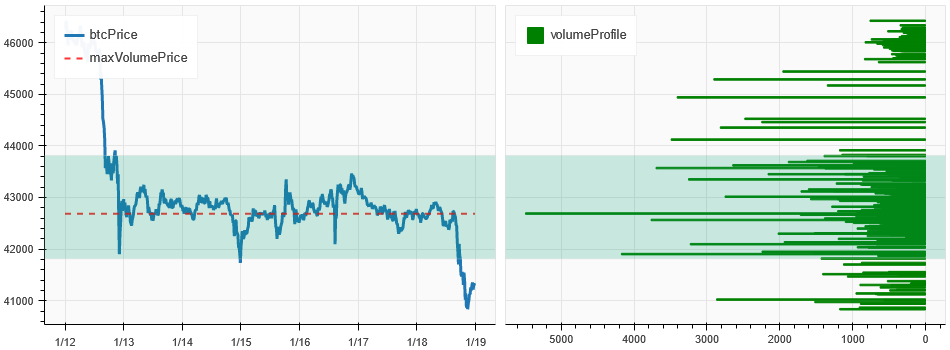
The picture above is the distribution map of BTC’s intensive trading areas in the past week.
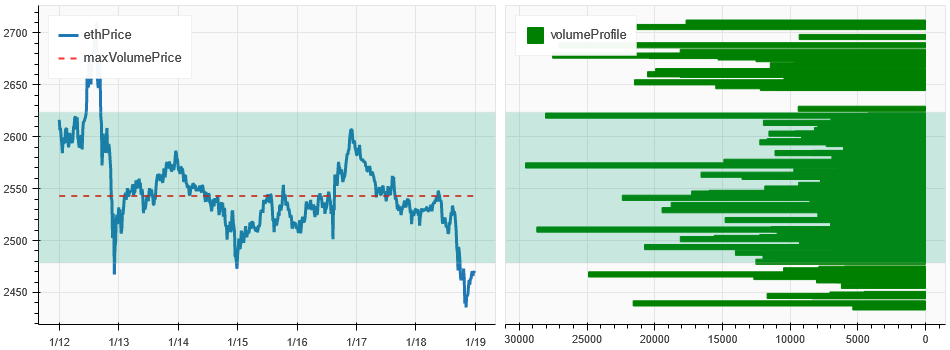
The picture above is the distribution map of ETH’s intensive trading areas in the past week.
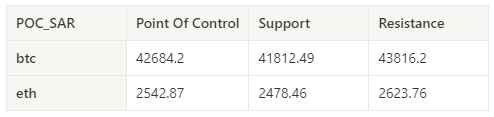
Table showing the intensive weekly trading ranges for BTC and ETH over the past week
Volume and Open Interest
In the past week, the trading volume of BTC and ETH continued to fall after 01.13; the open interest of BTC and ETH both continued to rise, and they were slowly accumulating positions.
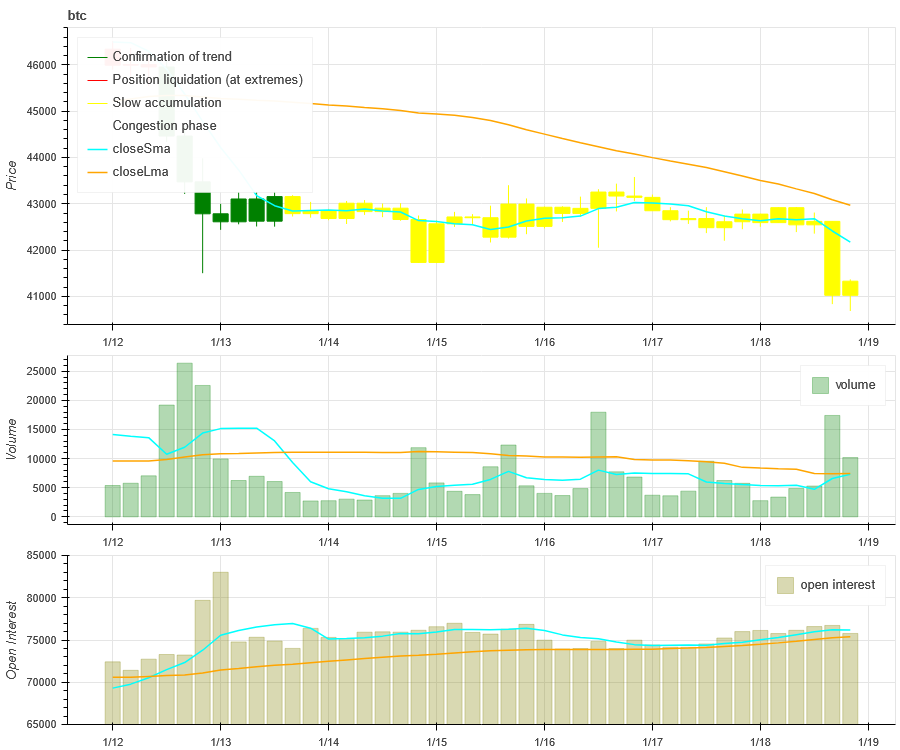
The price trend of BTC at the top of the picture above, the middle is the trading volume, the bottom is the open interest, the light blue is the 1-day average, and the orange is the 7-day average. The color of the K line represents the current status. Green means that the price rise is supported by trading volume, red means positions are being closed, yellow means positions are slowly accumulating, and black means congestion. The price trend of ETH at the top of the picture above, the middle is the trading volume, the bottom is the open interest, the light blue is the 1-day average, and the orange is the 7-day average. The color of the K line represents the current status. Green means that the price rise is supported by trading volume, red means positions are being closed, yellow means positions are slowly accumulating, and black means congestion.
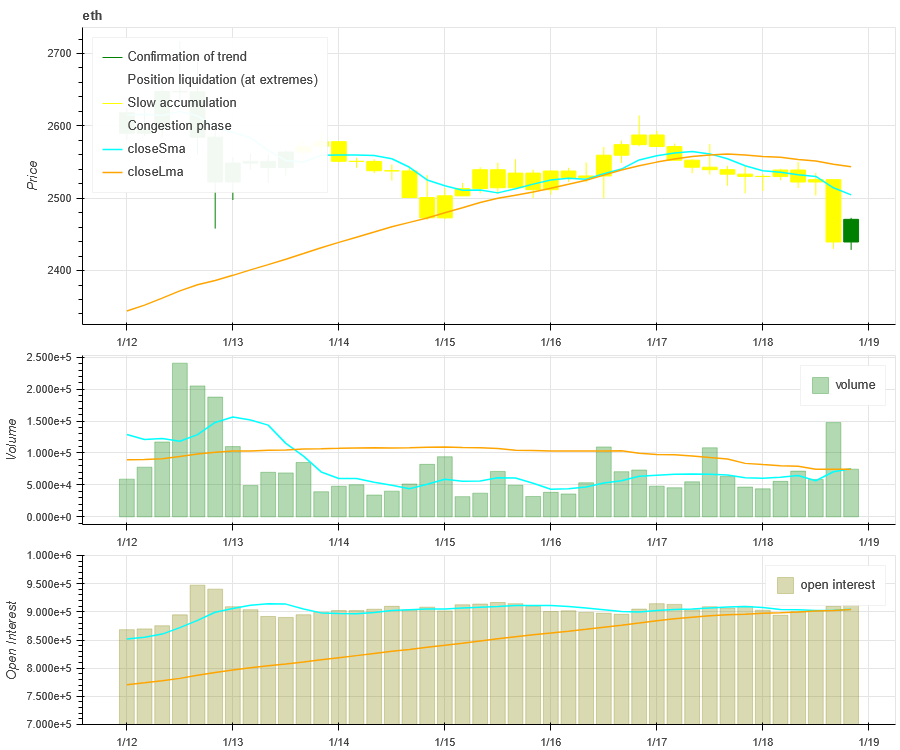
The price trend of ETH at the top of the picture above, the middle is the trading volume, the bottom is the open interest, the light blue is the 1-day average, and the orange is the 7-day average. The color of the K line represents the current status. Green means that the price rise is supported by trading volume, red means positions are being closed, yellow means positions are slowly accumulating, and black means congestion. The price trend of ETH at the top of the picture above, the middle is the trading volume, the bottom is the open interest, the light blue is the 1-day average, and the orange is the 7-day average. The color of the K line represents the current status. Green means that the price rise is supported by trading volume, red means positions are being closed, yellow means positions are slowly accumulating, and black means congestion.
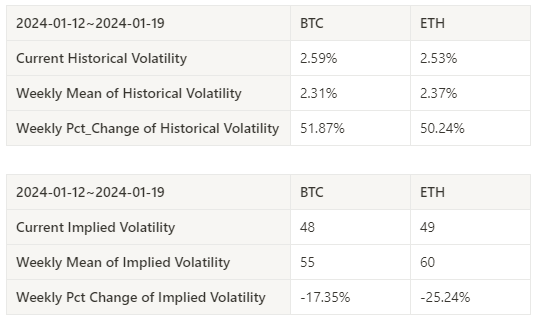
Historical Volatility vs. Implied Volatility
Historical volatility for BTC vs. ETH over the past week was highest during the 01.19 price drop, and implied volatility continues to decline significantly.
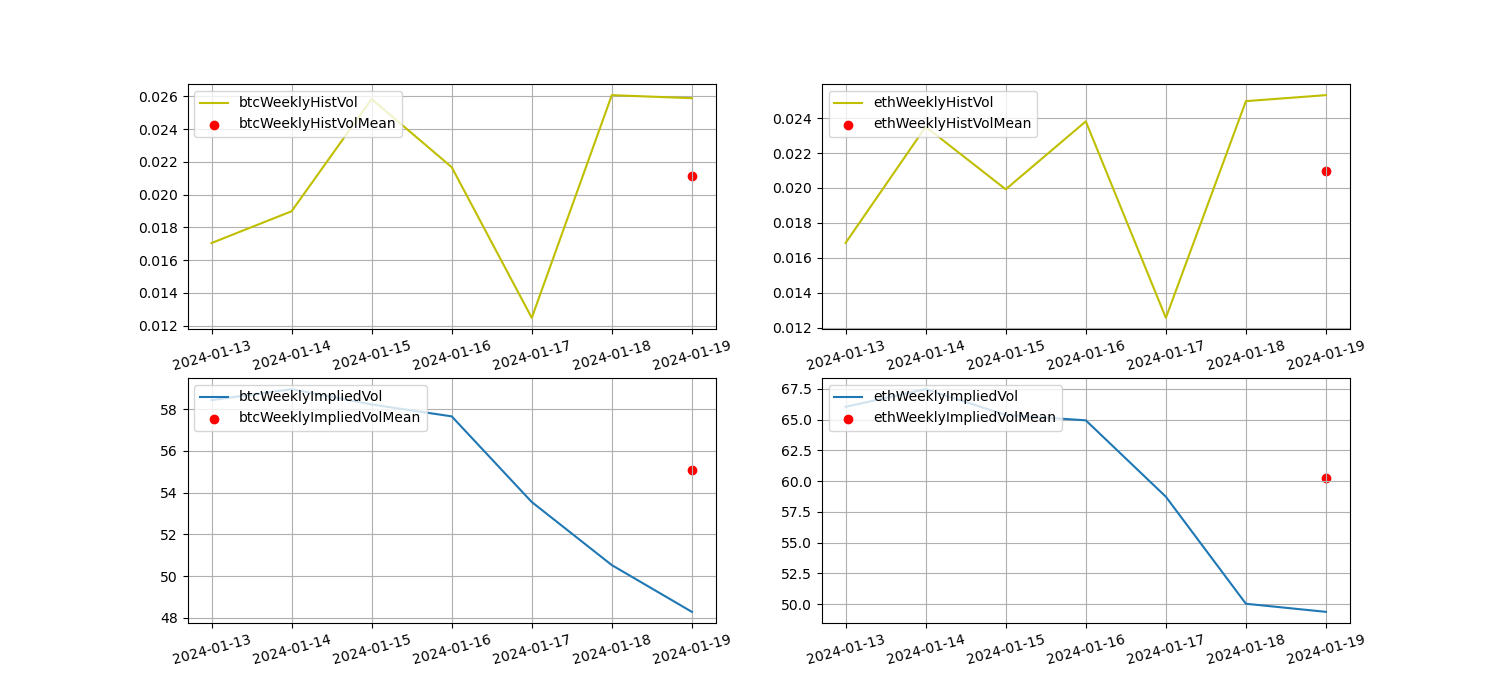
The yellow line is historical volatility, the blue line is implied volatility, and the red dot is its 7-day average
event driven
There are no major data releases this week.
sentiment indicator
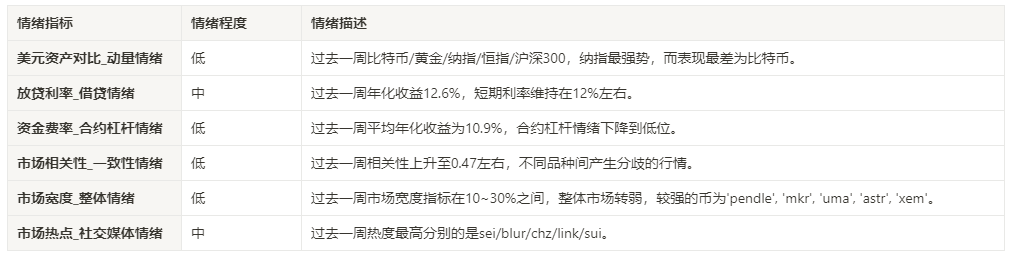
momentum sentiment
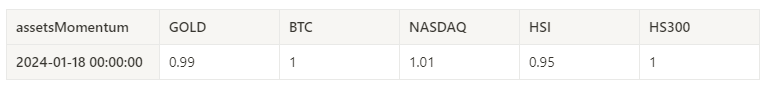
In the past week among Bitcoin/Gold/Nasdaq/HSI/CSI 300, Nasdaq was the strongest, while Bitcoin was the worst performer.
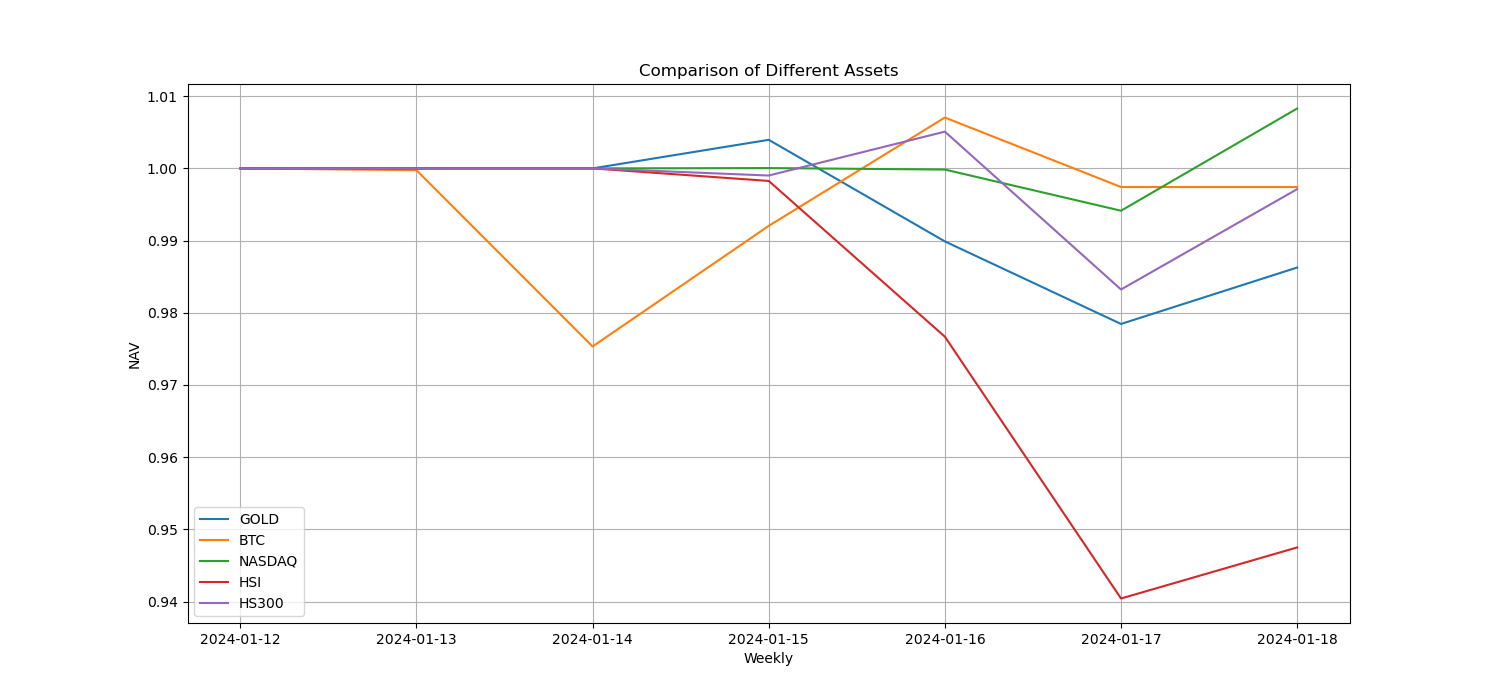
The picture above shows the trends of different assets over the past week.
Lending interest rate_Lending sentiment
The annualized return on USD lending averaged 12.6% in the past week, and short-term interest rates remained around 12%.
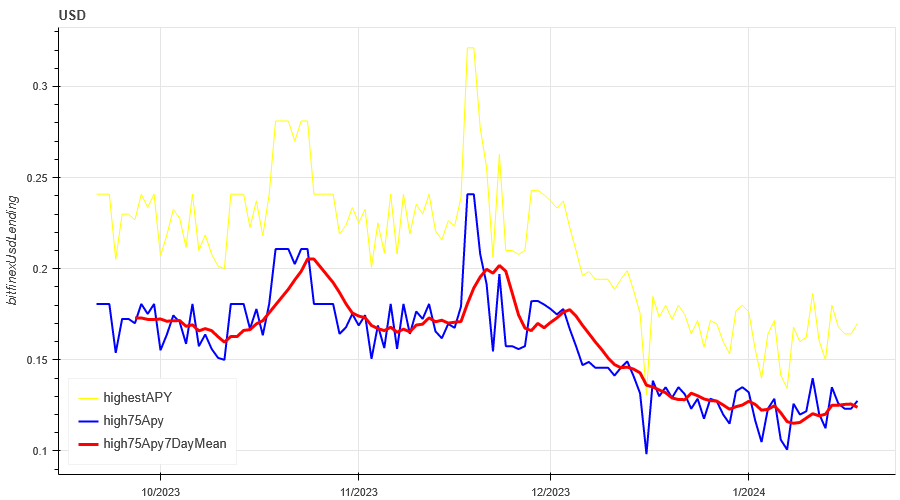
The yellow line is the highest price of the USD interest rate, the blue line is 75% of the highest price, and the red line is the 7-day average of 75% of the highest price
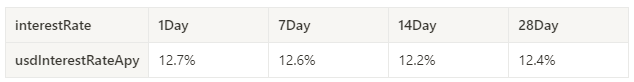
The table shows the average return of USD interest rate for different holding days in the past
Funding Rate_Contract Leverage Sentiment
The average annualized return on BTC tariffs in the past week was 10.9%, and contract leverage sentiment continues to be low.
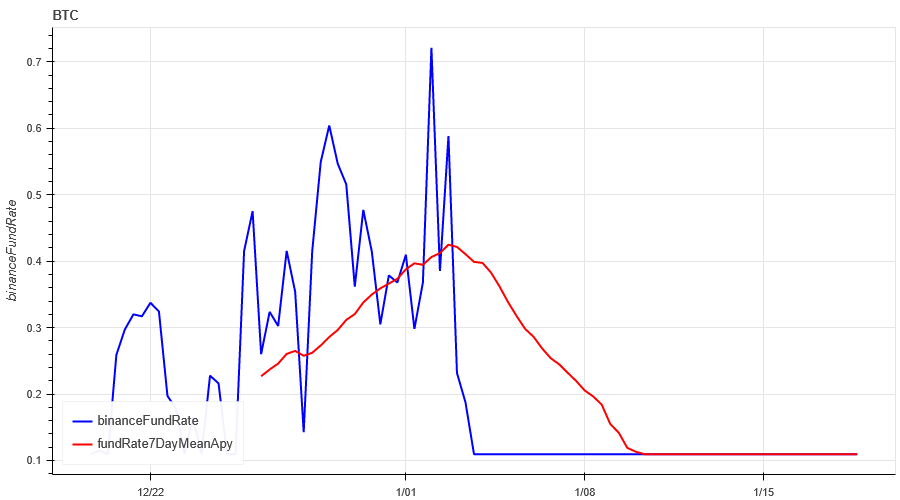
The blue line is the funding rate of BTC on Binance, and the red line is its 7-day average
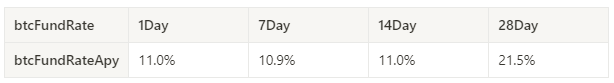
The table shows the average return of BTC fees for different holding days in the past
Market Correlation_Consistent Sentiment
Among the 129 coins selected in the past week, the correlation was around 0.47, indicating divergent prices among different varieties.
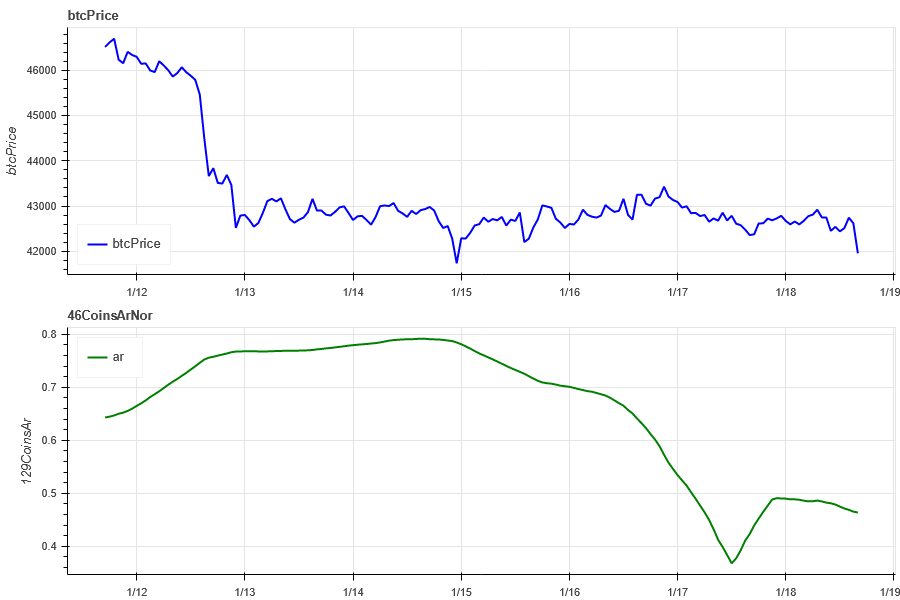
The blue line in the above picture first shows the Bitcoin price, and the green line is [ 1000 floki, 1000 lunc, 1000 pepe, 1000 shib, 100 0x ec, 1inch, aave, ada , agix, algo, ankr, ant, ape, apt, arb, ar, astr, atom, audio, avax, axs, bal, band, bat, bch, bigtime, blur, bnb, btc, celo, cfx, chz, ckb , comp, crv, cvx, cyber, dash, dgb, doge, dot, dydx, egld, enj, ens, eos,etc, eth, fet, fil, flow, ftm, fxs, gala, gmt, gmx, grt, hbar , hot, icp, icx, imx, inj, iost, iotx, jasmy, kava, klay, ksm, ldo, link, loom, lpt, lqty, lrc, ltc, luna 2 , magic, mana, matic, meme, mina, mkr, near, neo, ocean, one, ont, op, pendle, qnt, qtum, rndr, rose, rune , rvn, sand, sei, sfp, skl, snx, sol, ssv, stg, storj, stx, sui, sushi, sxp, theta, tia, trx, t, uma, uni, vet, waves, wld, woo, xem , xlm, xmr, xrp, xtz, yfi, zec, zen, zil, zrx] overall correlation
Market Breadth_Overall Sentiment
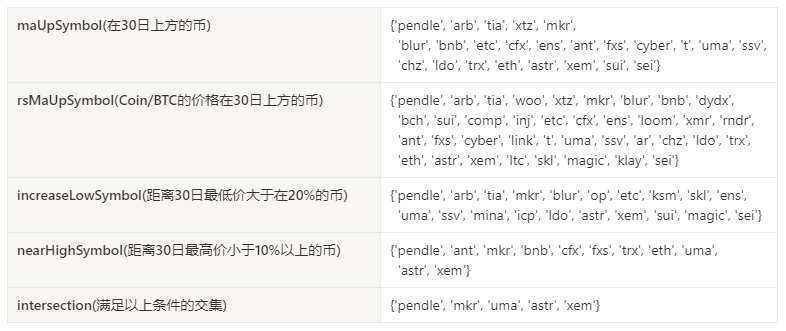
Of the 129 coins selected in the past week, 20% had prices above the 30-day moving average. Compared to BTC, 30% had prices above the 30-day moving average. 17% had prices greater than 20% from the lowest price in the past 30 days. , the proportion that is less than 10% from the highest price in the past 30 days is 10%, the overall market is weakening, and the stronger coins are pendle, mkr, uma, astr, xem.
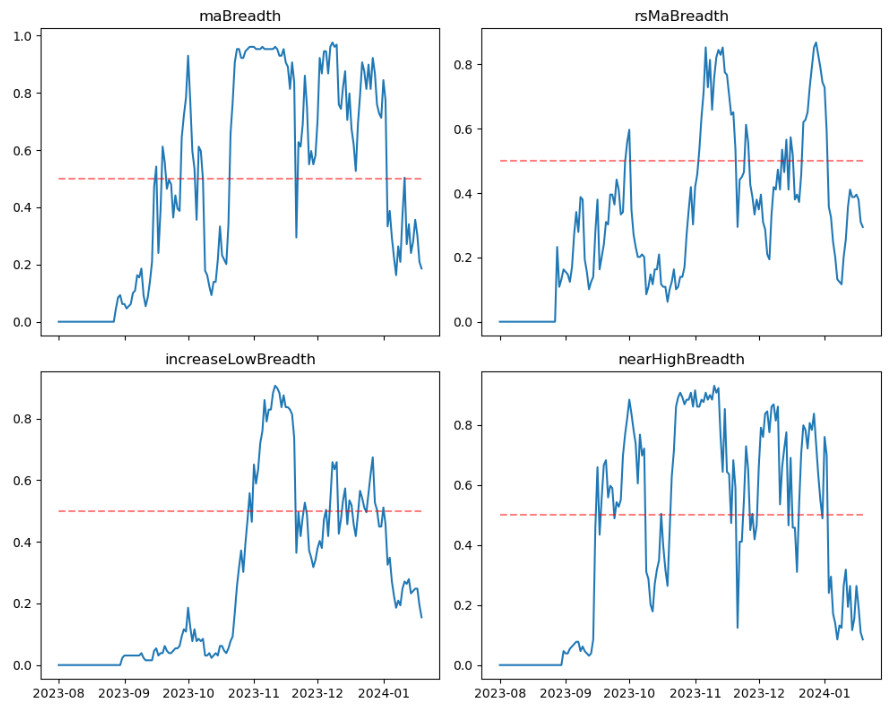
The picture above is [ 1000 floki, 1000 lunc, 1000 pepe, 1000 shib, 100 0x ec, 1inch, aave, ada, agix, algo, ankr, ant, ape, apt, arb, ar, astr, atom, audio, avax, axs, bal, band , bat, bch, bigtime, blur, bnb, btc, celo, cfx, chz, ckb, comp, crv, cvx, cyber, dash, dgb, doge, dot, dydx, egld, enj, ens, eos,etc, eth , fet, fil, flow, ftm, fxs, gala, gmt, gmx, grt, hbar, hot, icp, icx, imx, inj, iost, iotx, jasmy, kava, klay, ksm, ldo, link, loom, lpt , lqty, lrc, ltc, luna 2 , magic, mana, matic, meme, mina, mkr, near, neo , ocean, one, ont, op, pendle, qnt, qtum, rndr, rose, rune, rvn, sand, sei, sfp, skl, snx, sol, ssv, stg, storj, stx, sui, sushi, sxp, theta , tia, trx, t, uma, uni, vet, waves, wld, woo, xem, xlm, xmr, xrp, xtz, yfi, zec, zen, zil, zrx] The proportion of each width indicator on the 30th day
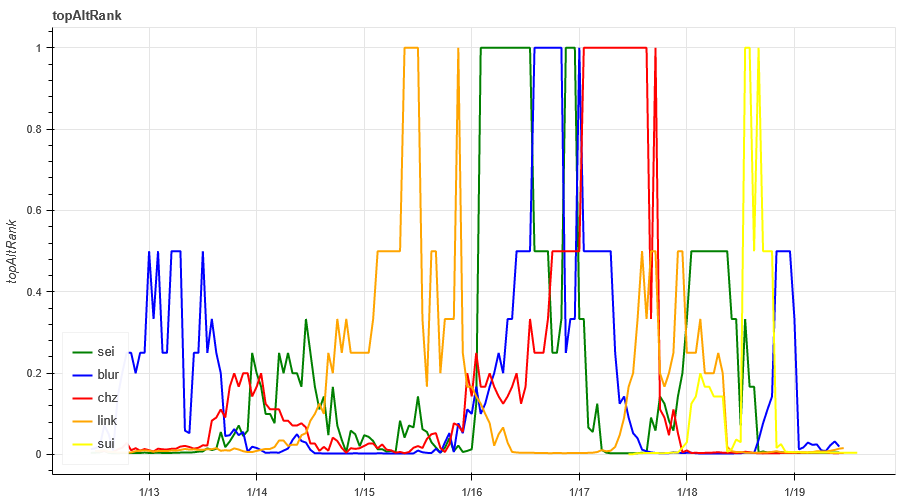
Market Hotspots_Social Media Sentiment
The popular ones in the past week are sei/blur/chz/link/sui.
Data Sources:https://lunarcrush.com/categories/cryptocurrencies
Summarize
This weeks market prices for BTC and ETH are both in decline. The implied volatility of both continues to decline significantly, trading volume continues to decline, and open interest continues to rise, indicating that the fluctuations will become smaller in the future; 129 Binance width indicators show The overall trend this week has weakened, with most coins in the market falling. The coins with stronger prices include pendle, mkr, uma, astr, xem; hot spots sei/blur/chz/link /sui rotates upward; in terms of events, there is no major data release this week.
Binance CopyTrading: CTA_ChannelCMT
Twitter: @DerivativesCN
Website: https://dcbot.ai/


