
加密市场情绪研究报告(01.05–01.12):ETF通过,加密货币成为长期高可信度资产
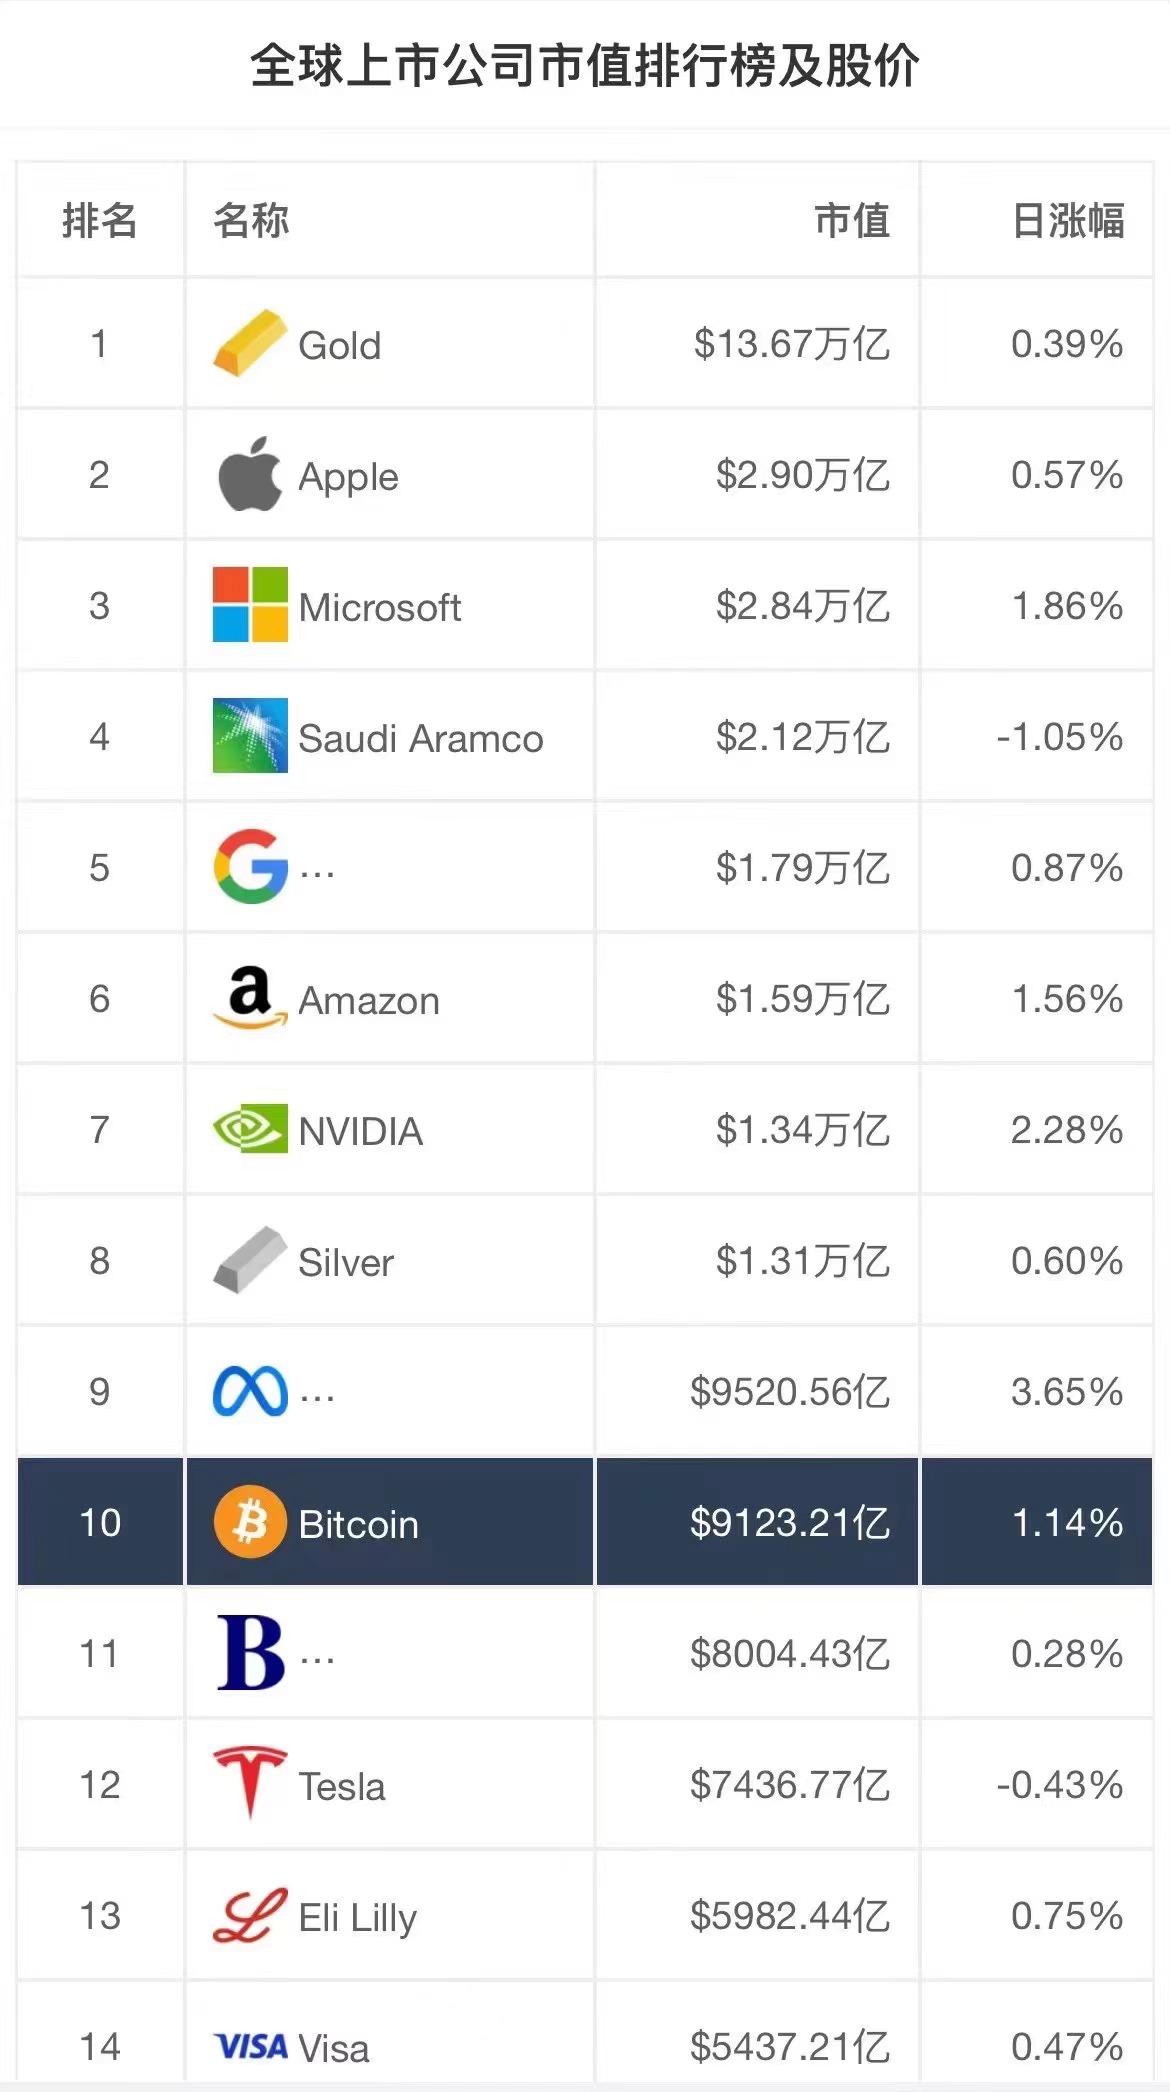
Potential to exceed tenth place in market capitalization:Cryptocurrencies gain wider recognition through ETFs, attracting more investors, and have the potential to surpass the market capitalization of the top ten assets (currently tenth).
Transaction volume surges:Cryptocurrency ETFs attract institutional investors, leading to significant increases in trading volume, improved liquidity and price stability, and increased appeal.
The purchase threshold is lowered:Offering cryptocurrencies through ETFs significantly lowers the barrier to entry for individual investors, who can invest through traditional brokerage accounts, simplifying the investment process.
Long-term allocation has regulatory guarantees:Approval of cryptocurrency ETFs provides regulatory oversight and investor protection, ensuring transparency, risk management and compliance, making long-term allocations safer.
Cryptocurrency is an emerging asset class that is transforming the traditional financial system with its features of decentralization, high security, and fast cross-border transfers. The emergence of cryptocurrency ETFs further enhances the credibility and appeal of cryptocurrencies as long-term investment assets, driving market growth, increasing investment accessibility, and providing investors with regulatory safeguards.
If you have an invisible, disdainful, and incomprehensible attitude towards cryptocurrencies, you may miss the growth opportunities brought about by this exciting financial innovation. The cryptocurrency market has huge potential and has been recognized by many institutions, investors and companies. By having a deep understanding of the fundamentals and market trends of cryptocurrency, as well as participating in investments through professional institutions in cryptocurrency, you can reduce risks and share in the benefits of this rapidly developing field.
The Bitcoin halving is about 87 days away from today (2024.01.12)
Countdown to halving:https://www.nicehash.com/countdown/btc-halving-2024-05-10-12-00?_360safeparam=1289146171
Market technical and emotional environment analysis
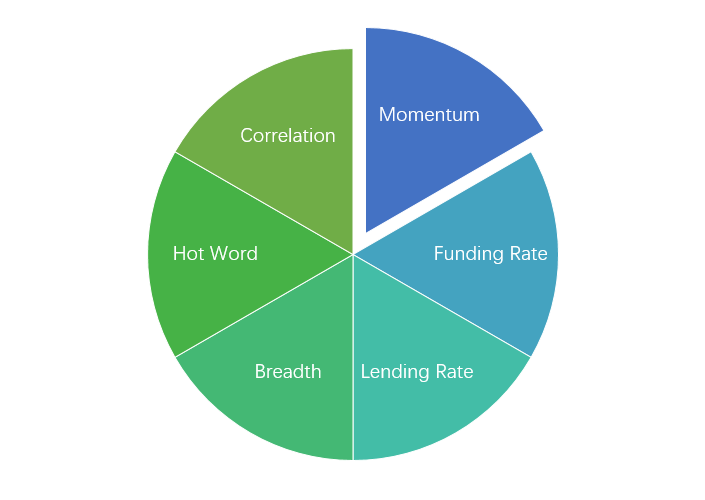
Sentiment analysis components

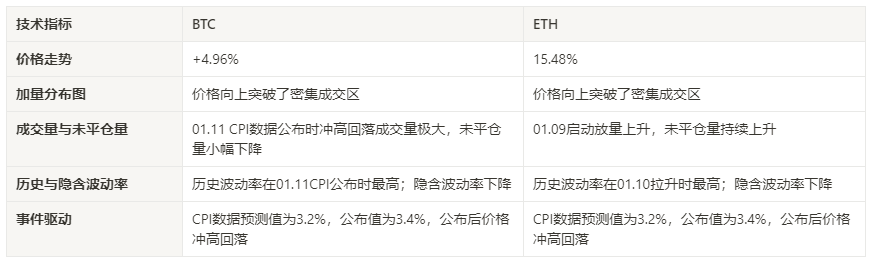
Technical indicators
Price trend
BTC price increased by +3.73% and ETH price fell by -3.29% over the past week.
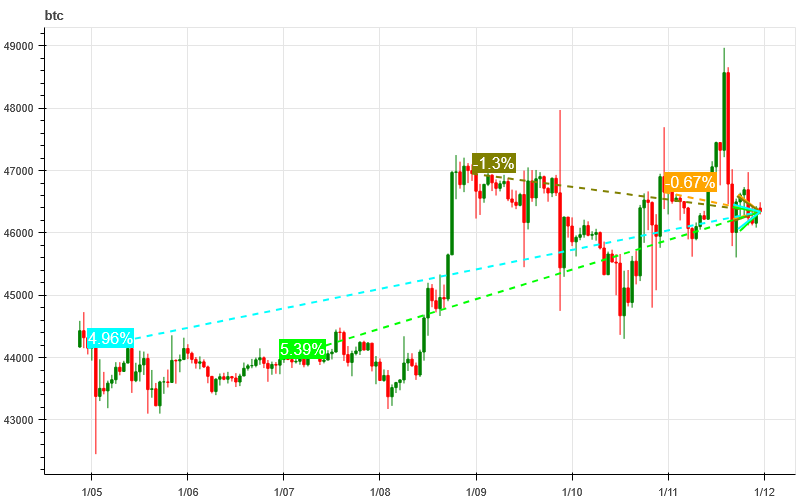
The picture above is the price chart of BTC over the past week
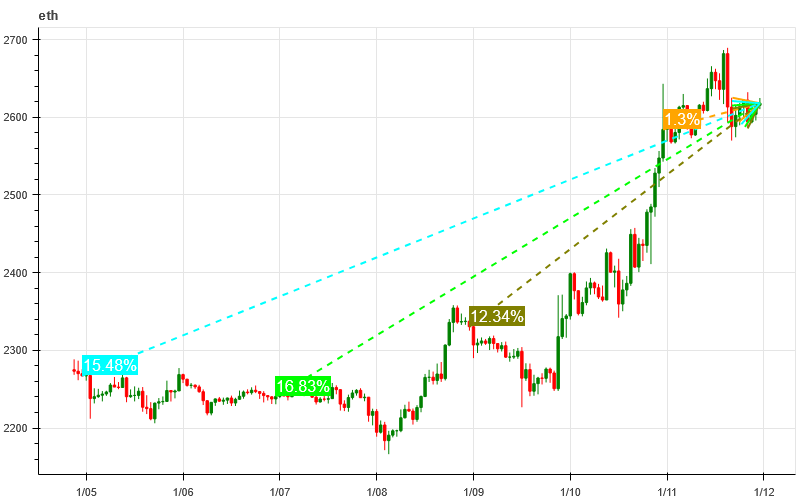
The picture above is the price chart of ETH over the past week
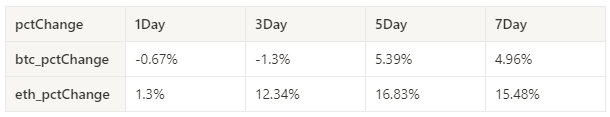
Table showing the rate of price change over the past week
Price and volume distribution chart (support and resistance)
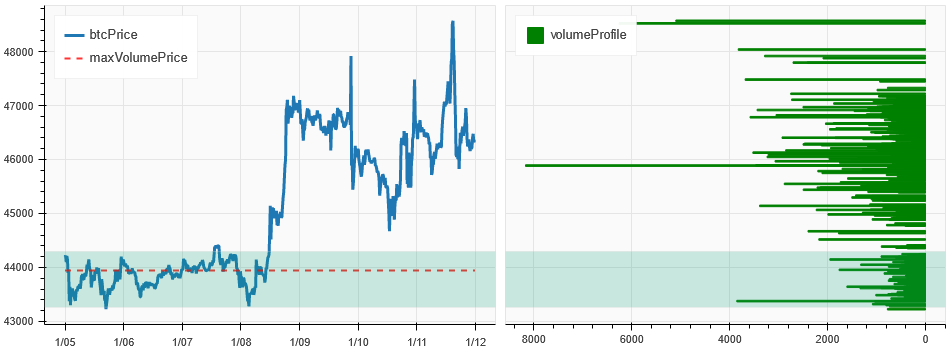
In the past week, BTC and ETH prices generated large trading volumes at relatively low levels and formed a bottom-intensive trading area.
The picture above is the distribution map of BTC’s intensive trading areas in the past week.
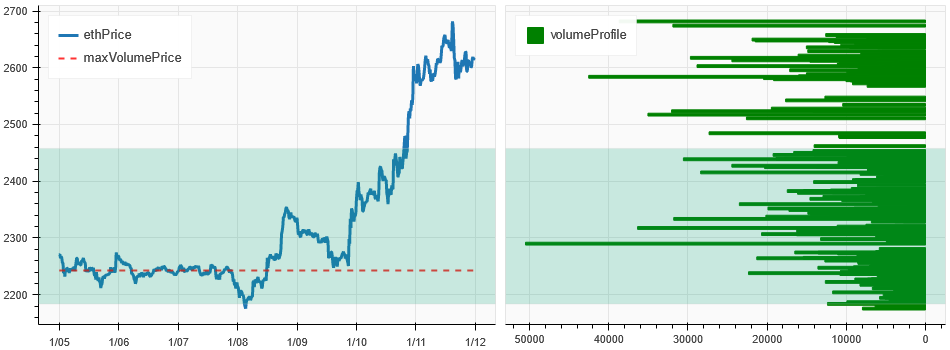
The picture above is the distribution map of ETH’s intensive trading areas in the past week.
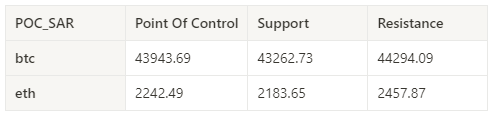
Table showing the intensive weekly trading ranges for BTC and ETH over the past week
Volume and Open Interest
In the past week, BTC and ETH both fell sharply at 01.03 with huge trading volume; both BTC and ETH’s open interest dropped significantly.
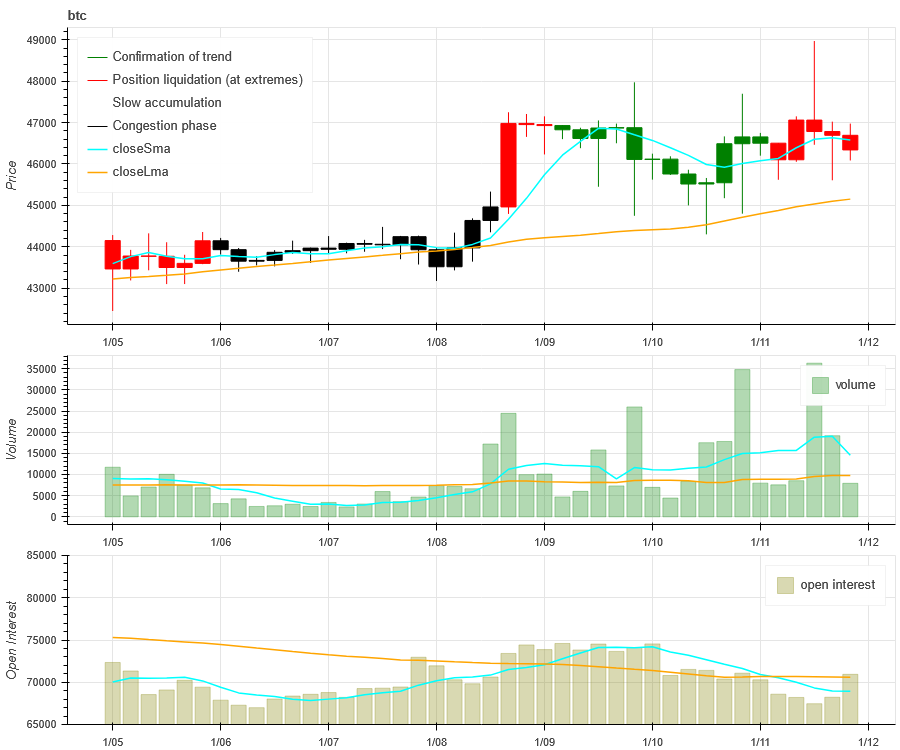
The price trend of BTC at the top of the picture above, the middle is the trading volume, the bottom is the open interest, the light blue is the 1-day average, and the orange is the 7-day average. The color of the K line represents the current status. Green means that the price rise is supported by trading volume, red means positions are being closed, yellow means positions are slowly accumulating, and black means congestion.
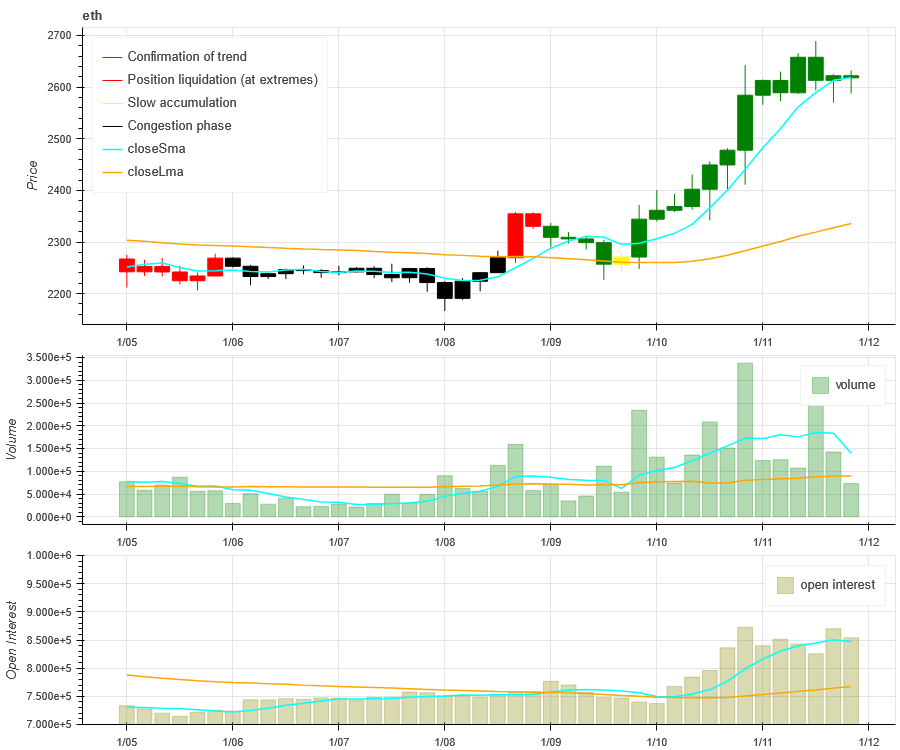
The price trend of ETH at the top of the picture above, the middle is the trading volume, the bottom is the open interest, the light blue is the 1-day average, and the orange is the 7-day average. The color of the K line represents the current status. Green means that the price rise is supported by trading volume, red means positions are being closed, yellow means positions are slowly accumulating, and black means congestion.
Historical Volatility vs. Implied Volatility
Historical volatility over the past week was highest for BTC when CPI was announced at 01.11 and for ETH when it was higher at 01.10, with implied volatility falling significantly.
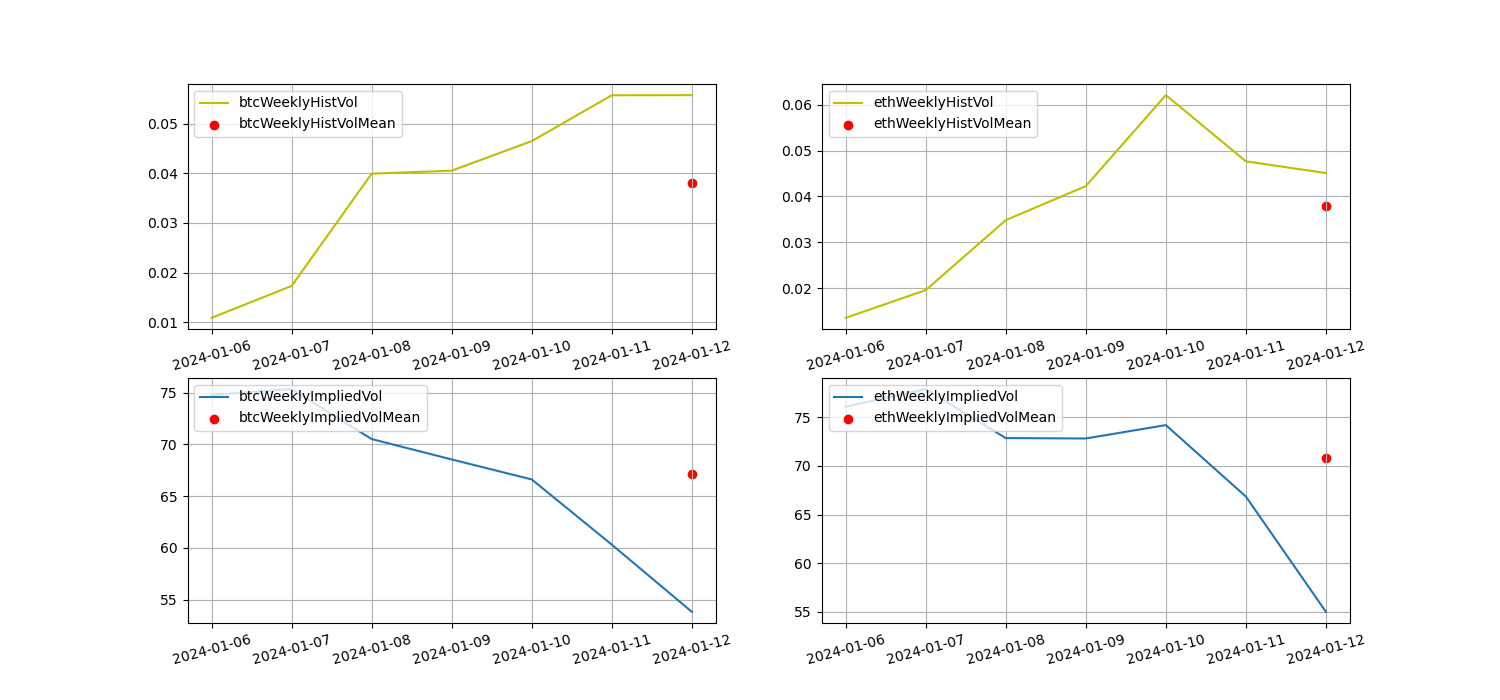
The yellow line is historical volatility, the blue line is implied volatility, and the red dot is its 7-day average
event driven
This week, CPI data was released at 21:30 Beijing time on January 11, 2024. The predicted value was 3.2% and the published value was 3.4%. After the announcement, Bitcoin rose and fell.
sentiment indicator
momentum sentiment
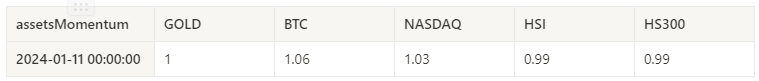
Among Bitcoin/Gold/Nasdaq/HSI/CSI 300 over the past week, Bitcoin was the strongest, while the worst performer was the Hang Seng Index.
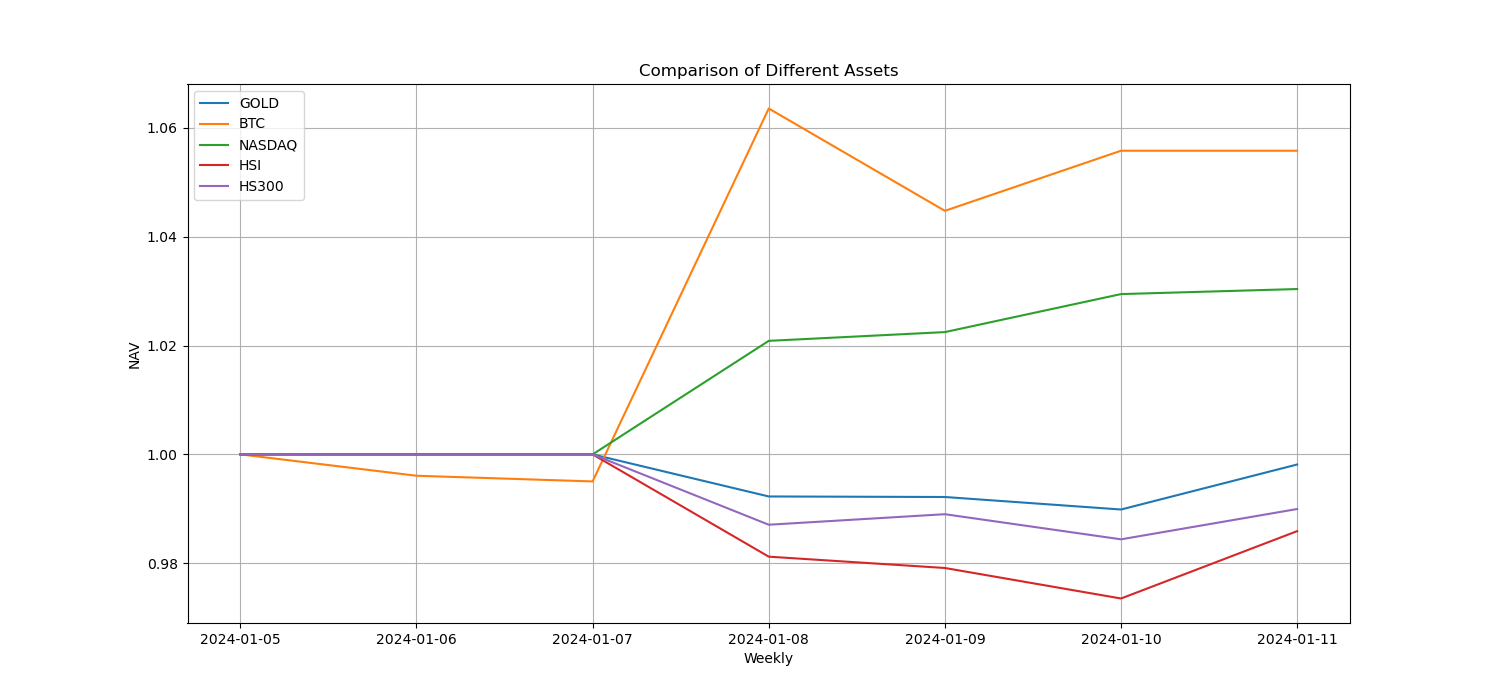
The picture above shows the trends of different assets over the past week.
Lending interest rate_Lending sentiment
Annualized returns on USD lending averaged 12.1% over the past week, with short-term interest rates rebounding.
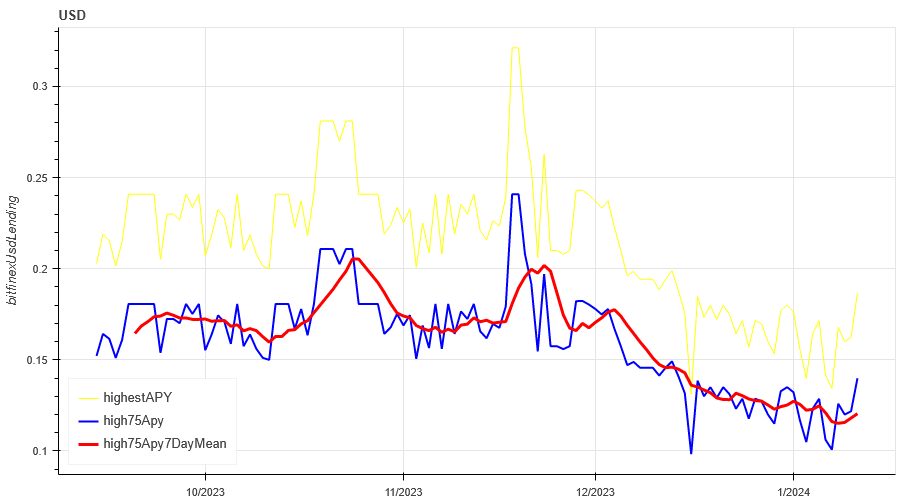
The yellow line is the highest price of the USD interest rate, the blue line is 75% of the highest price, and the red line is the 7-day average of 75% of the highest price
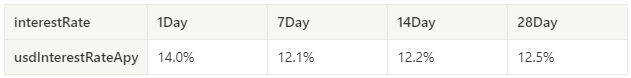
The table shows the average return of USD interest rate for different holding days in the past
Funding Rate_Contract Leverage Sentiment
The average annualized return on BTC rates over the past week was 10.9%, and contract leverage sentiment dropped to lows.
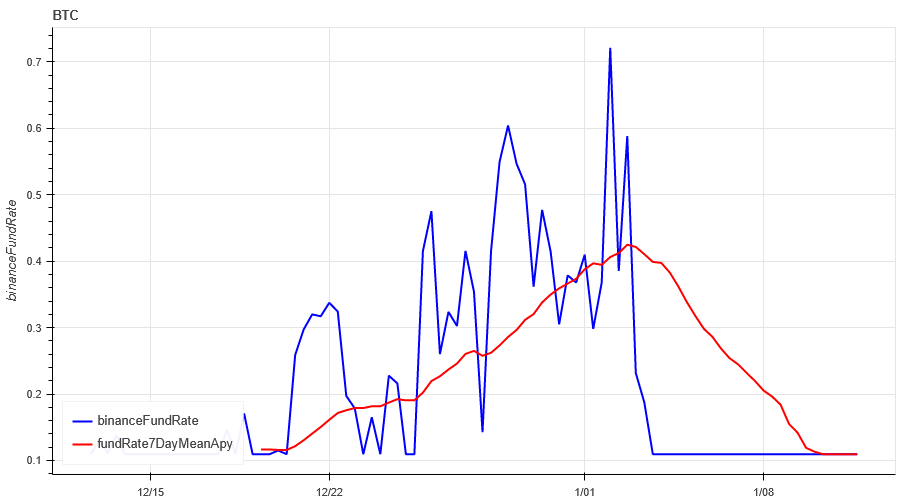
The blue line is the funding rate of BTC on Binance, and the red line is its 7-day average. The table shows the average return of BTC rates for different holding days in the past.
Market Breadth_Overall Sentiment
52% of the 129 coins selected in the past week were above the 30-day moving average, and currently more than half of the coins have risen above the 30-day moving average.
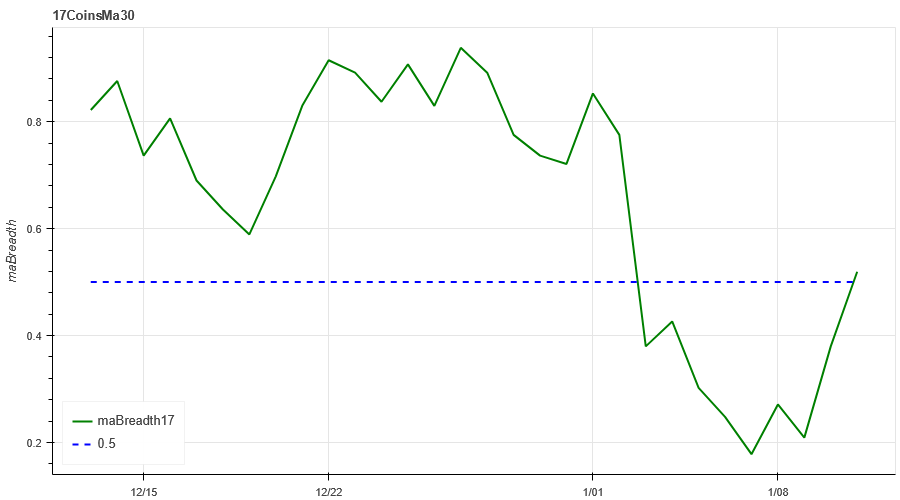
The picture above is [ 1000 floki, 1000 lunc, 1000 pepe, 1000 shib, 100 0x ec, 1inch, aave, ada, agix, algo, ankr, ant, ape, apt, arb, ar, astr, atom, audio, avax, axs, bal, band , bat, bch, bigtime, blur, bnb, btc, celo, cfx, chz, ckb, comp, crv, cvx, cyber, dash, dgb, doge, dot, dydx, egld, enj, ens, eos,etc, eth , fet, fil, flow, ftm, fxs, gala, gmt, gmx, grt, hbar, hot, icp, icx, imx, inj, iost, iotx, jasmy, kava, klay, ksm, ldo, link, loom, lpt , lqty, lrc, ltc, luna 2 , magic, mana, matic, meme, mina, mkr, near, neo , ocean, one, ont, op, pendle, qnt, qtum, rndr, rose, rune, rvn, sand, sei, sfp, skl, snx, sol, ssv, stg, storj, stx, sui, sushi, sxp, theta , tia, trx, t, uma, uni, vet, waves, wld, woo, xem, xlm, xmr, xrp, xtz, yfi, zec, zen, zil, zrx] proportion above the 30-day moving average
Market Correlation_Consistent Sentiment
The correlation among the 46 coins selected in the past week is around 0.65, and the prices among different varieties are relatively consistent.
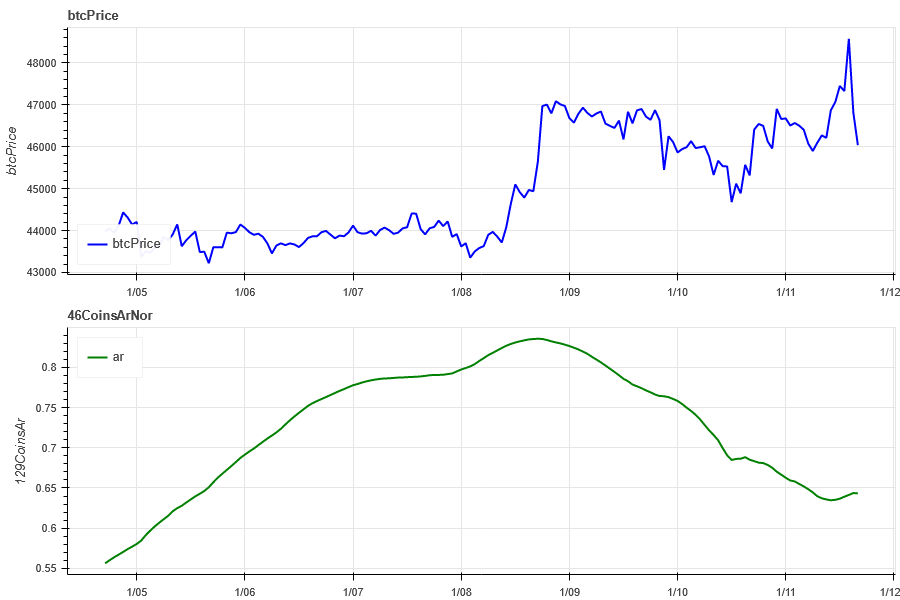
The blue line in the above picture first shows the Bitcoin price, and the green line is [ 1000 floki, 1000 lunc, 1000 pepe, 1000 shib, 100 0x ec, 1inch, aave, ada , agix, algo, ankr, ant, ape, apt, arb, ar, astr, atom, audio, avax, axs, bal, band, bat, bch, bigtime, blur, bnb, btc, celo, cfx, chz, ckb , comp, crv, cvx, cyber, dash, dgb, doge, dot, dydx, egld, enj, ens, eos,etc, eth, fet, fil, flow, ftm, fxs, gala, gmt, gmx, grt, hbar , hot, icp, icx, imx, inj, iost, iotx, jasmy, kava, klay, ksm, ldo, link, loom, lpt, lqty, lrc, ltc, luna 2 , magic, mana, matic, meme, mina, mkr, near, neo, ocean, one, ont, op, pendle, qnt, qtum, rndr, rose, rune , rvn, sand, sei, sfp, skl, snx, sol, ssv, stg, storj, stx, sui, sushi, sxp, theta, tia, trx, t, uma, uni, vet, waves, wld, woo, xem , xlm, xmr, xrp, xtz, yfi, zec, zen, zil, zrx] overall correlation
Market Hotspots_Social Media Sentiment
The hot rotation in the past week was stx/arb/gmt/etc/ens.
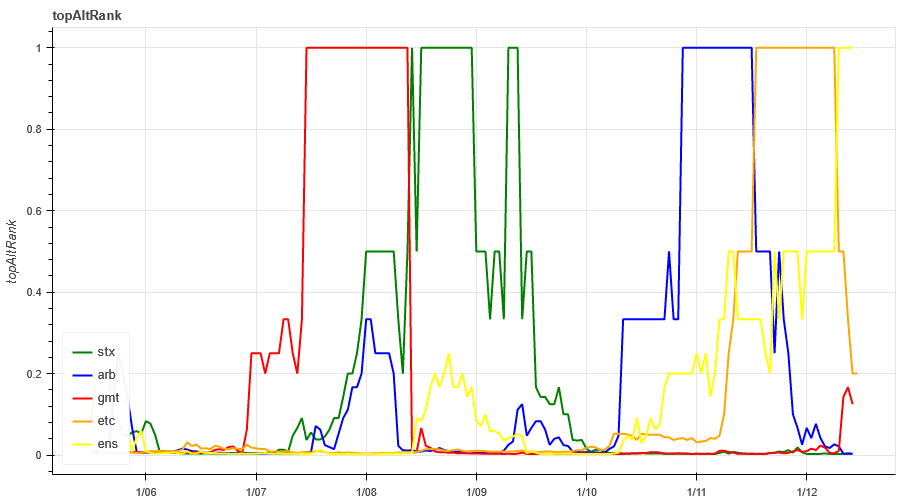
Data Sources:https://lunarcrush.com/categories/cryptocurrencies
Summarize
This weeks market price of BTC surged higher and fell back, with significantly more profit-taking positions, while ETHs upward momentum was stronger, and the implied volatility of both dropped rapidly, indicating that after the announcement of the adoption of ETF, the volatility will Gradually converge; 129 Binance breadth indicators show that 52% of small market capitalization coins are above the moving average this week, and most currency exchanges in the market have rebounded; hot spots stx/arb/gmt/etc/ens have increased in rotation, but the increase is not In terms of major events, BTC and ETH fell after the CPI data of 1.11 was released.
Binance CopyTrading: CTA_ChannelCMT
Twitter: @DerivativesCN
Website: https://dcbot.ai/


