
veDAO Research Institute: How to Use Sentiment Analysis to Gain Insights into the Direction and Opportunities in the Crypto World
Market sentiment is an assessment of traders' attitudes and emotions, which can impact their investment decisions, especially in the highly volatile cryptocurrency market where market sentiment can experience rapid fluctuations. The ups and downs of market sentiment often indicate new opportunities or potential pressures and risks. If you are not familiar with sentiment analysis in cryptocurrencies, this article is suitable for you.
This article will introduce you to sentiment analysis methods and classic sentiment analysis indicators in the crypto world, as well as share several related practical tools that will help you gain a more scientific understanding of market sentiment and make more accurate predictions about token price movements.
What is sentiment analysis?
In the financial environment, "sentiment" refers to the perception and feedback on market conditions. Cryptocurrency market sentiment describes investors' reactions and attitudes towards macro market prices, reflecting the psychology of those involved in cryptocurrency trading and development.
In simple terms, sentiment analysis is the process of detecting positive or negative emotions in text. It was initially used to analyze sentiment in social data, measure brand reputation, and understand customers by assigning scores to text based on the corresponding emotions. For example, "excitement" corresponds to a score of +0.5, while "panic" corresponds to a score of -0.4. Each word is assigned a score based on its level of positivity or negativity, and all the scores are summed to determine the overall sentiment of a sentence. Typically, the score ranges between -1 and +1, with -1 representing extremely negative sentiment and +1 representing extremely positive sentiment.
This analysis method can be widely applied in the crypto world, where cryptocurrency sentiment data is derived from textual information on social media platforms such as Twitter, Discord, Telegram, and others. A sentiment analysis tool can aggregate real-time dynamic information from major platforms and protocol communities, analyze and summarize the current market sentiment based on a scoring system and corresponding weights, and provide auxiliary guidance for investors' market behavior. Otherwise, investors would need to manually and time-consumingly browse different social networks to discover the psychological perceptions of specific tokens.
Sentiment Analysis in the Crypto World
Just last month, four researchers from Pennsylvania State University in the United States published a research paper on "Cryptocurrency Sentiment Analysis." Their findings showed that social media sentiment can significantly predict the returns of cryptocurrencies, and fundamental events play a role in shaping these sentiments.
Emotions played a role in this regard. In addition, the study also found that market prosperity is positively correlated with momentum returns, but not positively predicting volatility. This suggests that emotions affect returns through price perception and demand shocks rather than risk premium channels. Overall, the paper emphasizes the importance of emotions in understanding and predicting the dynamics of the cryptocurrency market.Cryptocurrency Fear and Greed Index
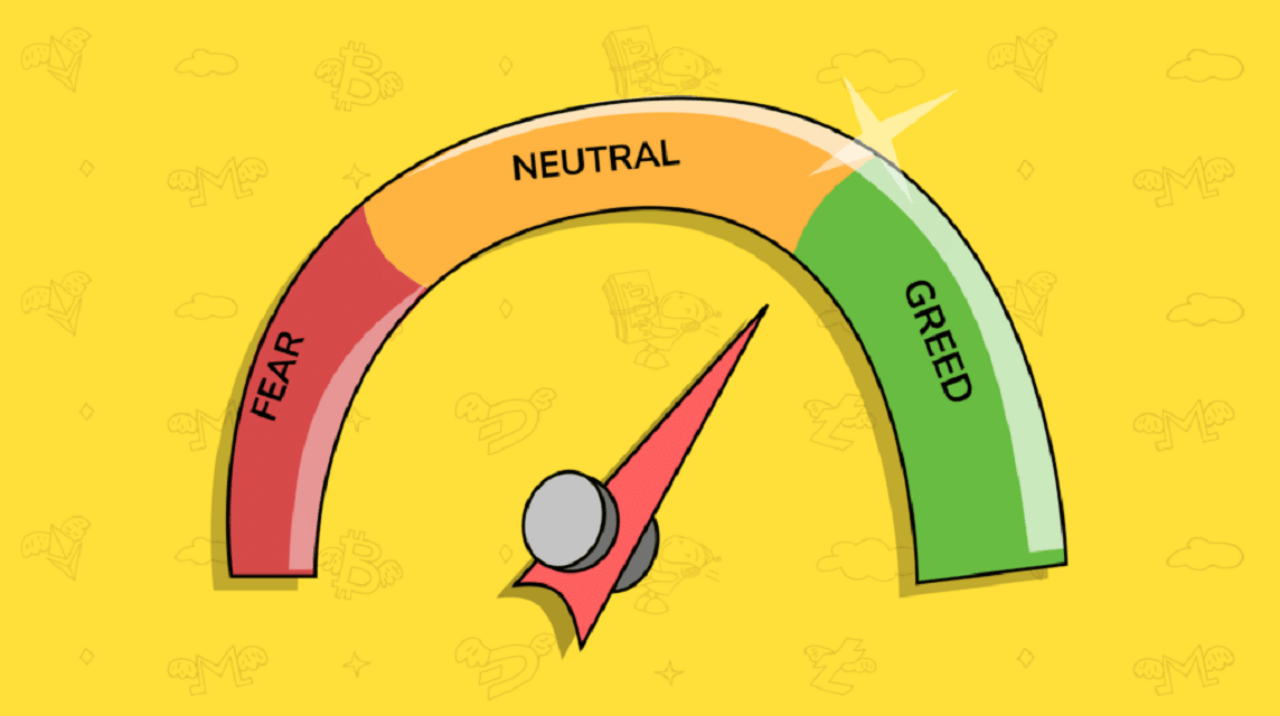
The Cryptocurrency Fear and Greed Index is an analytical tool used to measure market sentiment in the cryptocurrency field, particularly in the Bitcoin domain. The index ranges from 0 to 100, with values close to 0 indicating extreme fear and values close to 100 indicating extreme greed.
The Cryptocurrency Fear and Greed Index is calculated using six main factors, each weighted according to perceived importance. These factors include:
Market momentum and trading volume (25% ): The calculation of this index compares the current daily trading volume and momentum with the 30-day and 90-day averages. Larger sales volume and daily negative market trends indicate significant selling pressure, thus increasing panic. In contrast, large buying volume and repeated positive market trends indicate intensified greed.
Volatility (25% ): The higher the volatility of the cryptocurrency, the more fearful investors may be, resulting in a lower score for this index. Similar to market momentum and trading volume, volatility is compared to the 30-day and 90-day averages to determine value decrease (maximum drawdown).
Trend (10% ): Higher search volume usually indicates greater potential greed, thus resulting in a higher index score. However, not all search weights are the same, negative searches such as 'Bitcoin market manipulation' and 'Bitcoin crash' indicate greater market fear.
Dominance (10% ): Dominance focuses on the percentage of Bitcoin's market value compared to the total market value of all cryptocurrencies. It is generally believed that an increase in Bitcoin's dominance (increased market share) represents a scarier market, as investors may see Bitcoin as a cryptocurrency "safe haven." In contrast, this index considers increased altcoin investments as a greedier market, with more speculators willing to invest in lesser-known assets in hopes of substantial returns.
Social Media (15% ): This algorithm collects and calculates posts with cryptocurrency-related hashtags and measures the posting velocity and engagement of cryptocurrency-related posts within a specific time period. Higher engagement rates typically reflect more market greed, while lower engagement rates may indicate more fearful market behavior.
Surveys (15% ): Surveys can be used to gauge investor sentiment towards cryptocurrencies. Bullish responses can indicate greed, while bearish responses can indicate fear.
This index provides a comprehensive reflection of market sentiment and serves as an emotional indicator and risk management tool, helping investors make informed decisions and avoid excessive emotional reactions. When the market is driven by extreme fear or greed, it often leads to overcorrection. Specifically, investors can use it to:
Measuring market sentiment: High values indicate that the market may be overbought (extreme greed), while low values indicate that the market may be oversold (extreme fear).
Providing information for investment decisions: High values may mean caution or sell, while low values may mean a good time to buy. However, other market factors should always be considered and due diligence should be done.
Risk management: This index can help manage the risk level of investment portfolios and help balance between potential high return, high risk investments and safer, low return investments.
Bull/Bear Index
The GMI Bull/Bear Index is an index based on the rate of price change and the status of perpetual contract funding rates. This index has a strong ability to identify bull/bear transitions in historical backtesting for medium to long cycles (six months to one year), and it can also provide observation assistance for important reference directions such as public trading psychology, market frenzy states, and short-term breakthrough intentions.

The GMI index is directly proportional to the speed of BTC price increase and inversely proportional to the size of perpetual contract funding rates. It is calculated based on the historical price trend changes of Bitcoin and the funding rate of perpetual contracts, that is: GMI = Bitcoin price rate of increase / Bitcoin perpetual contract funding rate level.
When using the GMI Bull/Bear Index, first of all, it is necessary to know that when GMI >= 0.4, it is displayed as a bull market; when GMI < 0.4, it is displayed as a bear market. Secondly, we know that GMI has the following four states:
GMI falls, price rises: A negative signal, the rate of increase in bullish energy is less than the rate of increase in bearish power, which means there is market panic and there is room for price correction;
GMI rises, price falls: A positive signal, the rate of decrease in bullish energy is less than the rate of decrease in bearish power;
GMI rises along with price: A positive signal, the rate of increase in bullish energy is greater than the rate of increase in bearish power;
GMI and price drop together: It is a negative signal, the speed of the decline in bullish energy is greater than the speed of the decline in bearish energy. Since its launch, the GMI Bull and Bear Index has been very accurate, successfully helping some users avoid major drops and bravely increase their holdings. It can be used together with the Fear and Greed Index and other tools to assist in investment decisions.
Practical Analysis Tools
1. Cryptocurrency Fear and Greed Index Dashboard created by Alternative.me
The Fear and Greed Index created by this website is updated daily. It not only quantifies emotions but also uses visual color gradients to intuitively show users the current level of market fear and greed index. It also summarizes the index information from yesterday, last week, and last month.
The current cryptocurrency fear and greed index is an excellent benchmark for cryptocurrency traders, investors, and market analysts, as mentioned above. However, it also has its limitations, such as its focus on Bitcoin and biased sentiment reactions towards other cryptocurrencies. Its calculation is also not completely transparent. While the weights for major categories are publicly disclosed, the composition of subcategories and their calculation percentages are undisclosed.
Related link: https://alternative.me/crypto/fear-and-greed-index/
2. On-chain and cryptocurrency social media analysis tool Santiment
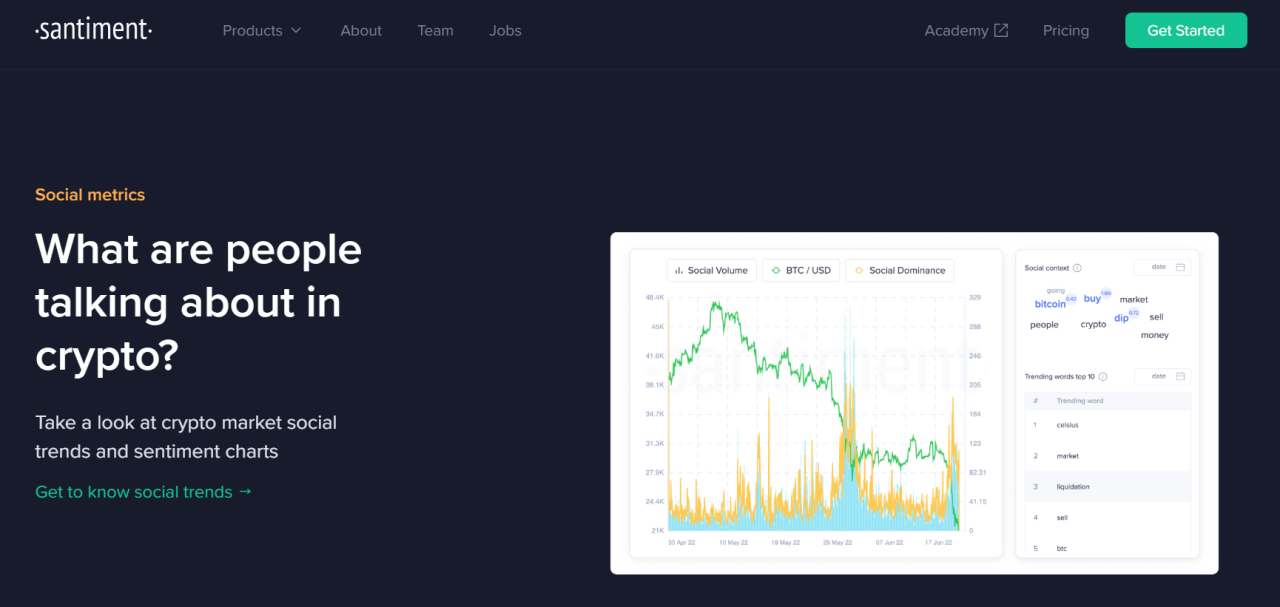
Santiment is a comprehensive data analysis tool designed to guide cryptocurrency traders to make optimal trading decisions based on real-time data rather than emotions. It predicts potential market cycle tops (the best time to exit the market) or potential market cycle bottoms (the best time to enter the market) by combining token social media activities, movements of funds in and out of idle or important wallets, and many other indicators.<
Within the social media analytics page, users can enter keywords they want to query, such as "buy the dip," "sell," "bottom," etc., and show users the streaming data from social platforms like telegram, reddit, twitter, etc., and then summarize the quantity statistics based on the time dimension.
The user interface of Santiment is very user-friendly and easy to use platform. It has a large number of data sources, including on-chain, social media, and financial reports, with a data history that goes back to 2009. It analyzes over 7 million social messages daily and provides 731 available metrics and 22 available wallet labels, all of which are real-time and up-to-date. However, it requires relatively high costs compared to other cryptocurrency analytics platforms.
Related link: https://santiment.net/
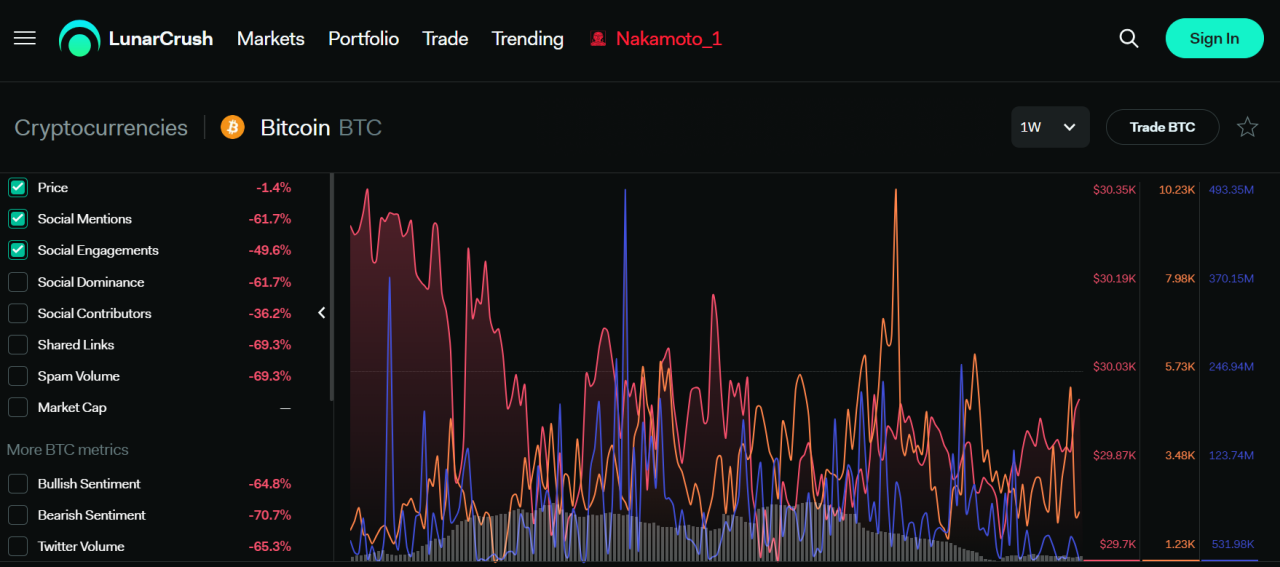
3. Social media monitoring and analysis tool LunarCrush LunarCrush
Uses AI-managed algorithms to collect information and return it to users in an easily understandable way, enabling users to search, track, and actively engage in discussions on trending topics across all social media.
On LunarCrush, over 2000 different cryptocurrencies are listed, categorized based on the market sentiment identified by the data extracted from various sites considered by the application. Social networks like Twitter, Reddit forums, Youtube video hosts, and Medium blog platforms are all checked using AI-managed algorithms, providing users with a set of indicators summarizing the sentiment of the cryptocurrency market.
For example:
Social mentions: The number of times cryptocurrency is mentioned within a given time period. If someone uses the word "Bitcoin" on Twitter, the social mentions of Bitcoin will increase by 1 during the analyzed period.
Social engagement: The level of community involvement around cryptocurrency. This metric takes into account publications, reviews, and even sharing reactions to exclude any form of manipulation and spam.
Social contributors: Similar to collecting the unique mention count in "social mentions," this statistical data determines the number of unique individuals discussing a particular topic within a given time period.
Shared link: The number of times URL links related to cryptocurrency have been shared. These can be articles, blockchain explorers, or candlestick charts.
On July 12th, LunarCrush completed a $5 million Series A funding round with lead investment from Draper Round Table and INCE Capital. Following the funding, LunarCrush also released a beta version of its social search tool, which will allow users to search for any topic on the platform, not just financial products. The new tool enables users to search across all social media platforms for the most relevant content related to their specific interests.
The platform is free to access without registration. Through a variety of optional indicators, users can gain a more intuitive understanding of the current popularity of all cryptocurrencies, which can be helpful for investors in making investment decisions, allowing them to rely on more than just candlestick charts to judge market trends.
Related link: https://lunarcrush.com/
4. veDAO: Web 3 Investment Compass
veDAO is a decentralized investment platform driven by DAO, dedicated to helping investors capture Alpha accurately and achieve hundredfold returns. It has a TB-level project database covering nearly 70 mainnet ecosystems and 40 web 3 tracks. This includes 22000+ Twitter KOL, 3700+ investment institutions, 20000+ whale addresses, and 6000+ related information. In addition to a comprehensive project evaluation system and the veDAO Expert Committee composed of well-known web 3 organizations, veDAO will also launch two tracking modules in August—Twitter tracking and Topic tracking.
;Emotion Tracking, Smart Money Signal Tracking.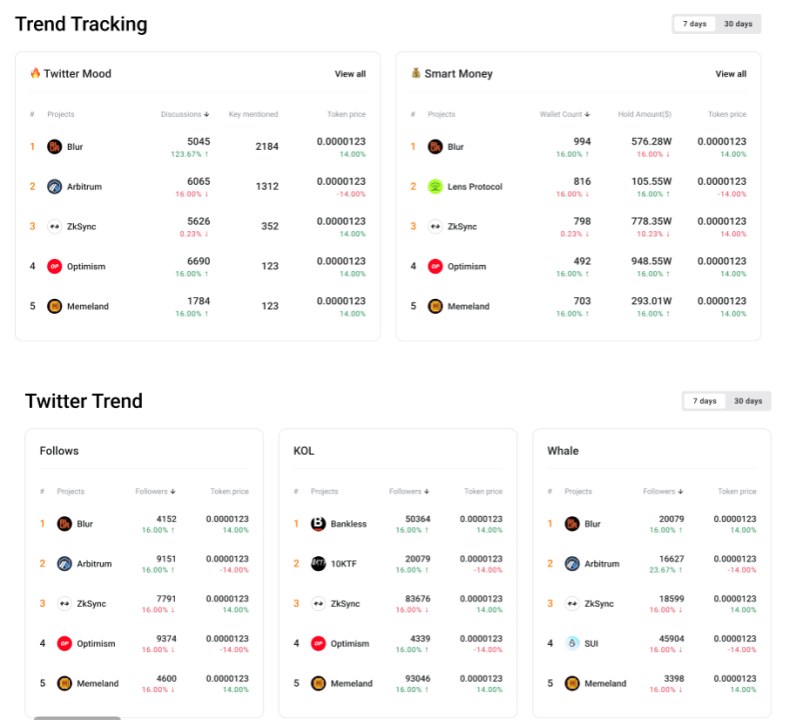
vedao New Version Design Draft
By leveraging the advantages of a massive database, analyze and track sentiment on Twitter, intuitively display the current project's popularity through intelligent sorting. The analyzed indicators include: the number of mentions and changes by KOLs, the number of KOLs mentioning it, token price changes, etc. This allows users to quickly and accurately understand the most concentrated sentiment on Twitter, thereby grasping the latest token market trends and information, aiding in adjustment of investment strategies, enabling faster tracking of Alpha, and early risk avoidance.
vedao New Version Design Draft
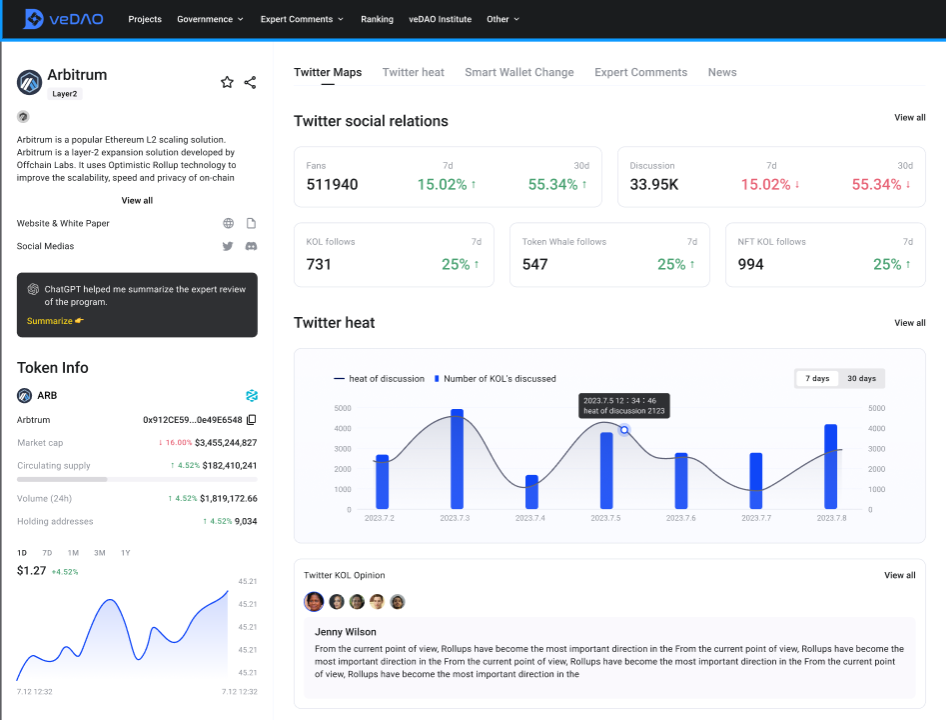
veDAO's upcoming new features also include easy information access through AI interaction, combined with large language models. The Twitter sentiment analysis for specific projects/tokens is more refined and diversified, observing dimensions such as the number of Twitter followers and changes, the number of mentions and changes, the number of KOLs following and changes, the number of whales following and changes, and the number of NFT KOLs following and changes. Utilize data visualization to intuitively and quickly display the frequency and changes, efficiently assisting investors in analyzing token community sentiment. It can also be combined with the Smart Money Signal Tracking feature to adjust investment strategies based on evidence, maximizing the tracking of Alpha projects while minimizing risks.
Related Links: https://vedao.com/
Conclusion
Cryptocurrency sentiment surrounds us every second. By learning to analyze the fluctuations in sentiment, we can seize market opportunities and risks one step ahead. Finding an efficient analysis tool that suits oneself is essential.It can also make investors more accurate in their analysis. There are more and more cryptocurrency data analysis tools available now. In this text, we have selected practical and user-friendly tools to share. We hope that readers can flexibly use these analysis tools to help you better predict and judge the market, and make optimal investment decisions.
Follow Us
veDAO is a decentralized investment and financing platform led by a DAO. It is committed to discovering the most valuable information in the industry and enthusiastic about exploring the underlying logic and cutting-edge tracks of the digital encryption field, so that every role within the organization can fulfill its responsibilities and obtain returns.
Website: http://www.vedao.com/
🔴Investing carries risks. The projects are for reference only. Please bear the risks on your own🔴


