27 key figures of the NFT industry
data source:
data source:Footprint Analytics - Stats About NFTs from 2022
At the beginning of this year, when the cryptocurrency market was booming, it was very difficult to understand the situation of the NFT industry.
With the influx of funds raised, the emergence of new exchange market platforms, and easy money in the space, create the perfect incentive mix for fraudulent activity.
As we now know, through Footprint'sWash Trade Filter, we can find several"OpenSea Killer"False trading activities exist. When you look at the NFT collectibles leaderboard, not everything is as it seems. As the crypto market continues to decline, most NFT trading activities will inevitably enter a low ebb period (both fake and real transactions).
But not all are negative. Some highly innovative NFT portfolios broke the mold of PFP images and proved the existence of a digital, unforgeable art market.
Although in some corners of the industry there has been a proliferation of small collectibles and grassroots community building (e.g. Solana and Magic Eden). At the same time, during this year, we also saw the integration of the industry, and the first major NFT company, Yuga Labs, was born.
secondary title
9 data about the NFT industry
1. The total sales of NFTs in 2022 will be 55.5 billion US dollars
refer to:
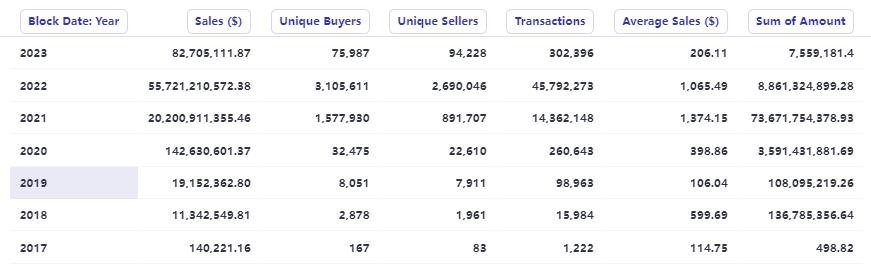
refer to:Yearly Volume of NFT Marketplaces
2. The market value of the NFT industry reached a peak of $41.5 billion on April 4
The calculation method of the market value is the sum of the value of each NFT with the greater of its last transaction price and the reserve price of the collection. Suspected dishwashing transactions have been filtered out.
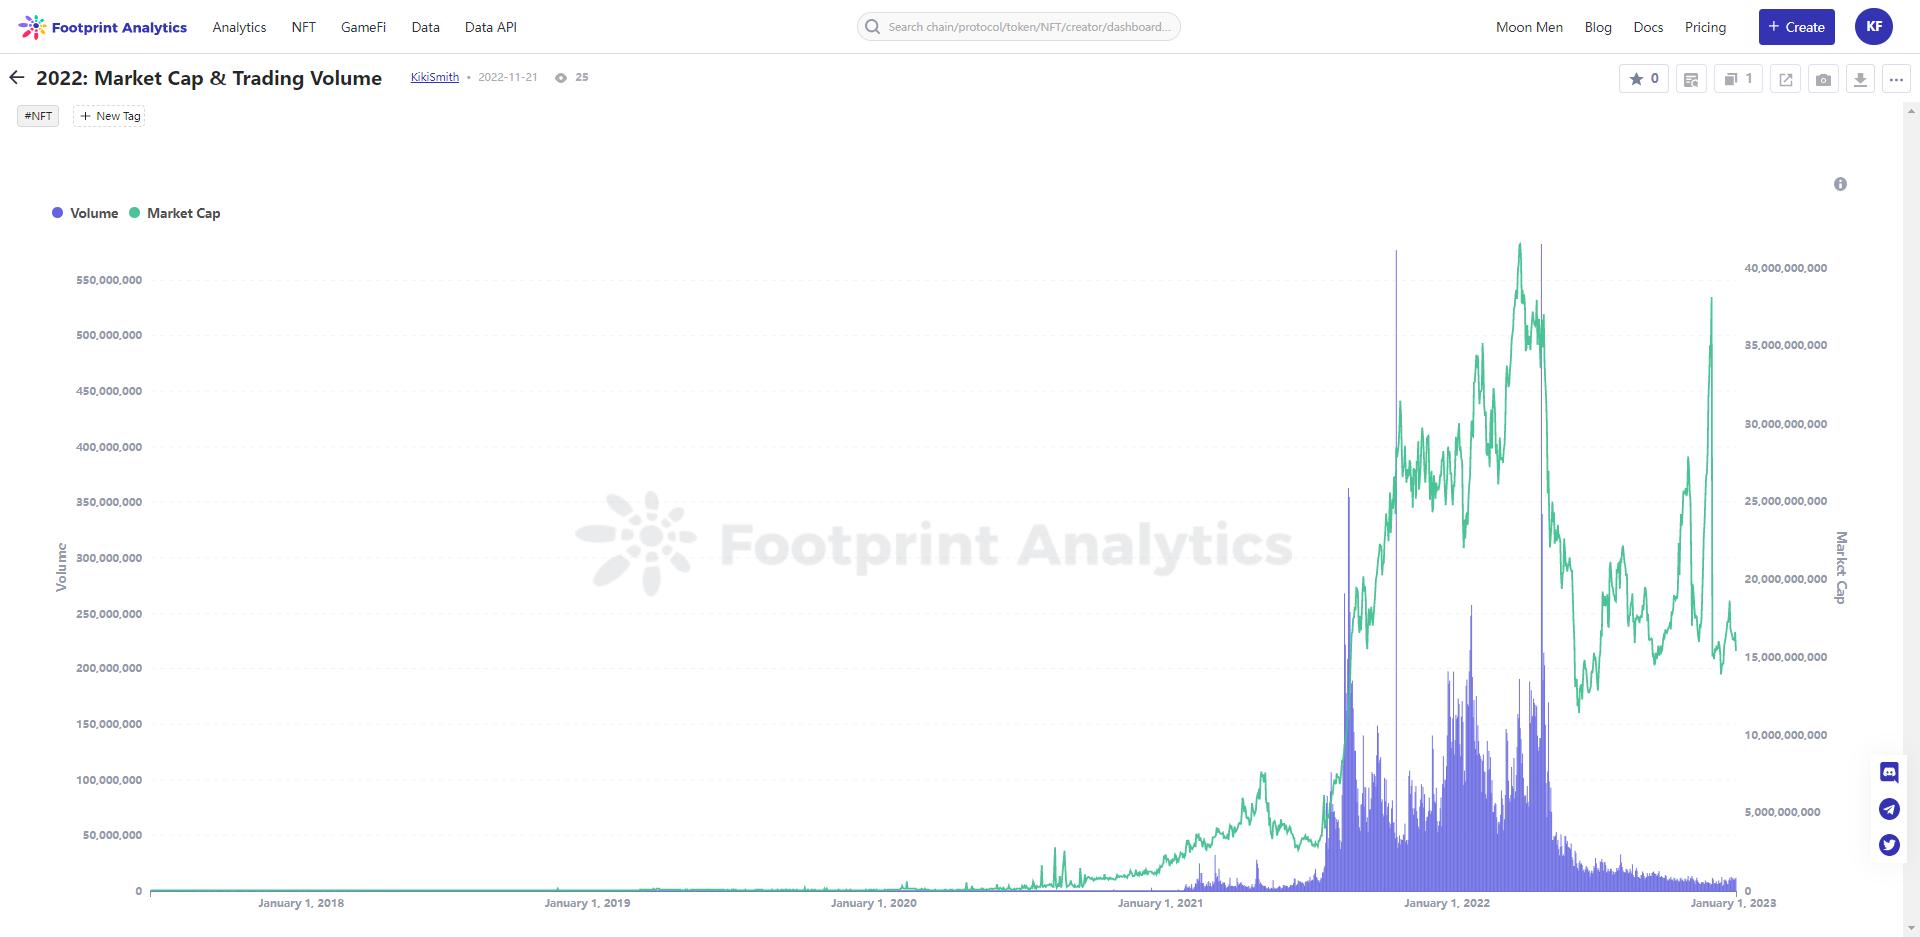
2022 Market Cap and Trading Volume
3. Approximately 85K NFT collectibles were launched last year
In 2021, there are about 145K collections, and by the end of 2022, this number will reach almost 99K.
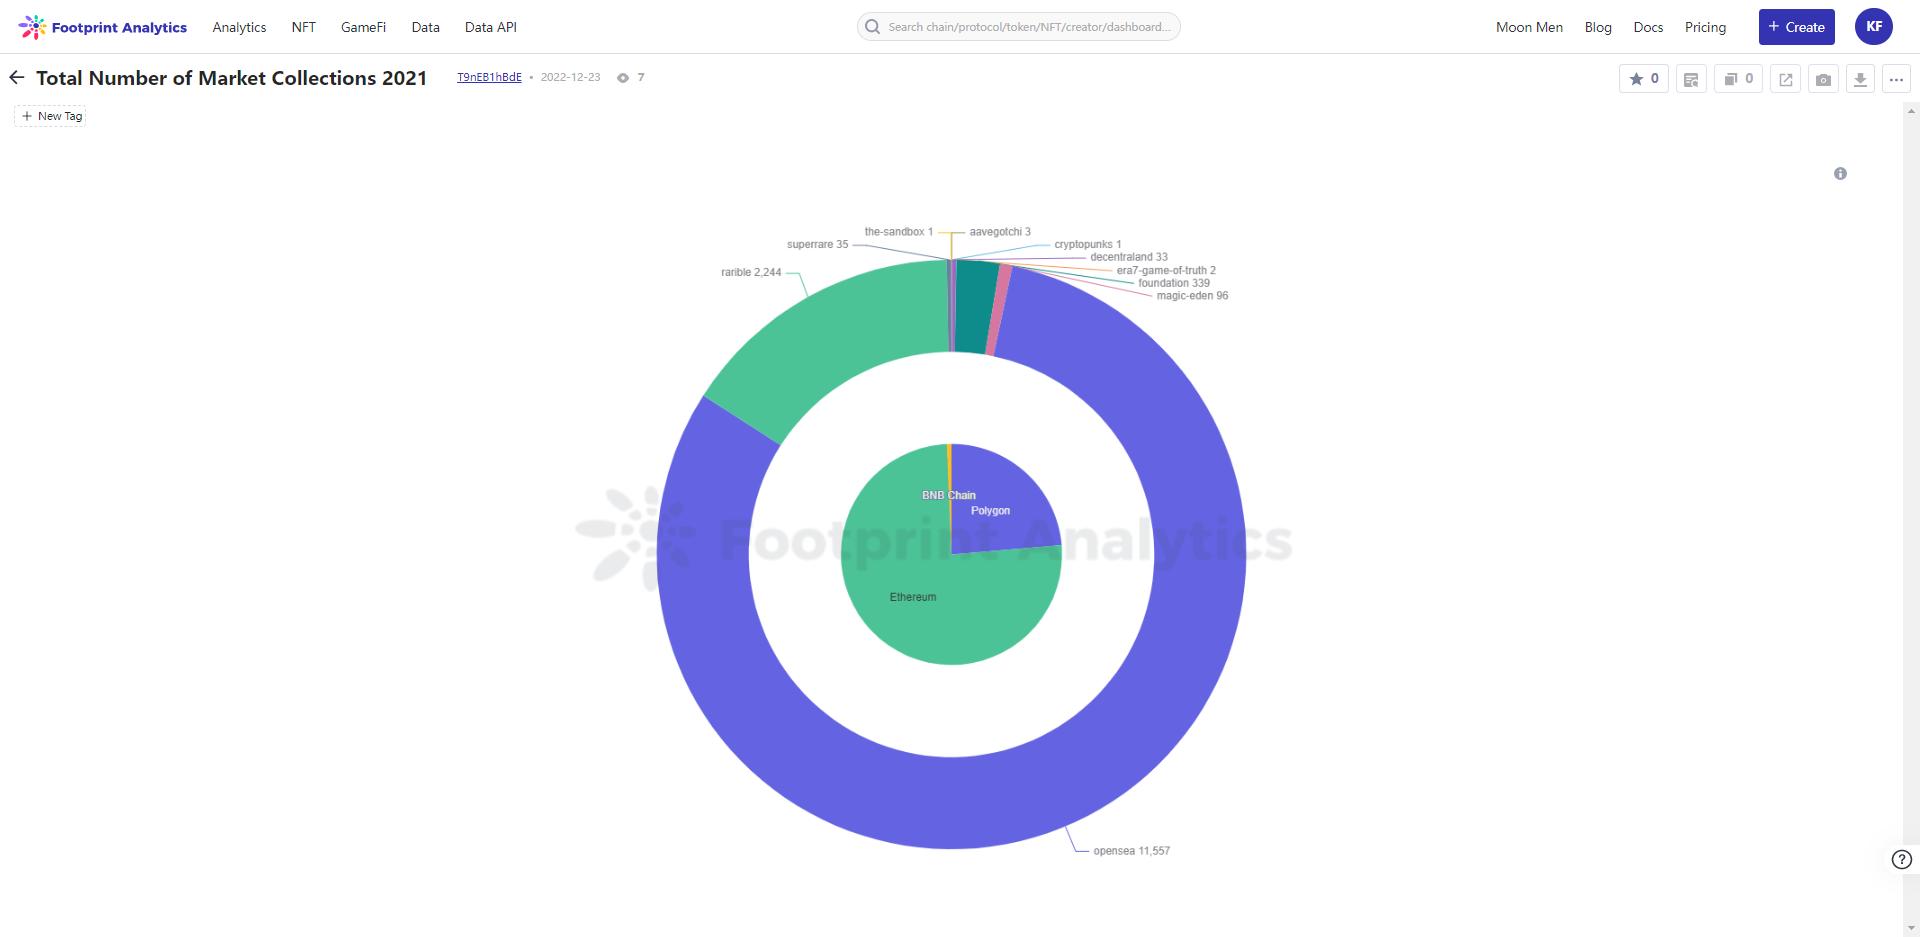
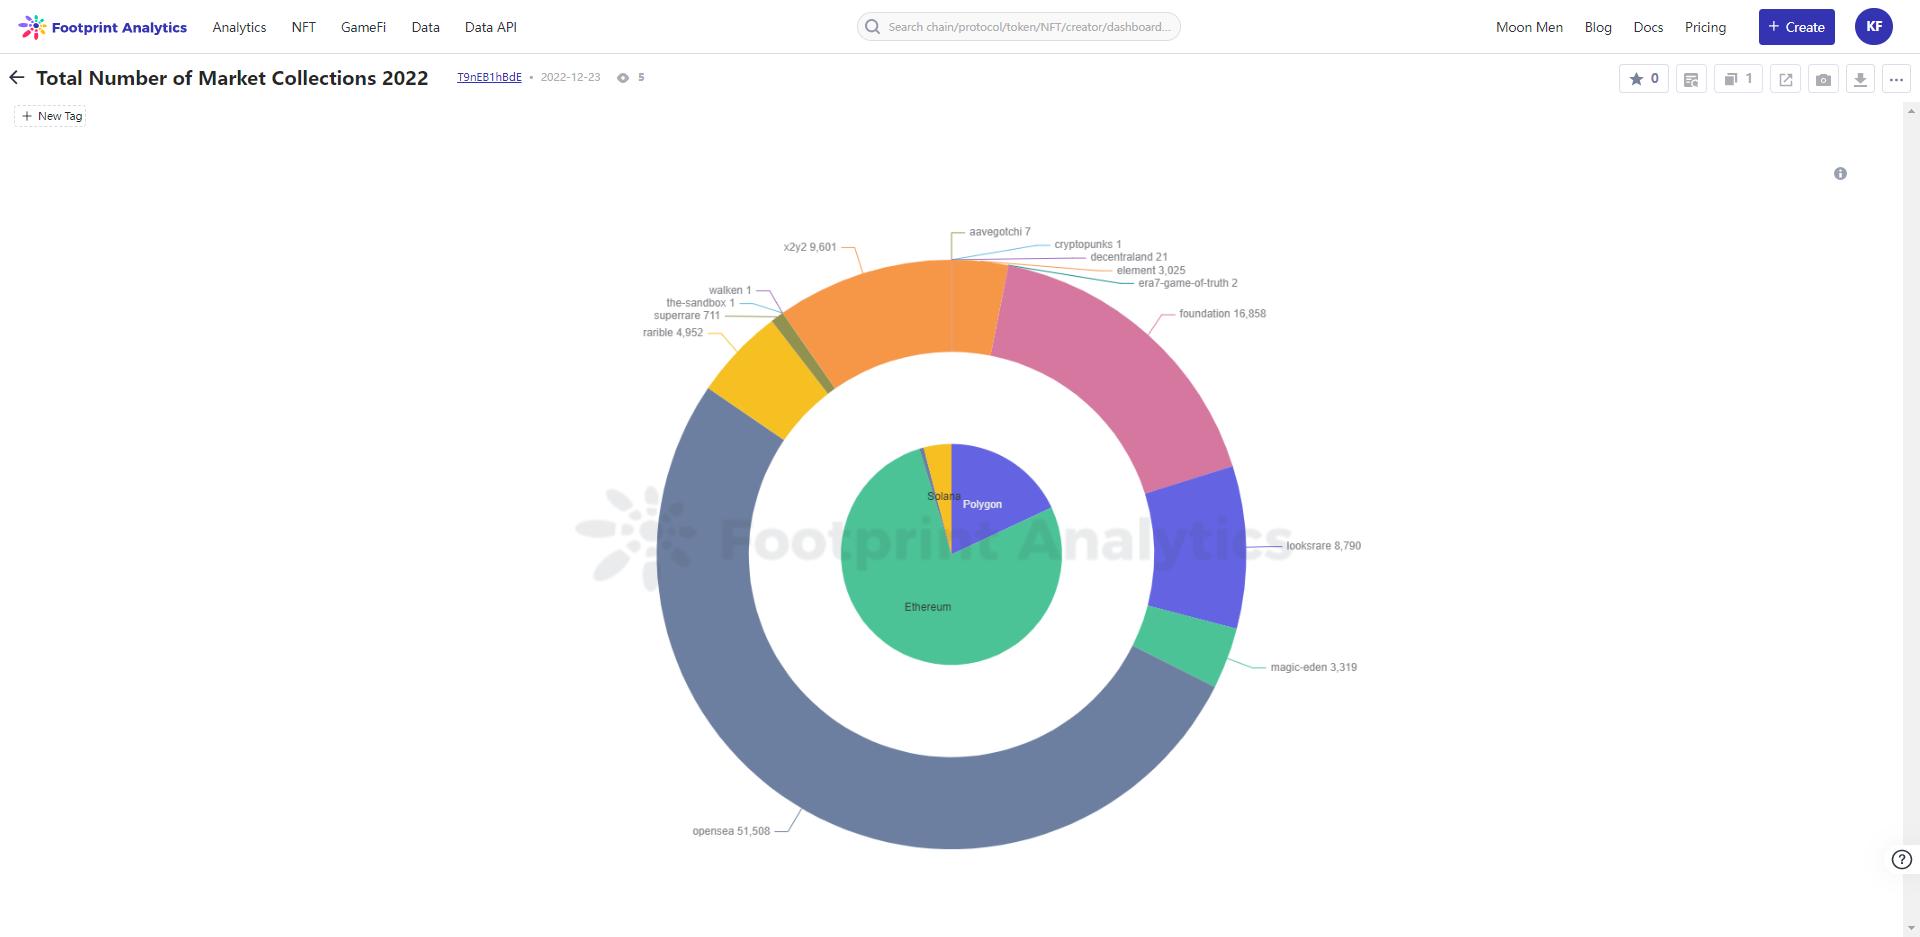
Total Number of Market Collections 2021 vs Total Number of Market Collections 2022
4. About 7,700 collections have traded over $100,000
Note, however, that much of this activity does not come from genuine interest in the project.
5. Only 2,623 collections had more than 1,000 unique buyers
refer to:
refer to:Top Collections 2022
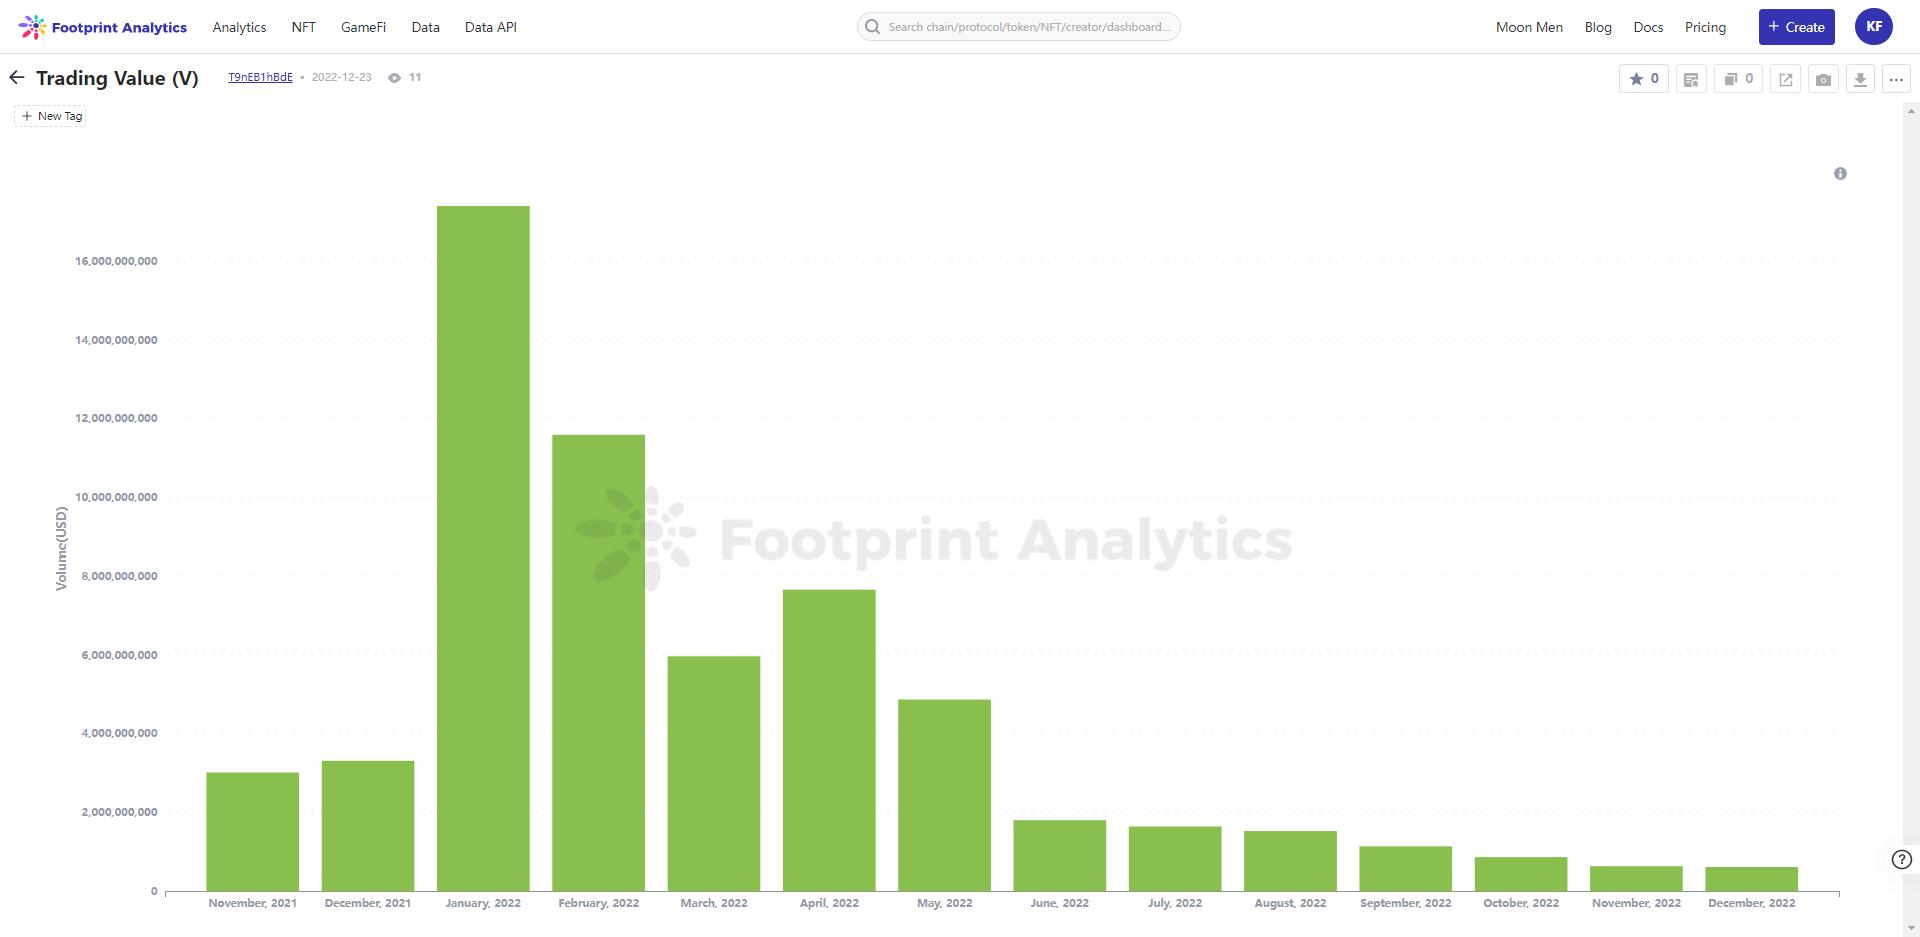
6. NFT transaction volume reached its peak in January in 2022, worth $17.4 billion
This is a jump of more than 4 times from the previous month (December 2021). This is also a google search keyword"NFT "Months with historical peaks.
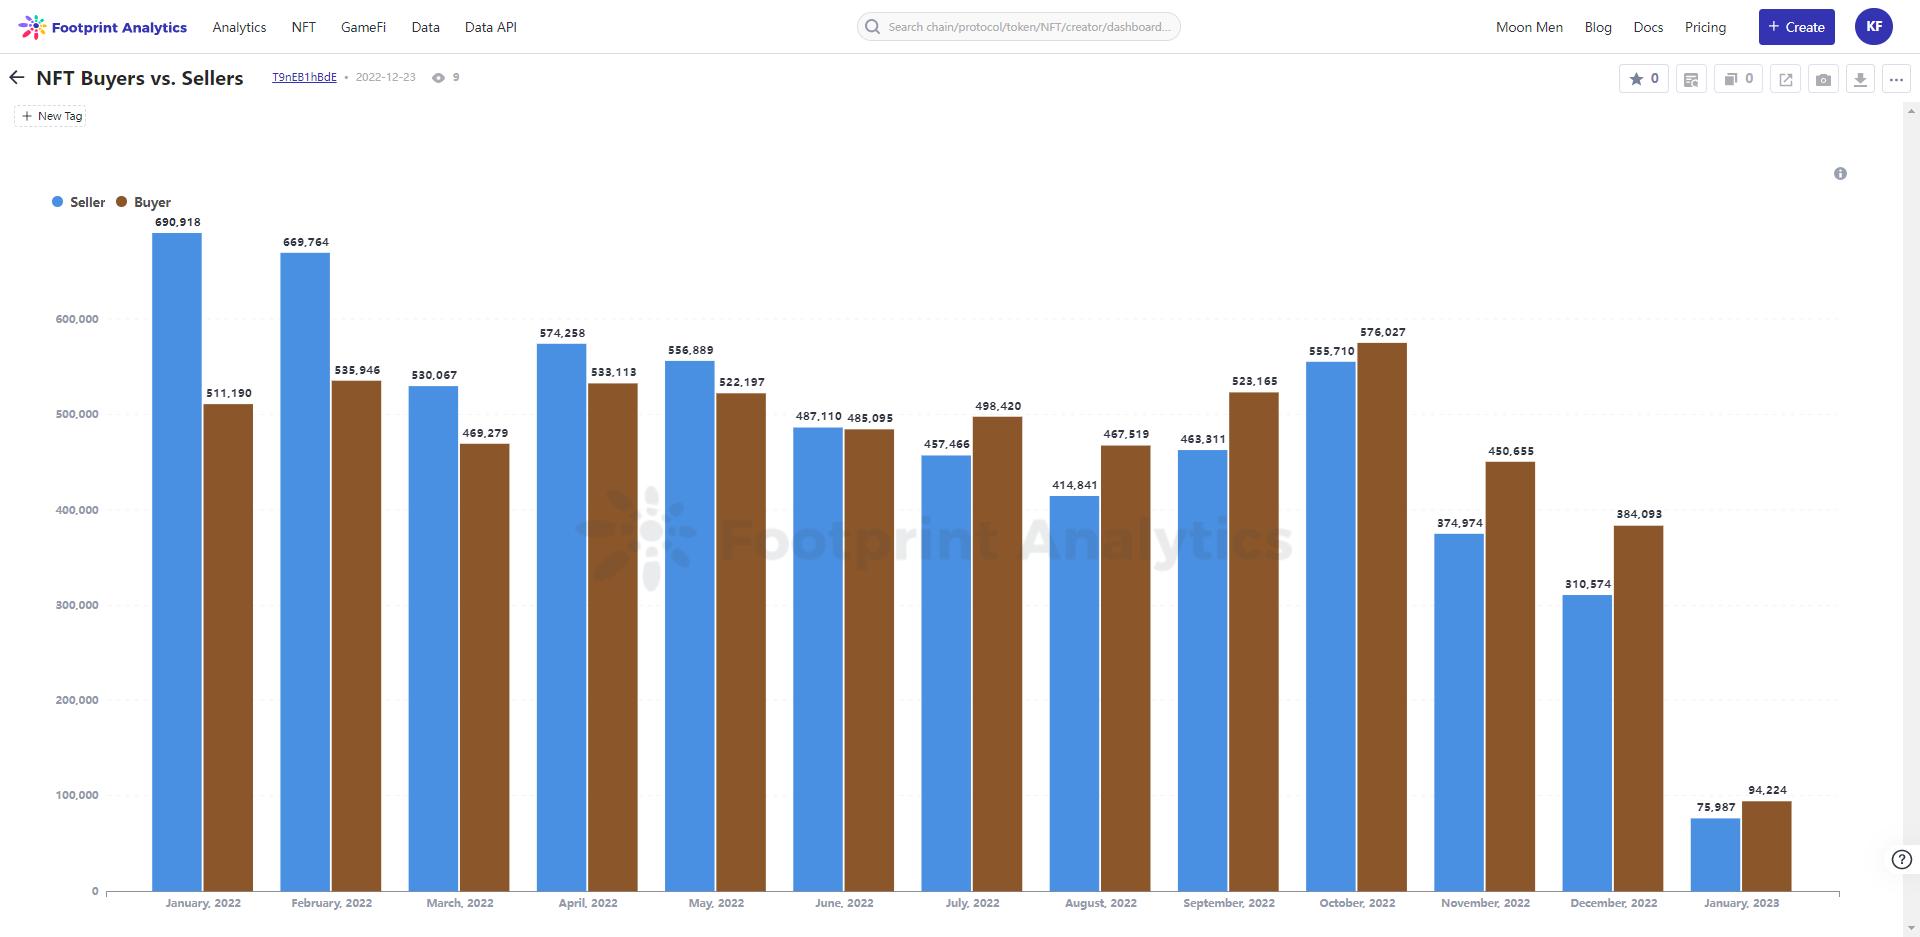
7. The largest gap between the number of sellers and buyers was in January, with about 200,000 more sellers than buyers
However, January was also the hottest month for NFT prices for most major collectibles, showing that using this metric to model supply and demand has its flaws.
8. Last year, 46% of the total NFT transaction volume may have been brought about by wash trading
hereheresecondary title
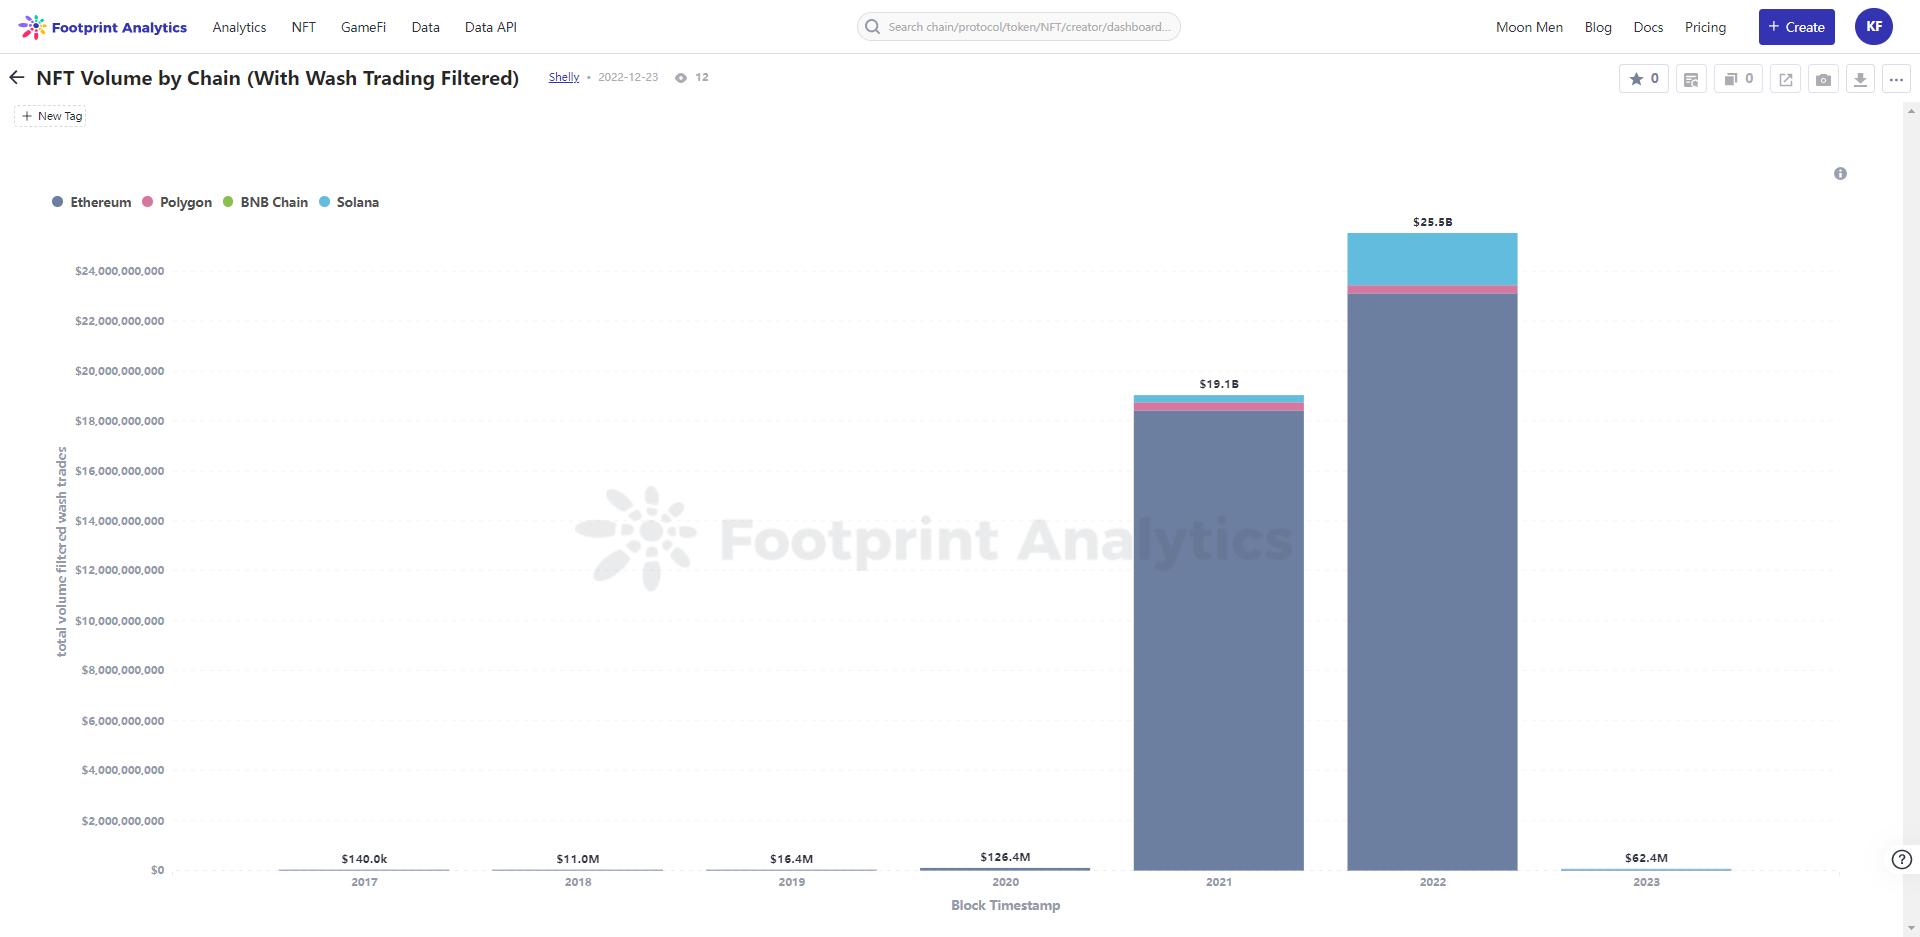
NFT Volume by Chain (With Wash Trading Filtered) vs. NFT Volume By Chain
6 stats about NFT collectibles
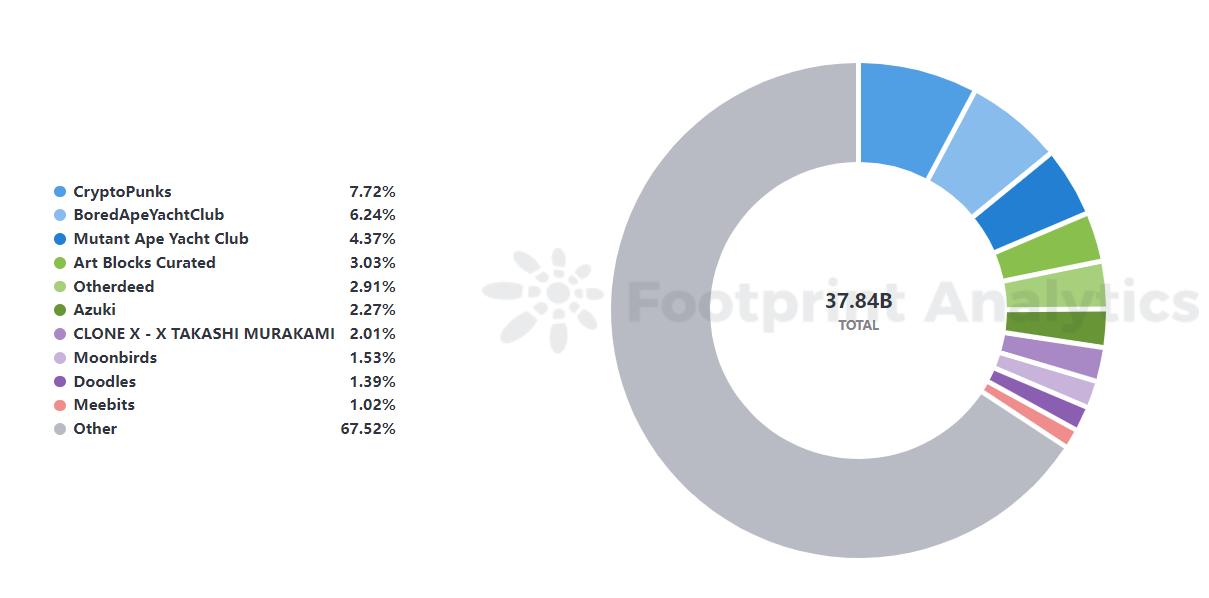
9. By the end of the year, the largest collectible by market value was CryptoPunks at $1.1 billion
Launched by Larva Labs in 2017, Crypto Punks were the first NFT collection to become a household name and boast the highest reserve price in the industry. The series' IP was acquired by Yuga Labs in March 2022.
2022: Top Collections by Market Cap
10. Yugaverse - The main series in Yuga Labs' portfolio has a transaction volume of $3.1 billion
That number includes Bored Ape Yacht Club, Mutant Ape Yacht Club, Bored Ape Kennel Club, Otherside, and CryptoPunks. But that doesn't include Meebits, which trades more than all those products combined.
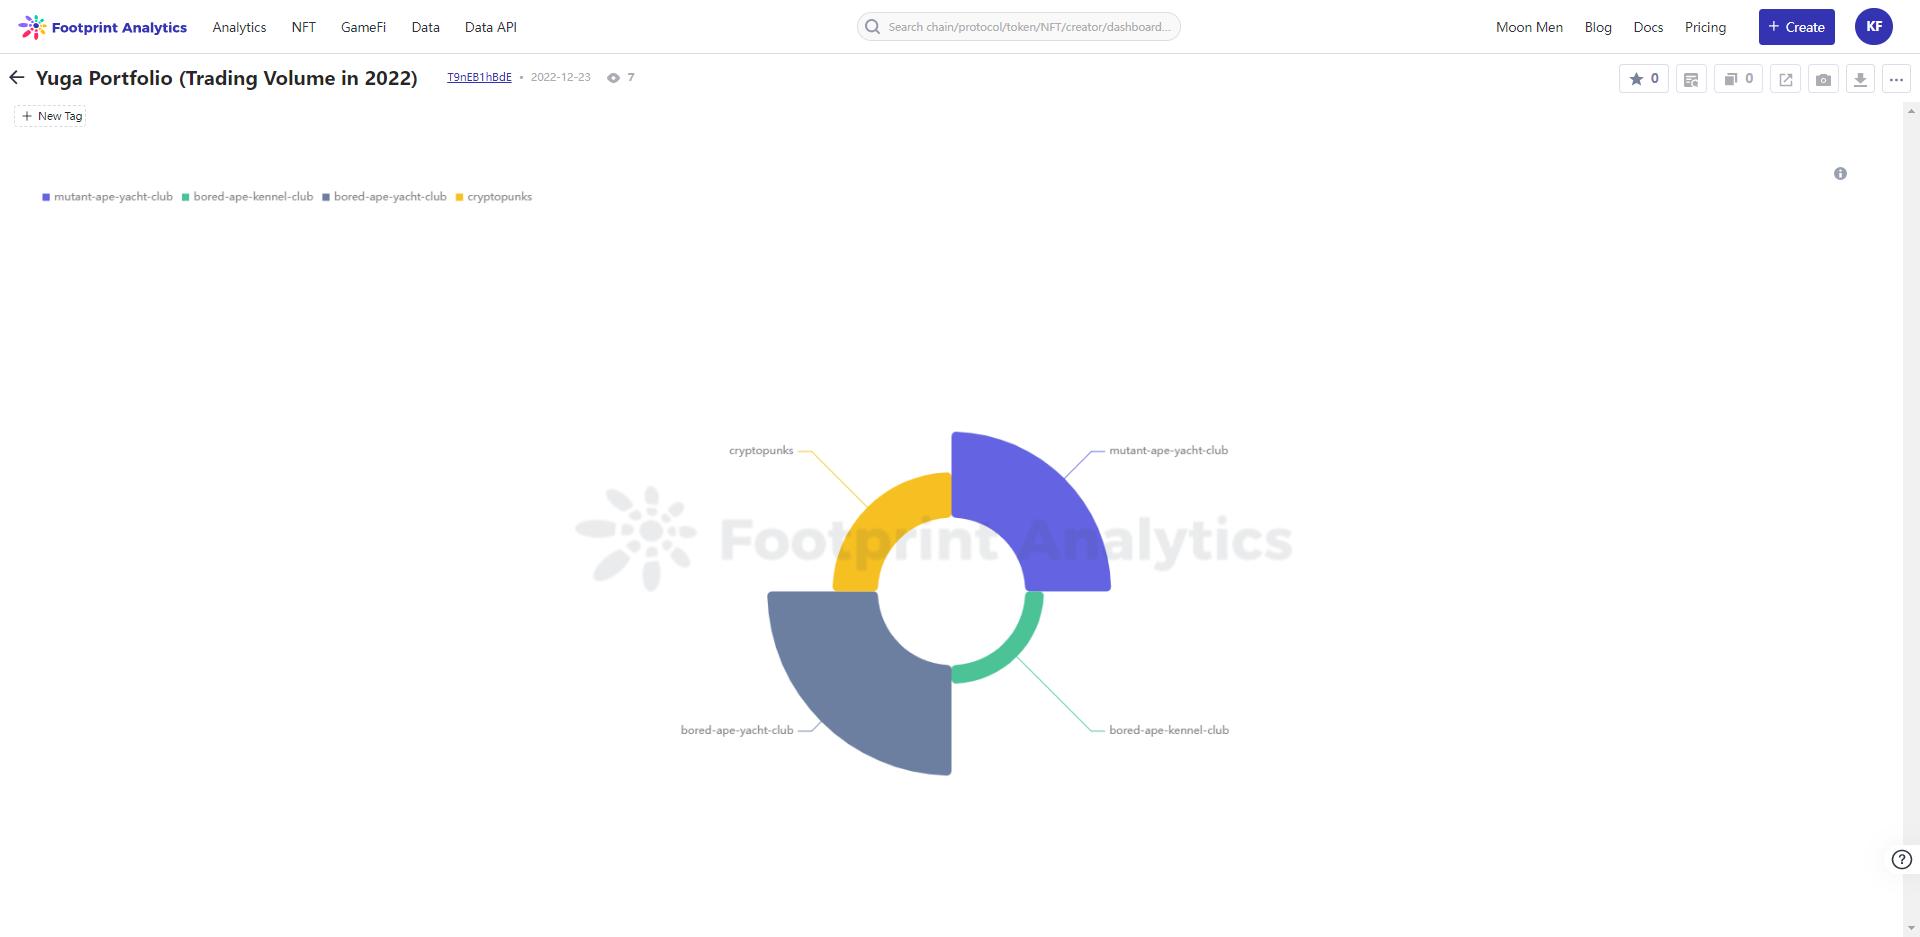
Yuga Labs (Trading Volume in 2022)
11. Yuga Labs' investment portfolio accounts for about 20% of the total market value of the entire NFT industry.
This sum includes Bored Ape Yacht Club, Mutant Ape Yacht Club, Bored Ape Kennel Club, Otherside, CryptoPunks and Meebits.
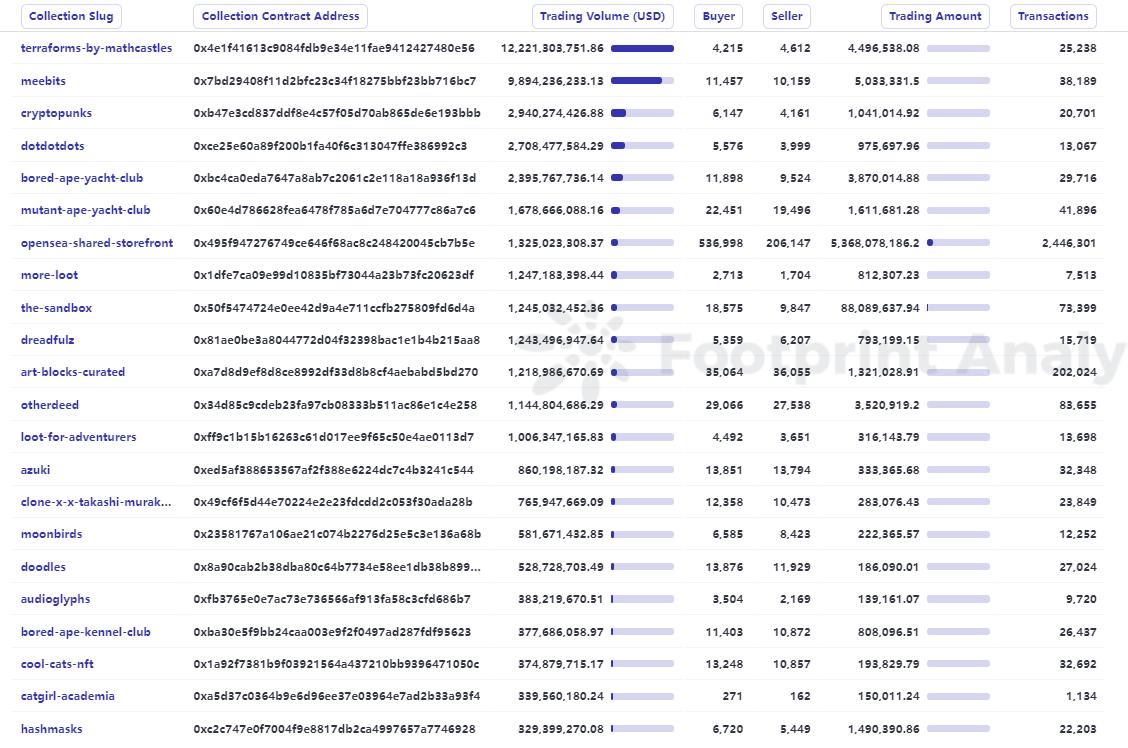
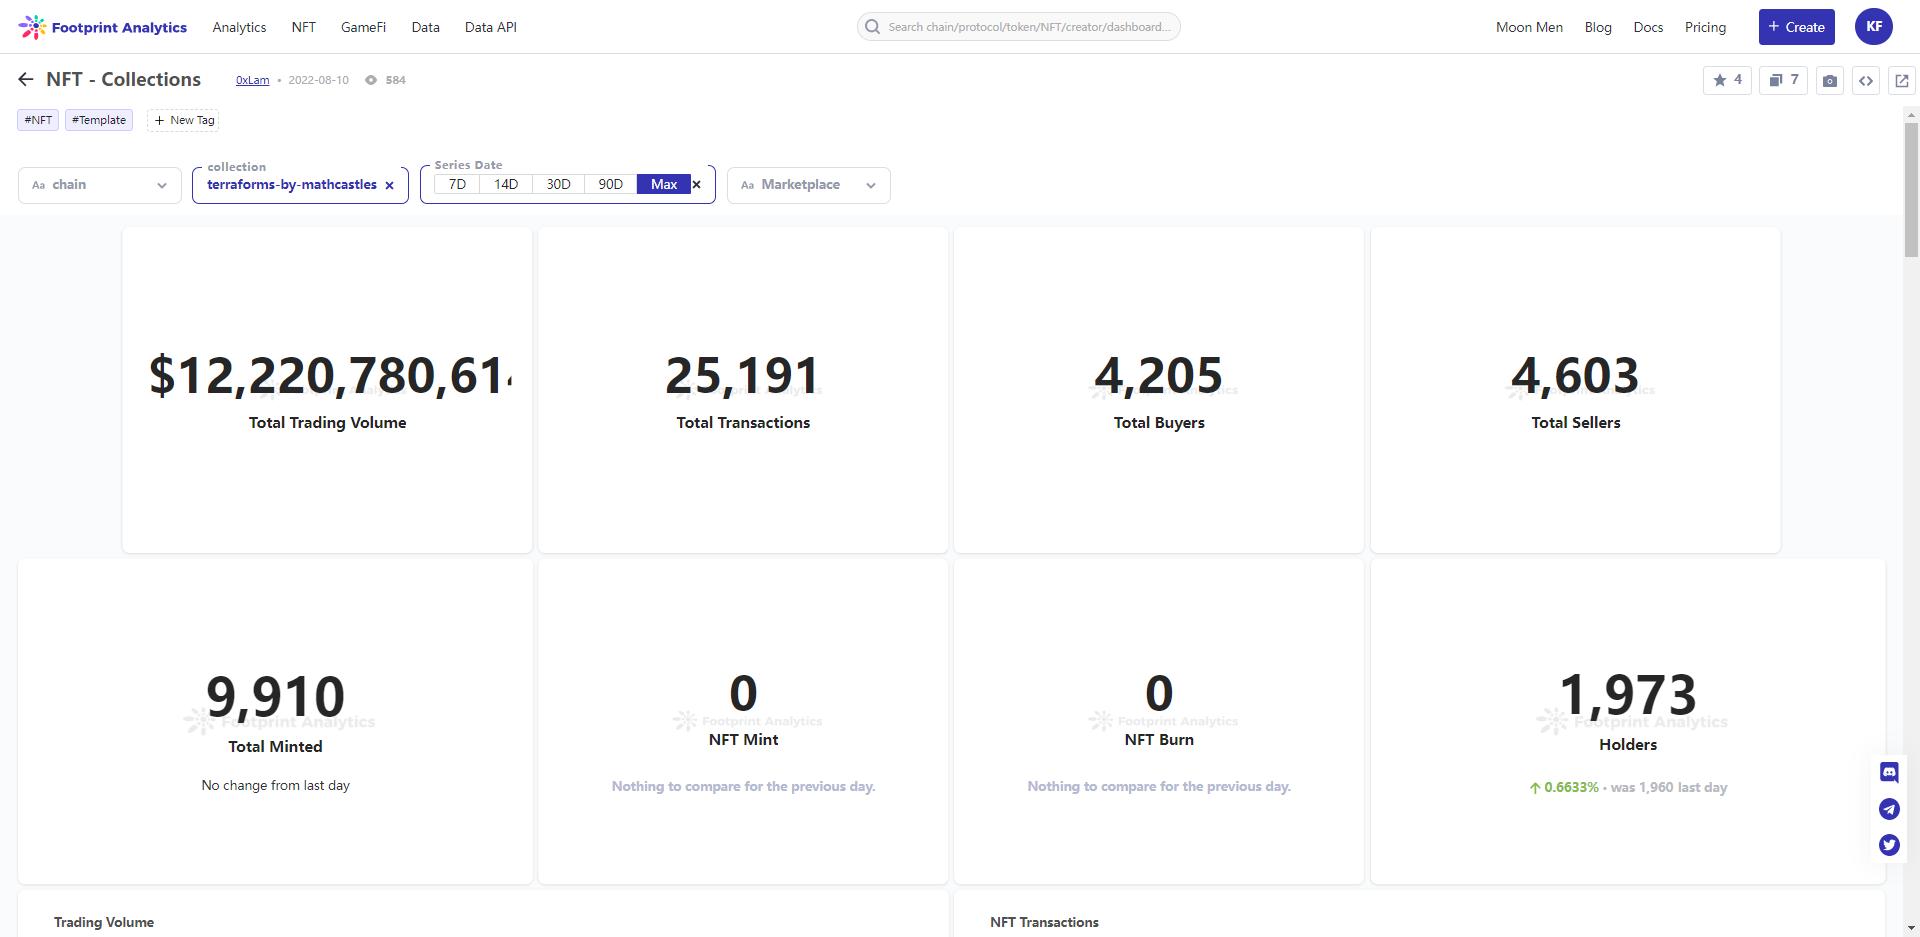
12. Without any wash trade filtering, Mathcastles’ Terraforms had a staggering $12 billion in trade volume, more than any other collection, with 11,341 trades
However, 99.8% of volume and 46.3% of trades were found to be wash trades.
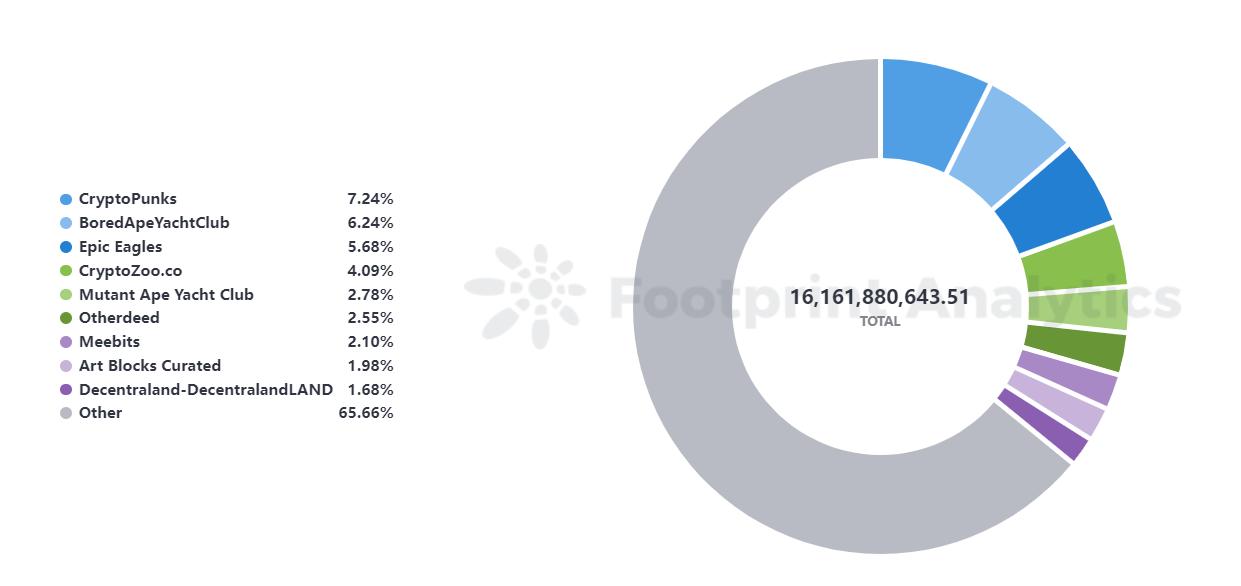
13. When filtering out wash trades, CryptoPunks had the highest trading volume ($2.9 billion), followed by Bored Ape Yacht Club ($2.3 billion)
2022: Top Collections by volume
14. ArtBlocks Curated is the fourth most traded collectible, amassing a $325 million market cap
ArtBlocks is proof that there's a market for high-end art NFTs - it topped the charts with Yuga PFP projects and veteran land NFTs.
15. There are 7 major collectibles whose transaction volume exceeds 95% of wash transactions
In this statistic,"main"secondary title
Public chain and trading market data related to 6 NFT projects
16. Ethereum accounts for 95% of transaction volume, 47% of transactions, and 71% of agreements
Those numbers are almost exactly the same as in 2021.
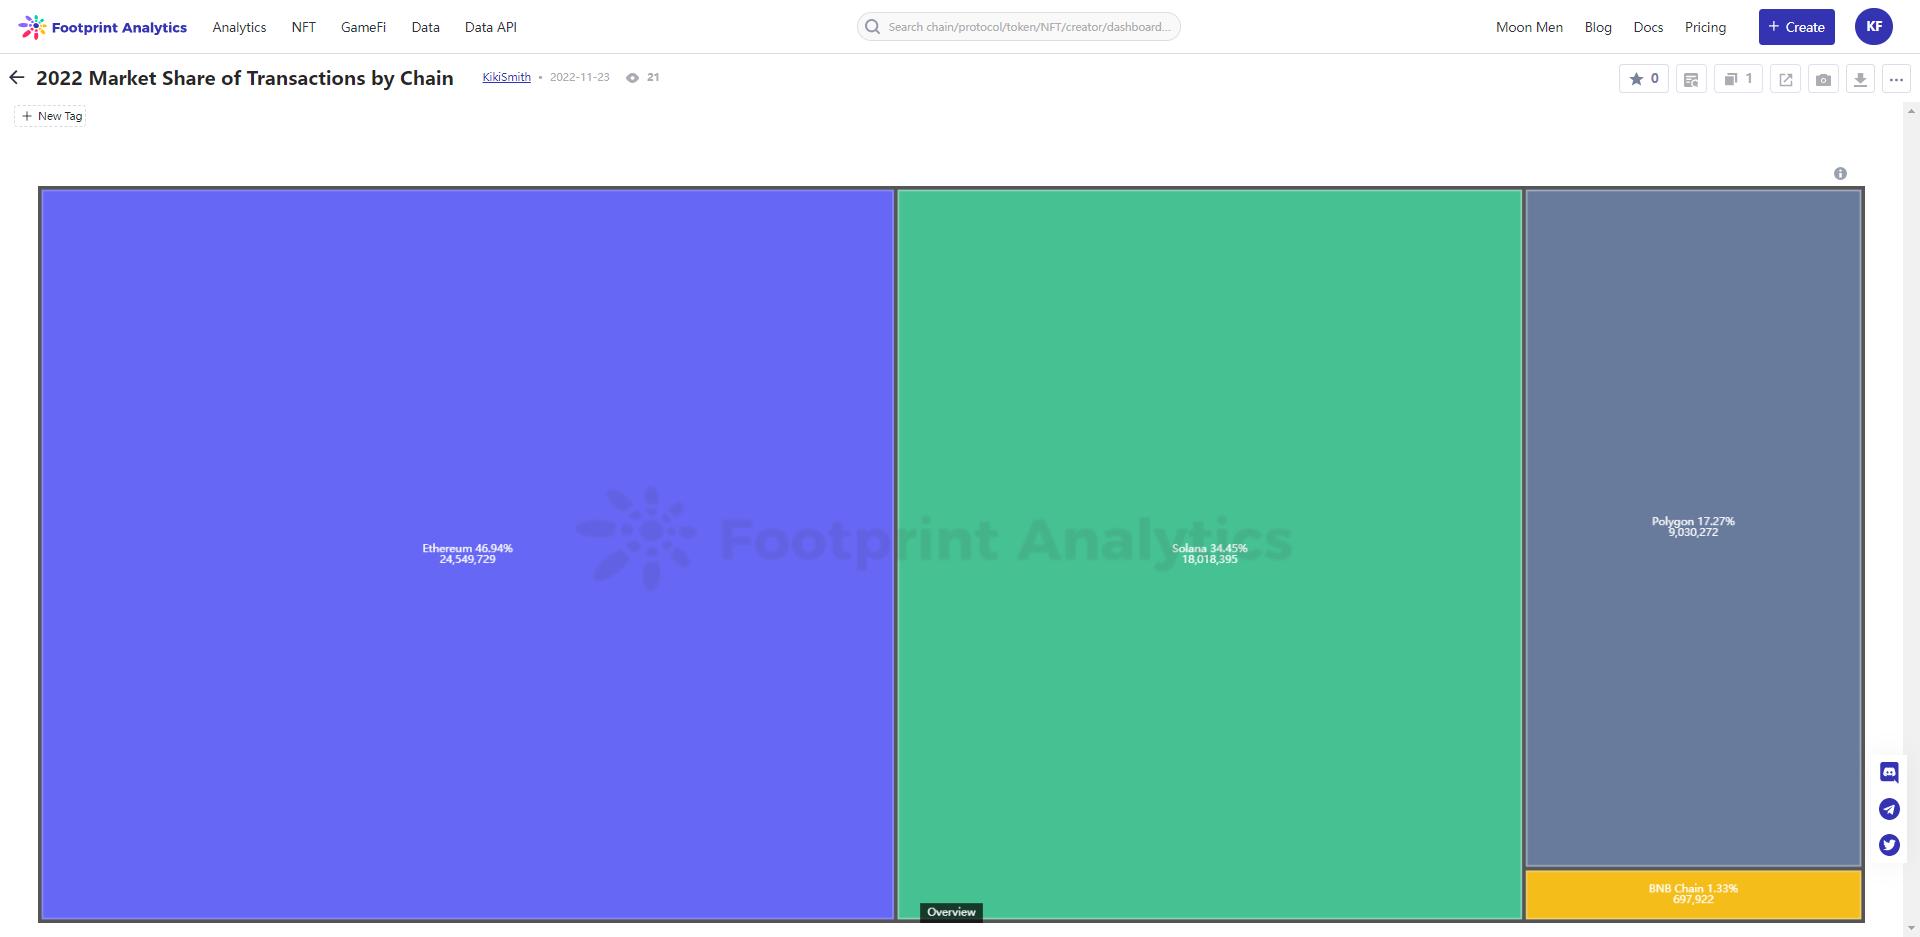
2022 Market Share of Transactions by Chain
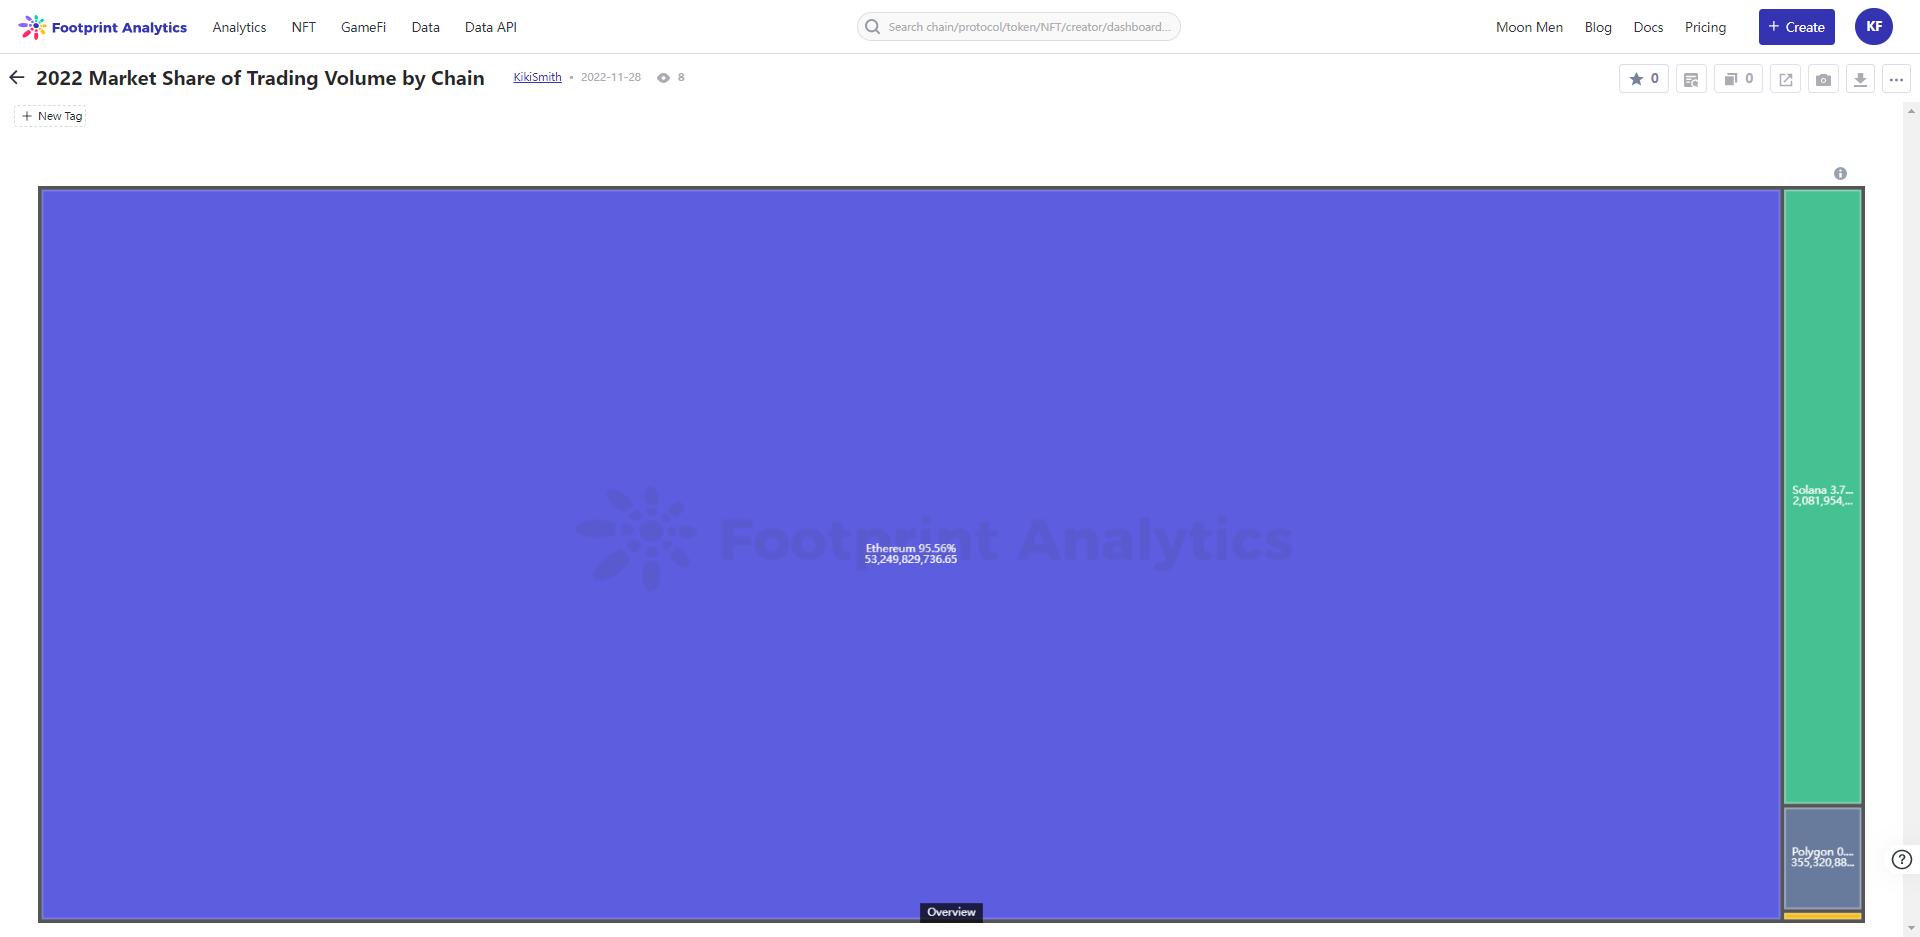
2022 Market Share of Trading Volume by Chain
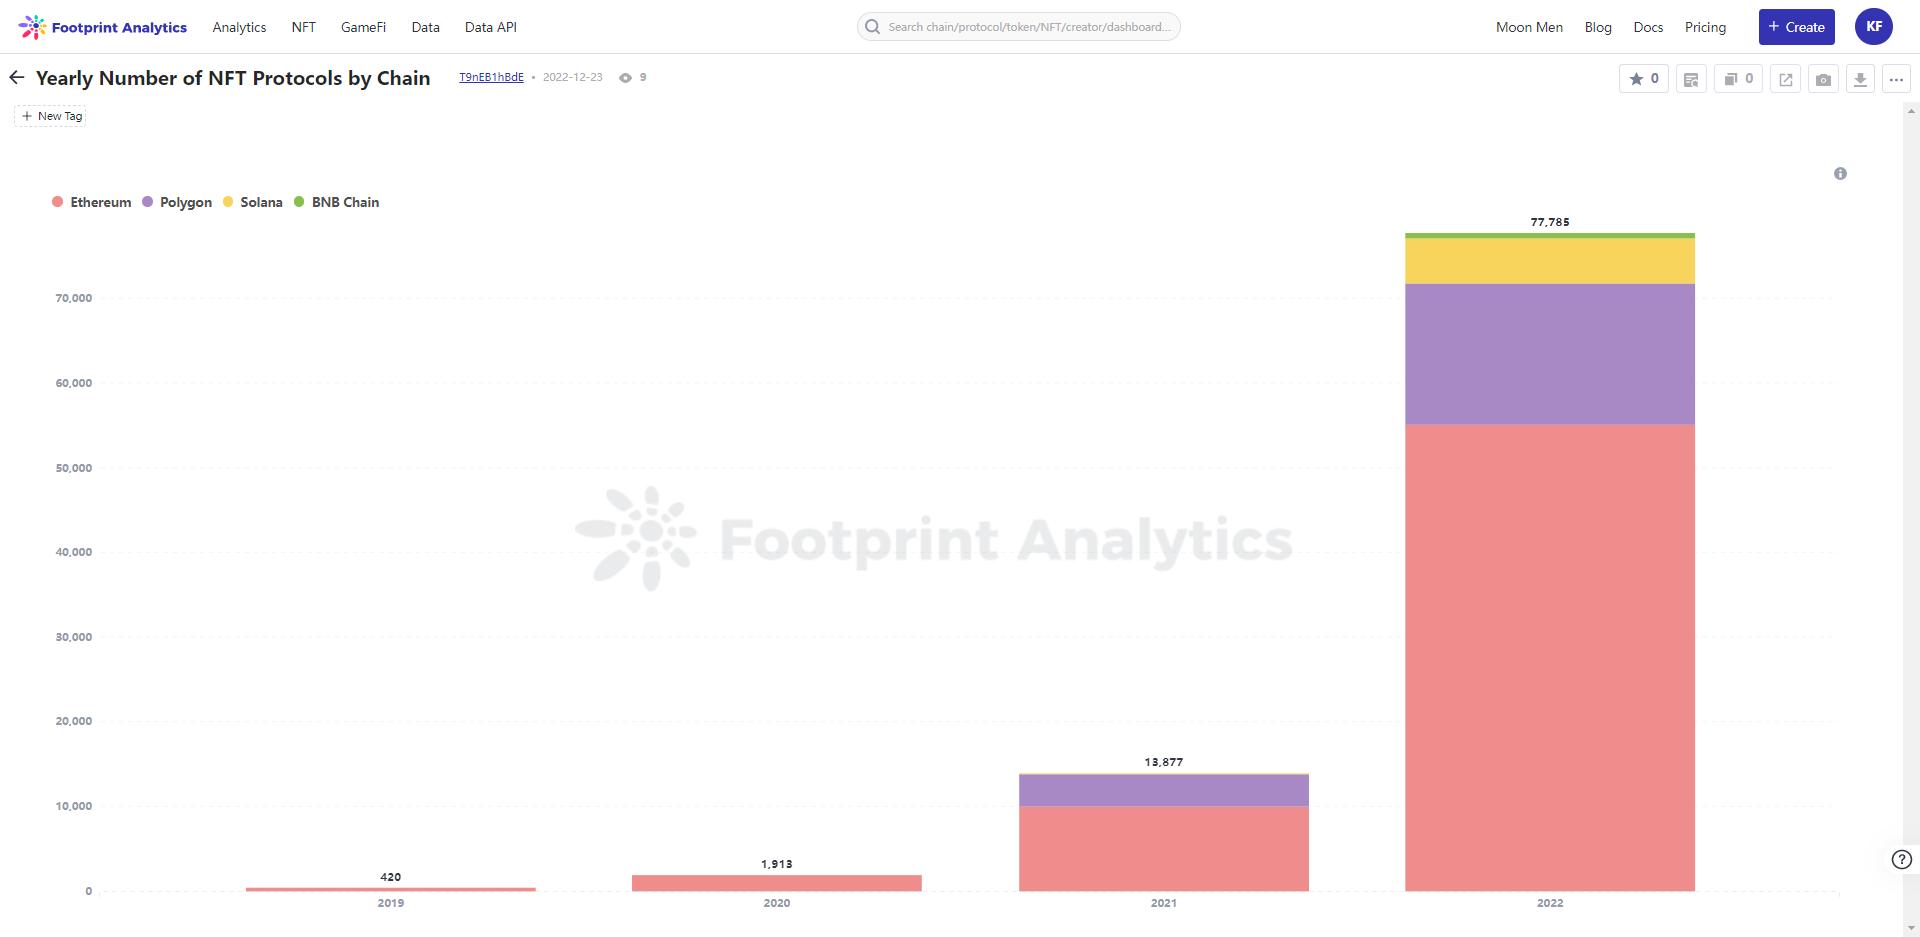
Yearly Number of NFT Protocols by Chain
refer to:
refer to:Yearly Number of NFT Protocols by Chain
18. The market share of collectibles on OpenSea accounts for 53%
OpenSea remains the market of choice for Ethereum and Polygon. However, Magic Eden leveraged its Solana first-mover advantage to become the go-to marketplace for on-chain collectibles (OpenSea began listing them in April).
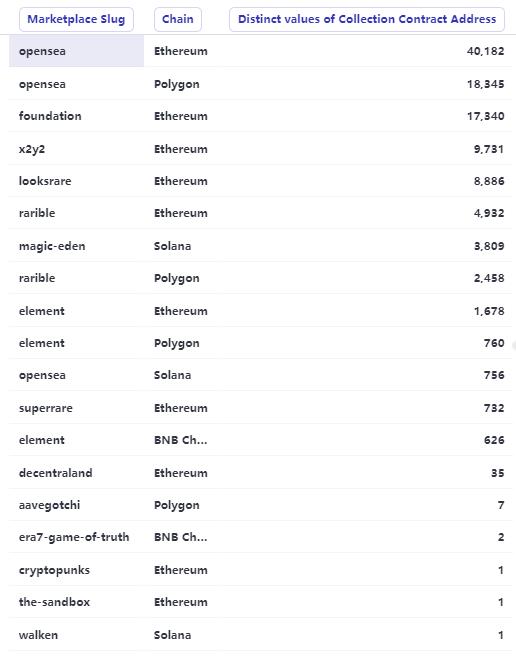
2022: Number of Marketplace Collections by Chain
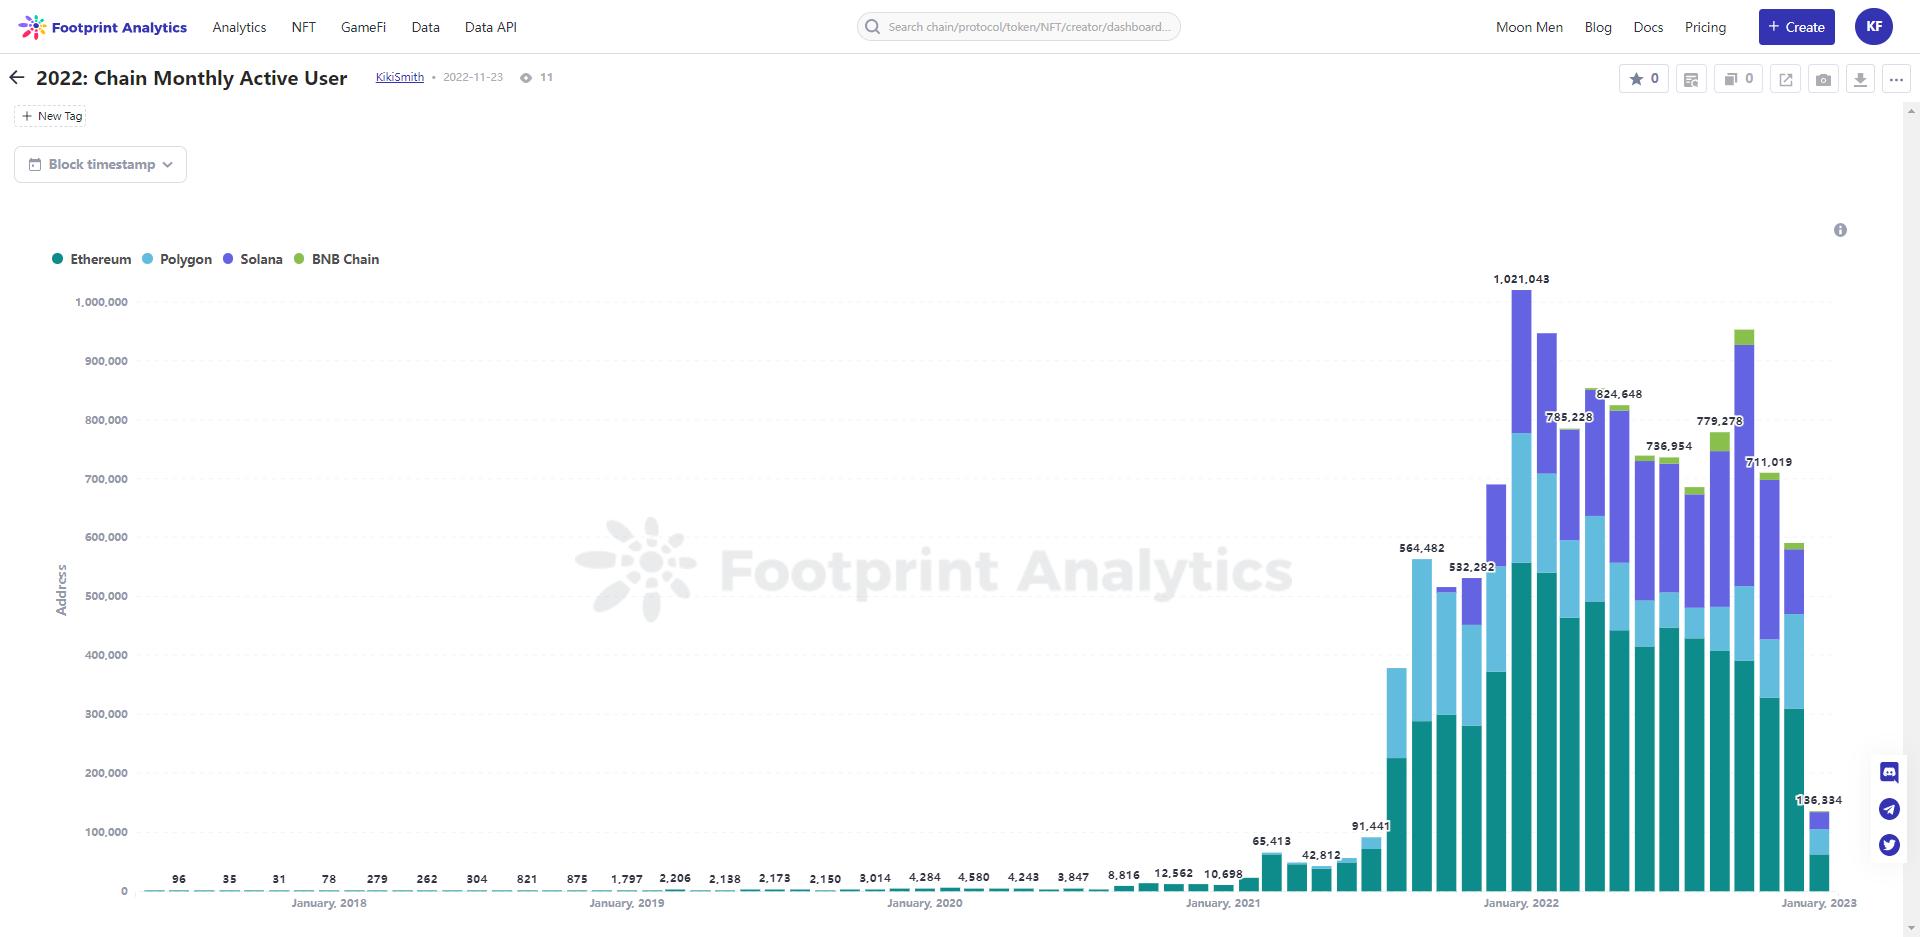
19. The number of active users of Solana in October was 411K, more than the 392K of Ethereum
While most blue-chip collectibles and collectors trade on OpenSea and Ethereum, Solana has built a sizable community of NFT enthusiasts in 2022. Solana’s active users hover between 20-45% of the total market share — October was the only month it surpassed Ethereum on this metric.
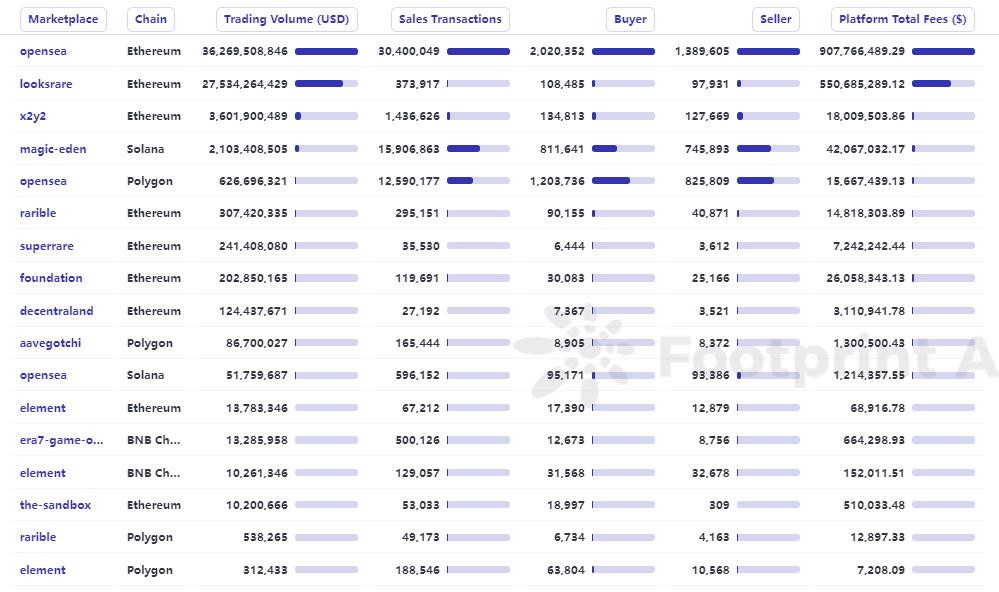
20. On February 2, 96,459 unique wallet addresses on OpenSea transacted on the protocol
That's more volume than any other market trades on any given day.

2022 Marketplace Daily Active User
21. Over $903 million in platform fees were generated on OpenSea
secondary title
6 data about NFT investment and financing
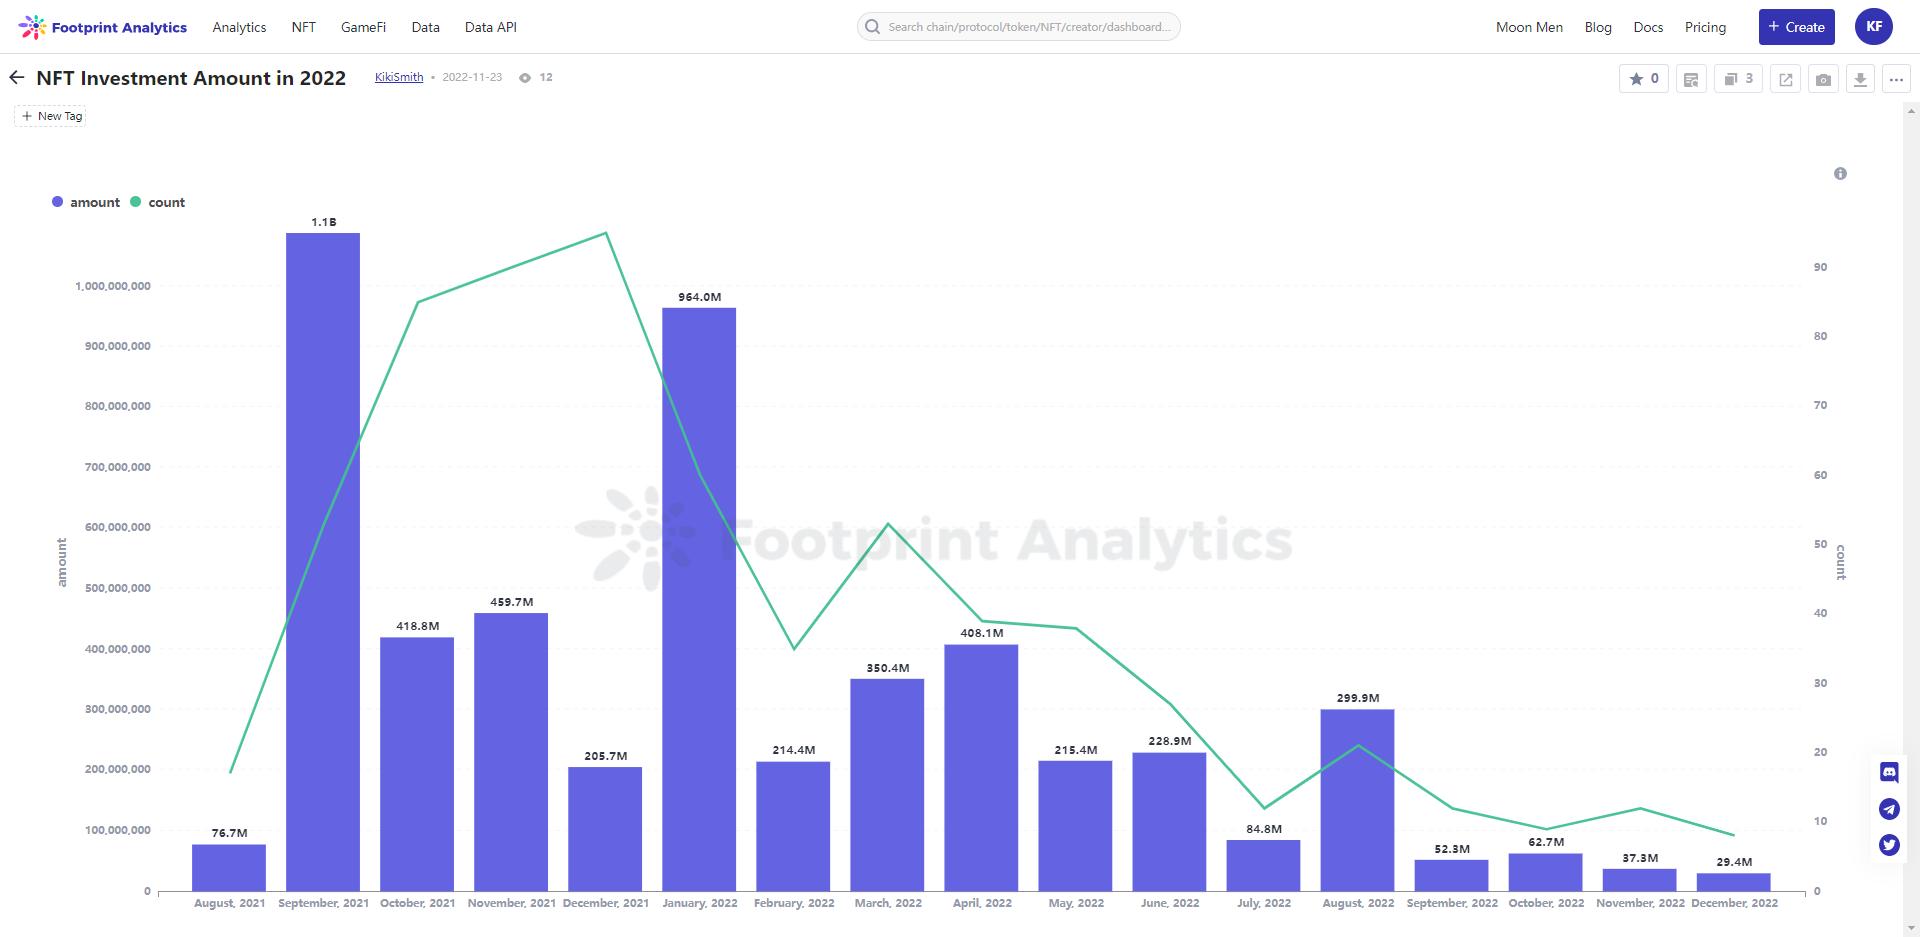
22. In 2022, the NFT industry will receive a total of $2.98 billion in funding
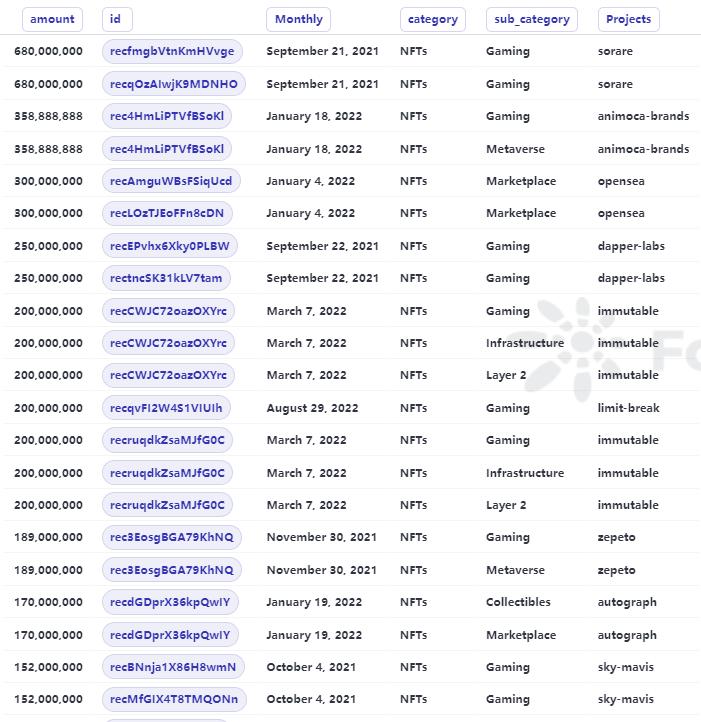
23. Animoca Brands raised its largest funding round of the year, $358 million led by Liberty City Ventures
Animoca said it will use the funds for strategic acquisitions, investments, development of its games and Metaverse products, and licensing of popular intellectual property.
24. There will be 1,992 fundraising rounds in 2022, 756 more than in 2021
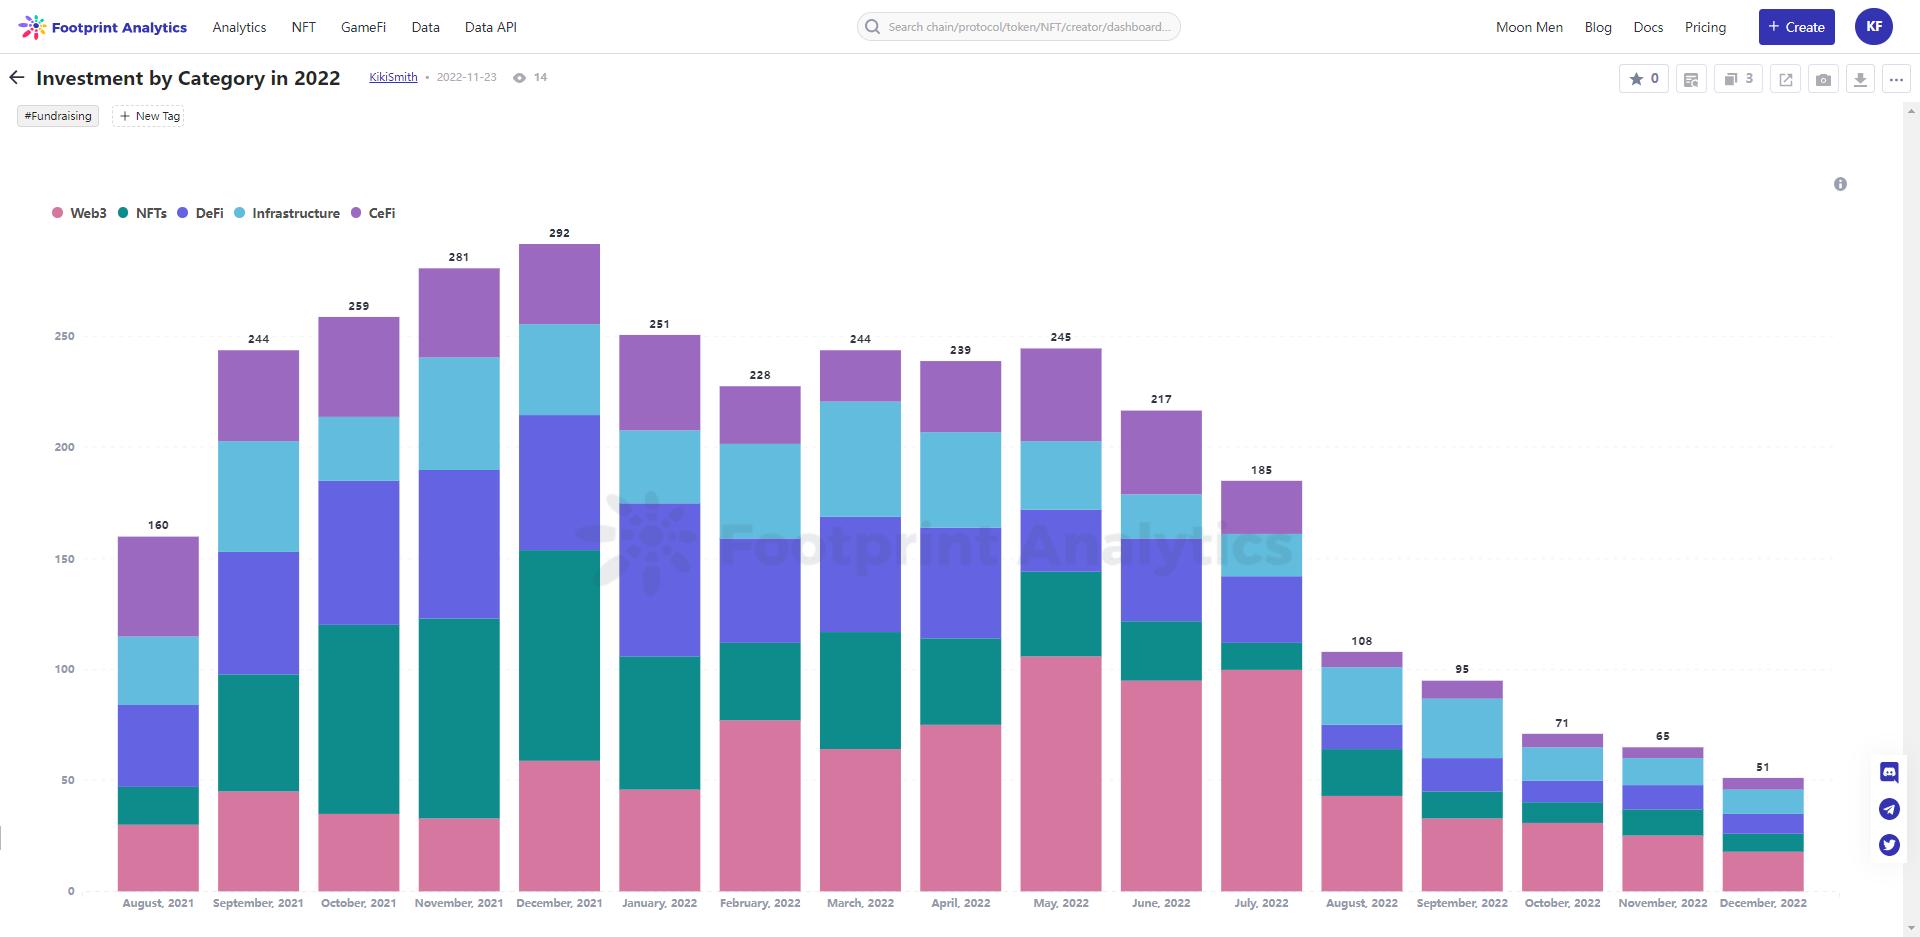
Investment by Category in 2022
While NFT-related projects are the most popular category for VCs across all rounds, they will be the second-to-last for funding rounds in 2022
refer to:
refer to:Investment by Category in 2022
Seed rounds account for 81% of total NFT funding
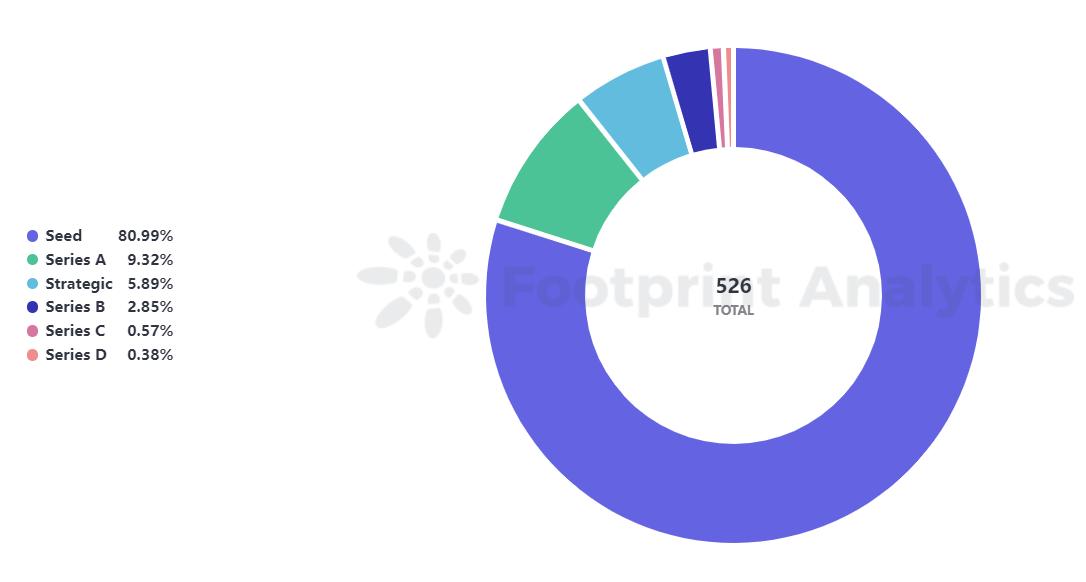
The two largest funding rounds for pure NFT projects were OpenSea ($300 million) and Dapper Labs ($250 million).
The Footprint Community is a global, mutually supportive data community where members leverage data visualizations to co-create communicable insights. In the Footprint community, you can get help, establish links, and exchange learning and research about blockchains such as Web 3, Metaverse, GameFi, and DeFi. Many active, diverse, and highly engaged members inspire and support each other through the community, and a worldwide user base is built to contribute data, share insights, and drive the community forward.
This article comes fromFootprint Analyticscommunity contribution.
The Footprint Community is a global, mutually supportive data community where members leverage data visualizations to co-create communicable insights. In the Footprint community, you can get help, establish links, and exchange learning and research about blockchains such as Web 3, Metaverse, GameFi, and DeFi. Many active, diverse, and highly engaged members inspire and support each other through the community, and a worldwide user base is built to contribute data, share insights, and drive the community forward.
Footprint Website: https://www.footprint.network
Discord: https://discord.gg/3 HYaR 6 USM 7
Twitter: https://twitter.com/Footprint_Data