
Inventory of 8 non-EVM public chains: Solana is far ahead in the number of daily transactions, and EOS DAU has recently increased significantly
As the "foundation" of the blockchain industry, the public chain has always attracted much attention. After DeFi Summer, Ethereum has firmly occupied the top spot of the public chain by virtue of its ecological advantages. This prompts other public chains to either choose to move closer to Ethereum and be compatible with the technical environment of Ethereum, and become an EVM public chain; or choose to fight alone, stick to their own technical framework, and become a non-EVM public chain; A technical environment, unified through the form of internal cross-chain.
In general, over the past period of time, Ethereum and EVM public chains have become mainstream. However, with the high fees of Ethereum and the expected time-consuming expansion, as well as the development of public chains such as Cardano, Solana, and Atpos, non-EVM public chains have begun to occupy people's attention.
As the competition for public chains intensifies, PANews’ data news column PAData has taken stock of eight non-EVM public chains: Solana, NEAR, Acala (the DeFi public chain on Polkadot), Tron, Cardano, Algorand, Neo, and EOS On the data, the analysis found that:
In the past three months, Solana has had the most daily on-chain transactions, reaching 30.1266 million, an order of magnitude more than other non-EVM chains. Moreover, Solana's daily average on-chain transactions have also increased by 141.15%, showing a significant upward trend. On the other hand, Acala, Algorand, Cardano, and NEAR saw an overall decline in the number of daily on-chain transactions.
In the past three months, Cardano has the highest cumulative transaction fee, about $1.3414 million, much more than other public chains, followed by Solana and NEAR. The cumulative transaction fees of Neo and Acala are both less than $10,000.
In the past three months, Tron has the largest number of daily active addresses, reaching 2.9008 million, followed by Solana, reaching 945,200. But in terms of growth rate, only EOS and Tron showed a growth trend, especially EOS, whose daily active addresses rose by 93.95%.
At present, Tron has the highest lock-up amount in DeFi, reaching 5.901 billion US dollars, followed by Solana, reaching 2.543 billion US dollars. The current lock-up volume of the remaining 6 public chains does not exceed US$500 million, and Cardano and Neo do not even exceed US$100 million. In terms of the number of agreements and locked positions, Solana has the best ecological development among them.
first level title
01
text
The number of transactions on the chain is a basic indicator used to observe the activity of a public chain. The more transactions, the more times the public chain is used, and the higher the probability that the public chain will be welcomed by users and the market. According to statistics, in the last three months, Solana had the most daily on-chain transactions, reaching 30,126,600, an order of magnitude more than other non-EVM chains. In the second echelon are Algorand and Tron, with average daily transactions of 4,655,100 and 3,875,000 respectively during the same period, but both are less than 1/6 of Solana. The average daily transactions of other non-EVM chains are lower. Acala, which has the shortest mainnet launch time, has an average daily transaction number of less than 5,000. The average daily transaction number of Cardano, which was smashed last year, is only about 80,000. Neo, NEAR The average daily transactions of EOS and EOS are about 160,000, 490,000, and 850,000, respectively. It can be seen that the on-chain activity of different chains varies greatly.
From the perspective of activity trends, in the past three months, the activity of the eight public chains has risen and fallen in half. Among them, the average daily on-chain transactions of Solana, Tron, EOS, and Neo have generally increased. What is particularly noteworthy is that, in the context of the overall market volatility and downturn in the past three months, Solana’s daily average on-chain transactions can still increase from May From about 16.7 million times in August to about 40.27 million times in August, an increase of 141.15%, the upward trend is very significant. The increases of Tron, EOS and Neo are much lower, about 50.73%, 25.05% and 19.45% respectively. On the other hand, Acala, Algorand, Cardano, and NEAR saw an overall decline in the number of daily on-chain transactions. The biggest drop was in NEAR, whose daily average number of on-chain transactions dropped from about 740,000 to about 340,000, a drop of about 54.24%. The declines of Cardano, Acala, and Algorand are slightly lower, about 26.06%, 19.46%, and 14.70%, respectively.
Another data indicator closely related to on-chain transactions is transaction fees. Lower transaction fees are generally considered user-friendly, which is more conducive to ecological development. From the data point of view, the transaction fees of most non-EVM chains are very low. In the past three months, Cardano has the highest cumulative transaction fee, reaching $1.3414 million, much more than other public chains. Followed by Solana and NEAR, the cumulative transaction fees reached US$603,500 and US$440,500 respectively during the same period. In addition, the cumulative transaction fee of Algorand is about 48,500 US dollars, while the cumulative transaction fee of Neo and Acala is less than 10,000 US dollars. Similar to the distribution of the daily average number of transactions on the chain, the transaction fees of each chain are also very different.
first level title
02
Tron’s average daily active addresses exceed 2.9 million, and EOS’s recent active addresses have increased by more than 90%
The number of active addresses on the chain is usually used to measure the size of users. Although the number of addresses and users may not correspond one-to-one, because users may have multiple addresses, they are at least proportional. More active addresses on the chain means The user scale of the chain may also be larger. According to statistics, in the past three months, the public chain with the largest number of daily active addresses was Tron, which reached 2.9008 million, followed by Solana, which reached 945,200. The average daily active addresses of the other six public chains are much smaller than these two. The average daily active addresses of Cardano and Algorand are about 75,500 and 34,900 respectively, while the average daily active addresses of NEAR are just More than 10,000, EOS only has more than 6,000, and Acala and Neo are even less than 300. It can be seen that the current user scales of non-EVM chains vary greatly, and only Tron and Solana users have reached a certain scale.
From the perspective of the development trend of active addresses, the situation is different. In the past three months, only the number of daily active addresses of EOS and Tron showed an overall growth trend, especially EOS, whose daily active addresses increased from 4,030 on May 9 to 7,816 on August 9, an increase of 93.95%. . During the same period, Tron’s daily active addresses increased from 2.5999 million to 2.7962 million, a slight increase of 7.55%.
first level title
03
Except for Solana, other public chain ecology relies on individual protocols, and the Acala ecology develops rapidly
Ecological construction has already become the top priority of the layout of each public chain. According to statistics, as of August 9, Solana has the largest number of DeFi protocols on the public chain, with a total of 75, followed by EOS, with a total of 22. Other public chains basically have about 10, and the least Neo has only 3.
On the other hand, a public chain with a high amount of lockup generally means a larger ecological volume and better development. Although the amount of locked positions is not an absolute indicator to measure the quality of ecological development, it is undeniable that it still has certain reference significance for observing ecological development. At present, Tron has the highest amount of locked positions in DeFi, reaching 5.901 billion US dollars, followed by Solana, reaching 2.543 billion US dollars. These two have the highest locked positions among the 8 non-EVM chains, and far exceed the others. The current lock-up volume of the remaining 6 public chains does not exceed US$500 million, and Cardano and Neo do not even exceed US$100 million. In terms of the number of agreements and locked positions, Solana has the best ecological development among them.
It is worth noting that the recent increase in Acala’s lock-up volume is very eye-catching, rising from US$121 million after its launch (June 22) to the current US$400 million, an increase of 229.89%, and this sharp increase also occurred in the market in a more depressed environment. As the pioneer of Polkadot, Acala's ecological construction started smoothly.
In addition, during the period from May 9 to August 9, Algorand and Tron had an overall increase in lockup volume, with increases of 32.77% and 22.56% respectively. On the contrary, Solana, Cardano, EOS, NEAR, and Neo saw an overall decline in the lock-up volume during the same period. Except for Neo, the decline was more than 30%. The biggest drop was Solana, which fell from $5.667 billion to $2.543 billion, a drop of 55.13%.
The degree of aggregation of the public chain ecology can be seen from the ratio of the locked amount of the three protocols with the highest locked amount of each chain (hereinafter referred to as the ratio of the locked amount of the head protocol). The higher the degree of aggregation, the more dependent the public chain ecology is. Very few head agreements are more susceptible to the influence of head agreements, and the degree of ecological development is still at the "point" and has not spread to the "face".
According to statistics, at present, only Solana has become a "face" in ecological development. This month, the average daily proportion of the head agreement lockup volume is only 32%, which is the lowest proportion of a public chain in the scope of this observation. Followed by Neo, the daily average ratio of the lock-up volume of the top protocol is about 69% (due to the lack of ecological data of Neo, the proportion of the lock-up volume of the top protocol only counts the proportion of the highest lock-up volume) . In addition, the daily average ratio of the head protocol lockup volume of the other 6 public chains is basically more than 85%, and the highest Acala has reached about 97%, which means that the ecological development of these public chains is still at the "point" "superior.
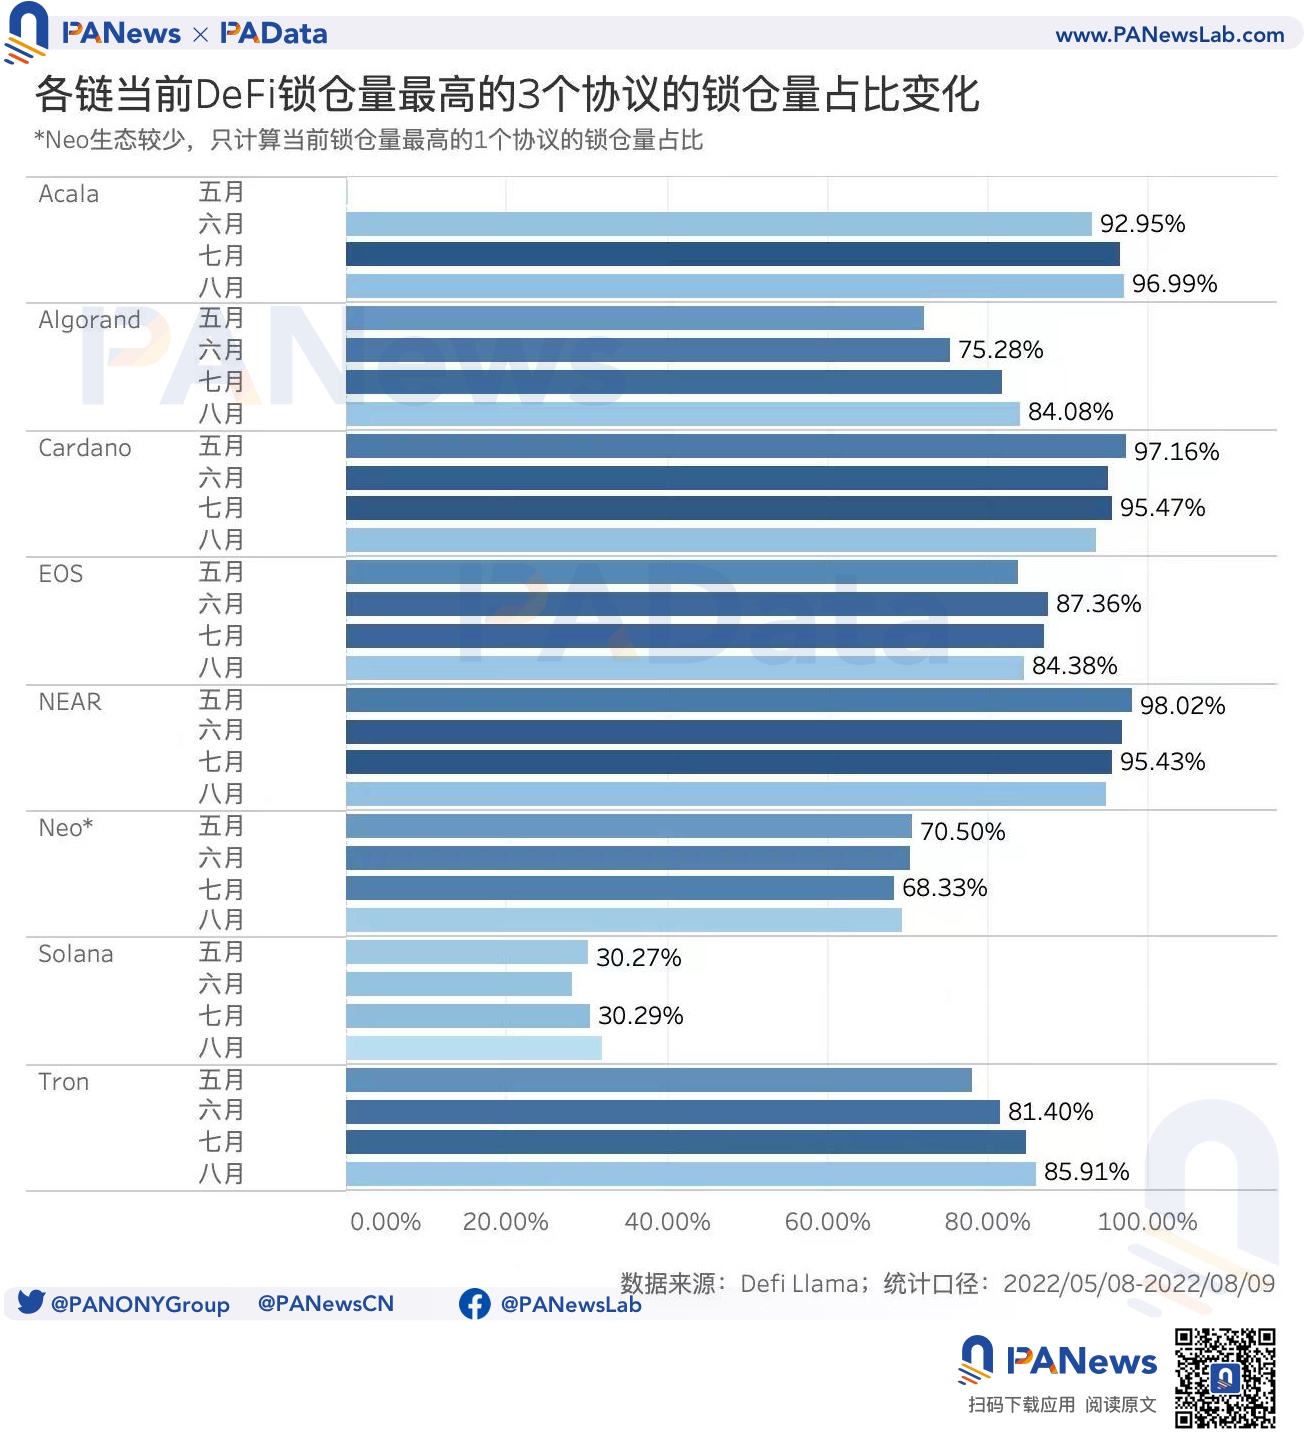
Moreover, judging from the development trend of the daily average proportion of the lock-up volume of the top protocols in the past three months, the proportions of Acala, Algorand, and Tron have shown an obvious upward trend, which means that funds are still gathering in the top protocols, "click "The development trend of the state has been further strengthened. On the contrary, during the same period, the proportion of Cardano and NEAR showed a clear downward trend, that is, the trend of funds flowing to non-head agreements, which may mean that the ecological development began to slowly spread from "point" to "face", but This needs a longer period of observation.


