
Bitfinex: U.S. Inflation Is a Powerful Fuel for Bear Market, Miners Are Selling Bitcoin and Ethereum
Original source: Cointelegraph
Original source: Cointelegraph"Bitfinex analysis highlights,"
For investors who HODL, we are in the worst moment in Bitcoin history."Bitcoin (BTC) price has continued to trade sideways for another day after bulls managed to pull its value back above $20,000. However, analysts are divided on the move: some believe"the worst is over", others think"。
The worst is yet to come
There are also analysts who believe that Bitcoin may fall further, citing that the sideways between $18,000 and $21,000 indicate that there is not enough trading volume to maintain new highs, so any negative event may cause Bitcoin to lose the support of $20,000 again. and dropped above $18,000.
Ayron Ferreira, chief researcher at Titanium Asset, pointed out that the trend of the cryptocurrency market is closely related to the performance of the US economy in the short term, so investors should pay attention to further signs of inflation and currency adjustment levels in the next few months.
Like Ferreira, Bifinex analysts pointed out that the U.S. economy is currently the main catalyst for Bitcoin prices, so a deterioration in the U.S. economic situation could greatly affect the cryptocurrency market.
The company emphasizes:"The company emphasizes:"。
Rate hikes, monthly inflation, CPI data and statements from Jerome Powell (Federal Reserve Chairman) remain in focus as we assess macro conditions
Right now, the Fed appears to be looking for a short-term, sharp interest rate shock to try to bring down monthly inflation immediately. On Thursday, Powell mentioned that he is not opposed to raising interest rates by 100 basis points.
Policymakers still seem to believe that economic growth is still showing no signs of slowing, and the Fed is signaling that they would be more willing to engage in a more aggressive bullish cycle if they believe the economy can hold up."An interesting piece of information worth highlighting is the SEP (Summary of Economic Projections). The FOMC's neutral rate estimate has risen to 2.5%. They also plan to raise the federal funds rate to 3.8%, 130 basis points above this neutral threshold. This suggests more austerity. The unemployment rate in 2022 will be 3.7%. It will rise to 3.9% in 2023. However, according to its forecast, the Fed will continue to raise interest rates by 40 basis points in 2023"。
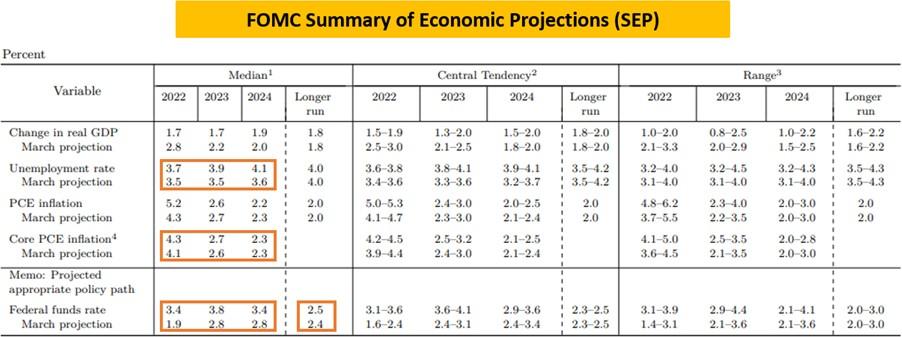
FOMC SEP (Source: The Macro Compass)
first level title
Inflation and unemployment affect the cryptocurrency market
The exchange's analysis noted that the Fed has a difficult task of keeping unemployment low and prices stable. The Fed’s median forecast for the unemployment rate is 4.1%, up 50 basis points from the current 3.6%.
As a result, the labor market is showing no signs of strength.
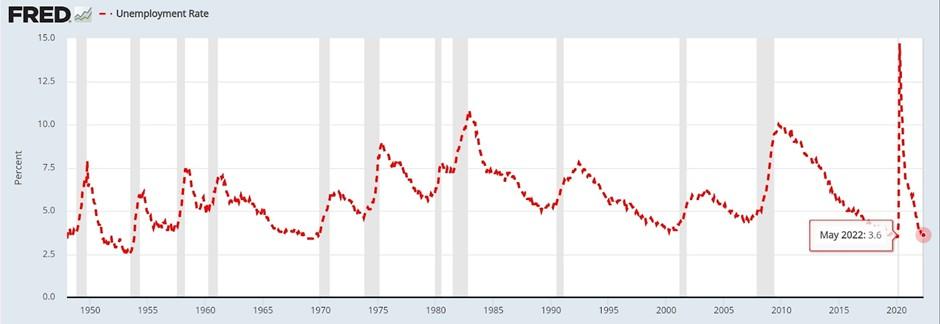
image description
US Unemployment Rate (fonte: FRED)
Bitfinex also noted that inflation expectations refer to how quickly consumers and businesses expect prices to rise. They are necessary because these expectations affect actual inflation."If everyone expects prices to rise next year, say 3%, then businesses will want to increase prices by (at least) 3%, and workers and their unions will want increases of a similar size"。
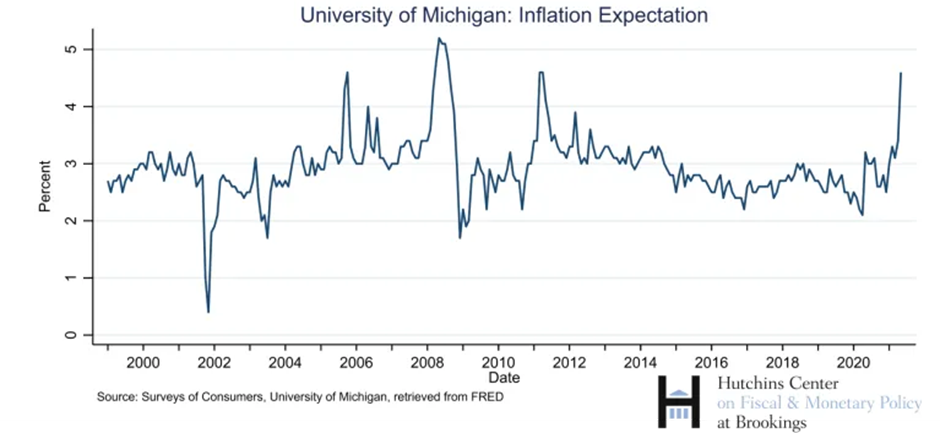
image description
University of Michigan Inflation Expectations (fonte: FRED)
Bitfinex noted: “Graphics suggest that over the next decade, consumers expect inflation to be higher than the current trajectory. However, consumers also see inflation higher than the official report. Or two years from 2022 and 2023, depending The economy is affected by external factors such as the Federal Reserve's open monetary policy and supply constraints due to the government's response."
The firm also noted that analysis of the standard yield curve shows bond yields rising steadily with maturity, but flattening somewhat for longer maturities."Steep yield curves don't flatten in the end. This suggests that the economy is growing and higher inflation is likely. A flat yield curve indicates that there is not much difference between short-term and long-term bond yields. This shows that there is uncertainty. Yield curve inversions are rare and portend trouble ahead. It occurs when short-term bonds pay better than long-term bonds"。
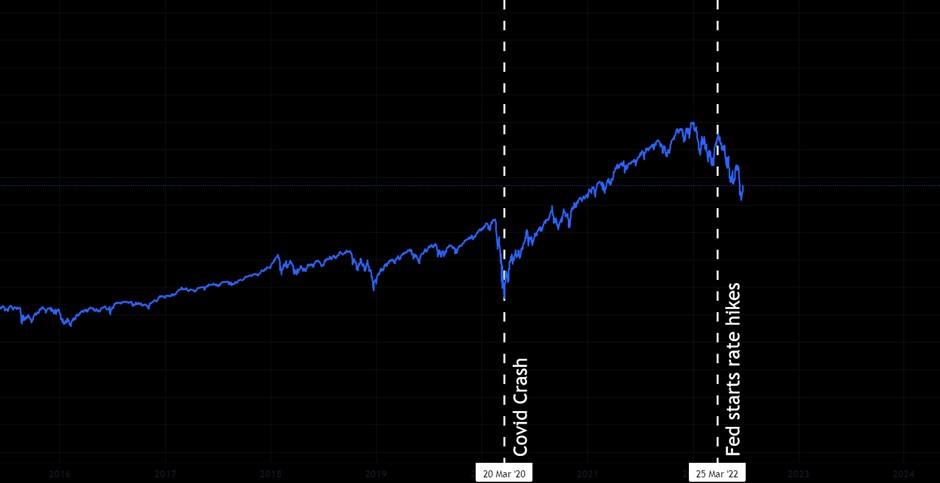
image description
One-dimensional chart of the S&P 500 index
According to the firm, the standard yield curve rose slightly in March when investors realized the economy remained strong and unemployment was low.
"With the stock market severely downturned and bonds unable to act as a portfolio hedge in this environment, we have just witnessed the greatest destruction of 'financial wealth' in history," the firm said, referring to JPMorgan's May 2022 research note, which he said claims that total wealth in the United States will drop from $13 trillion to $8 trillion in 2022, a drop of $5 trillion, mostly from a bad stock market".
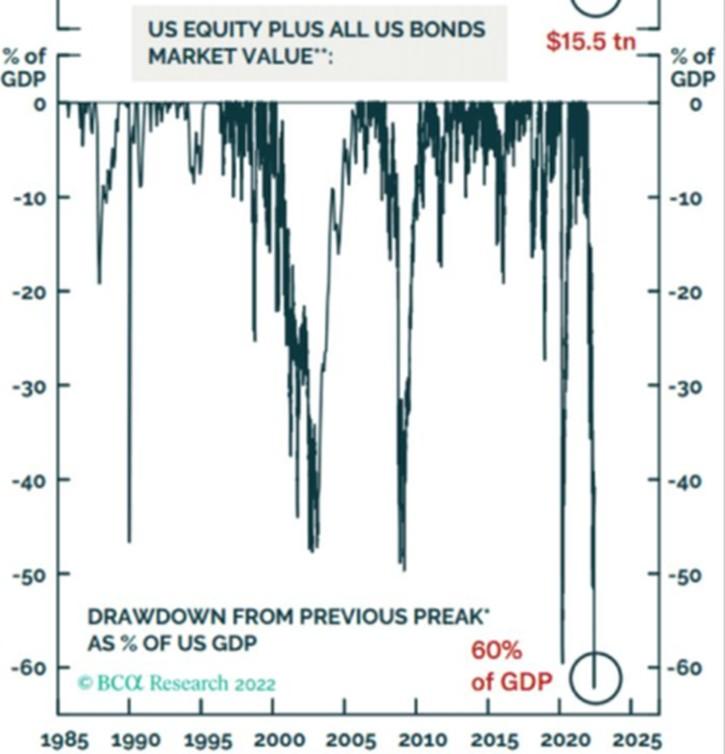
Market value of U.S. stocks plus bonds (Source: BCA Research)
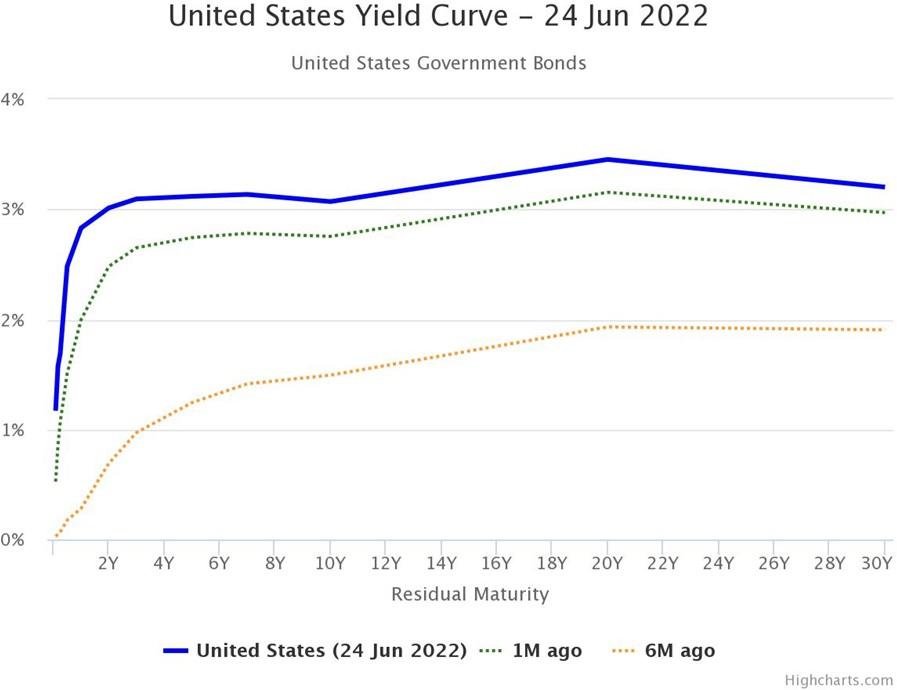
image description
US Yield Curve (Source: worldgovernmentbondds.com)"As noted above, a flat yield curve shows that short-term bonds yield little difference from long-term bonds. This shows that there is uncertainty. This indicator tells us that the bond market is waiting for more clarity from the Fed. "
first level title"Bitcoin is not inflationary
Bitfinex emphasized that the usual narrative of Bitcoin as a hedge against consumer price inflation has been proven false, but one narrative is that it serves as a hedge against extreme monetary inflation.
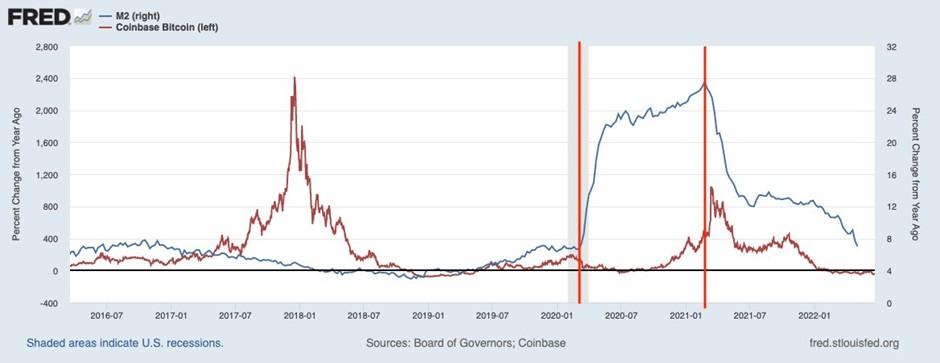
image description
M2 Money Supply vs Bitcoin Price (Source: FRED/@JanWues)
According to a chart the company shared, M2 is a measure of the money supply, which includes cash, demand deposits and easily convertible approximate currencies. M2 is a broader measure of the money supply than M1, which includes only cash and demand deposits.
In 2020, the year-on-year percentage change in M2 started to increase rapidly in a short period of time. The year-over-year percentage change in Bitcoin price follows with a lag. After the flash crash of that year, the price of Bitcoin reached a new all-time high, and M2 also reached a new high.
The year-over-year percentage increase in M2 peaked at the end of February 2021; the price of Bitcoin quickly peaked in mid-March 2021 during this cycle."Arguably, over the past two years, Bitcoin price has acted as a lagging indicator of M2 money supply. This is where the argument for Bitcoin as a hedge against extreme monetary inflation comes in. "
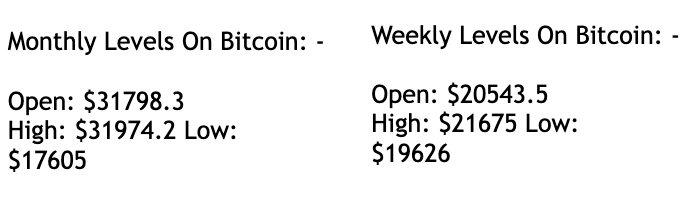
image description
(Bitfinex BTC/USD data)"Bitcoin continues to hover around $20,000, coinciding with the previous cycle peak in 2017. The rest of the cryptocurrency market has seen altcoins fall 80-90% from their 2021 peaks. For investors who HODL, we are currently in the worst moment in Bitcoin history. "
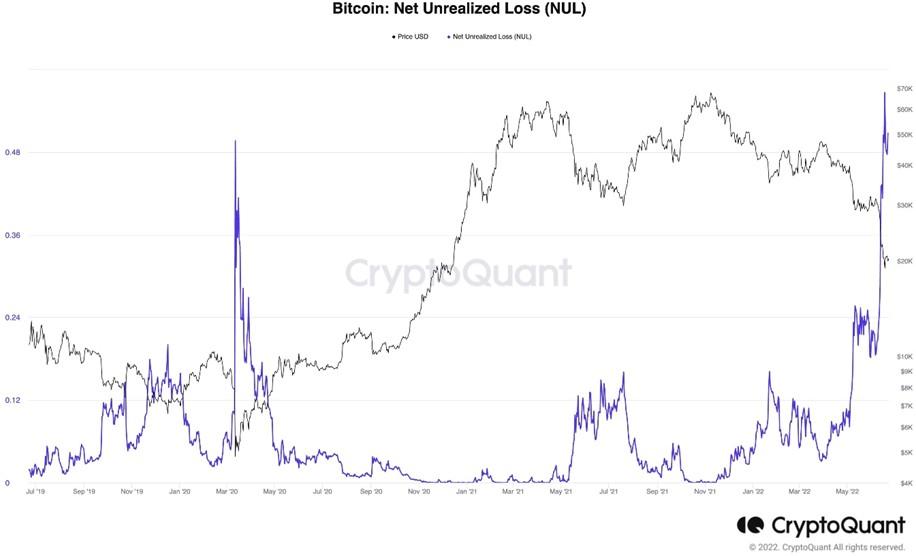
Bitcoin Spot Net Unrealized Losses (Source: CryptoQuant)
first level title
The exchange noted that the unrealized net loss on spot holdings was the largest in Bitcoin’s history. That means there are a lot of retail investors struggling, as well as entities that face a significant drop in their cost base.
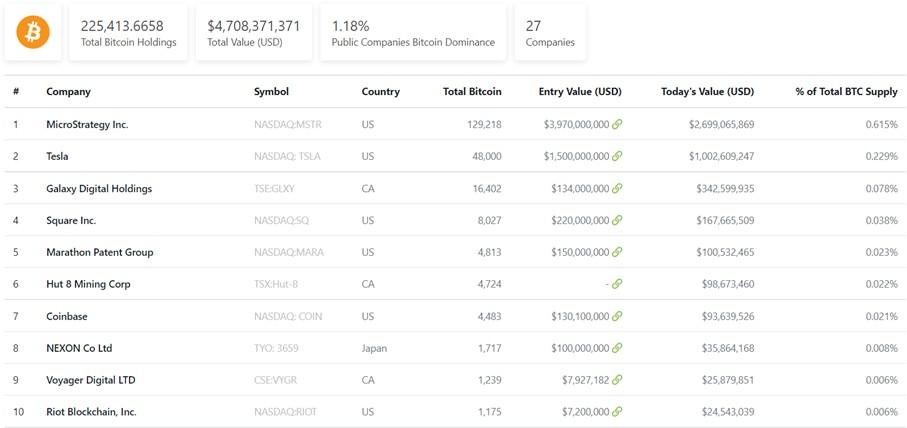
image description
Listed companies with BTC stakes (Source: Coingecko)
“Microstrategy, for example, has over $1.2 billion in unrealized losses on its Bitcoin holdings. Additionally, crypto funds like Three Arrows Capital and lenders like Celsius maintain long-term leveraged positions. Stocks exposed to cryptocurrencies are stuck in their investments. predicament, and the forced liquidation of its holdings may require a further depreciation of the Bitcoin price.”
Glassnode notes that production costs are currently around $17,600, the lows reached before prices started to recover late last week.
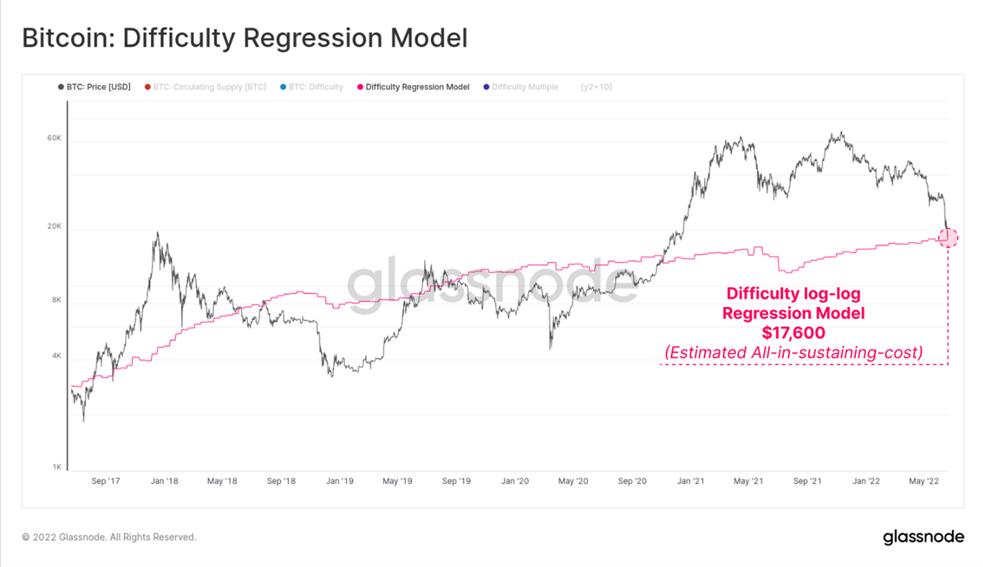
image description
Bitfinex also emphasized that this indicator is very important to be able to estimate the realization price of miners as an indicator of the balance cost basis of their mining, which is currently $26,170. Due to strong financial pressure, the amount of outflows from the miners' treasury increased, reaching a rate of 5 thousand to 8 thousand BTC per month.
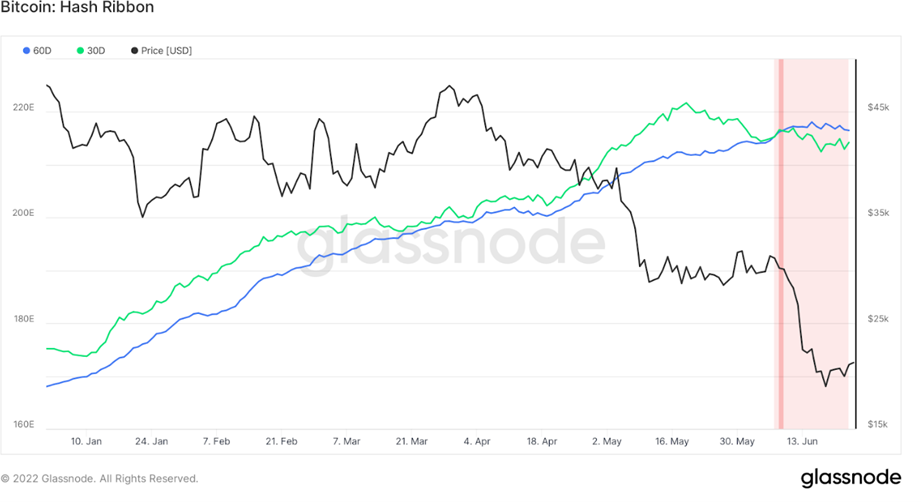
image description
Bitcoin Hash Ribbon (Source: glassnode)
The graph above shows if a miner capitulation occurs. Miner capitulation occurs when a significant net proportion of miners shut down their machines for an extended period of time."During miner capitulation, miners are not only shutting down their rigs, they are likely selling their BTC. During the start and capitulation period, the selling pressure from weak miners increased greatly, but once the capitulation is over, the network is only left with the most important miners with the lowest operating expenses. Ultimately, that ends up reducing the day-to-day forced selling pressure."
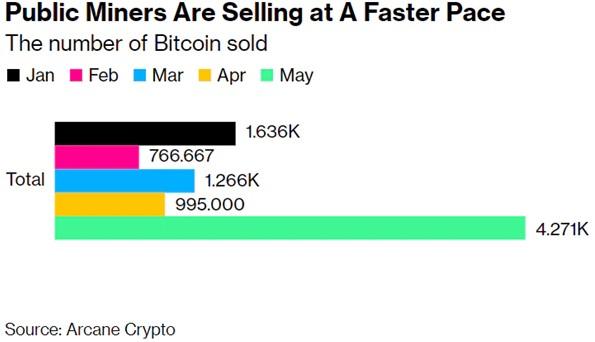
image description
Sales velocity of public miners (Source: Blockware Intelligence)
“Surprisingly, after Bitcoin failed to sustain its previously consolidated low ($28,000), miners stopped selling to cover operating costs and saw balances grow at a rate of 2,200 BTC per month. This continues to support our Thesis, that there are a large number of entities, including miners, who suffer unrealized losses from holding Bitcoin.”
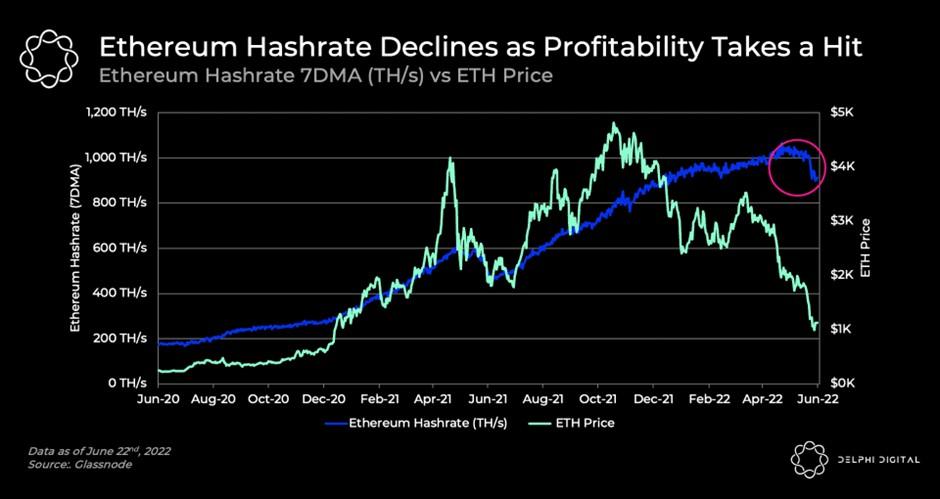
image description
Ethereum hashrate compared to price (Source: Delphi)
The company also highlighted that the profitability of Ethereum mining has been severely impacted by the current bear market, with miners now earning less profit from their operations due to falling prices.
Rising energy costs complicate the situation; the energy price index is now at its highest level in five years."Once Ethereum switches to Proof of Stake, this should seriously affect the market as it will reduce the supply of ETH, killing current Ethereum mining, so miners may be forced to sell"。


