
Glassnode: Top Buyers Nearly 'Surrender', Bitcoin HODLer Dominates Market
Compilation of the original text: The Way of DeFi
Original source: Glassnode
Compilation of the original text: The Way of DeFi
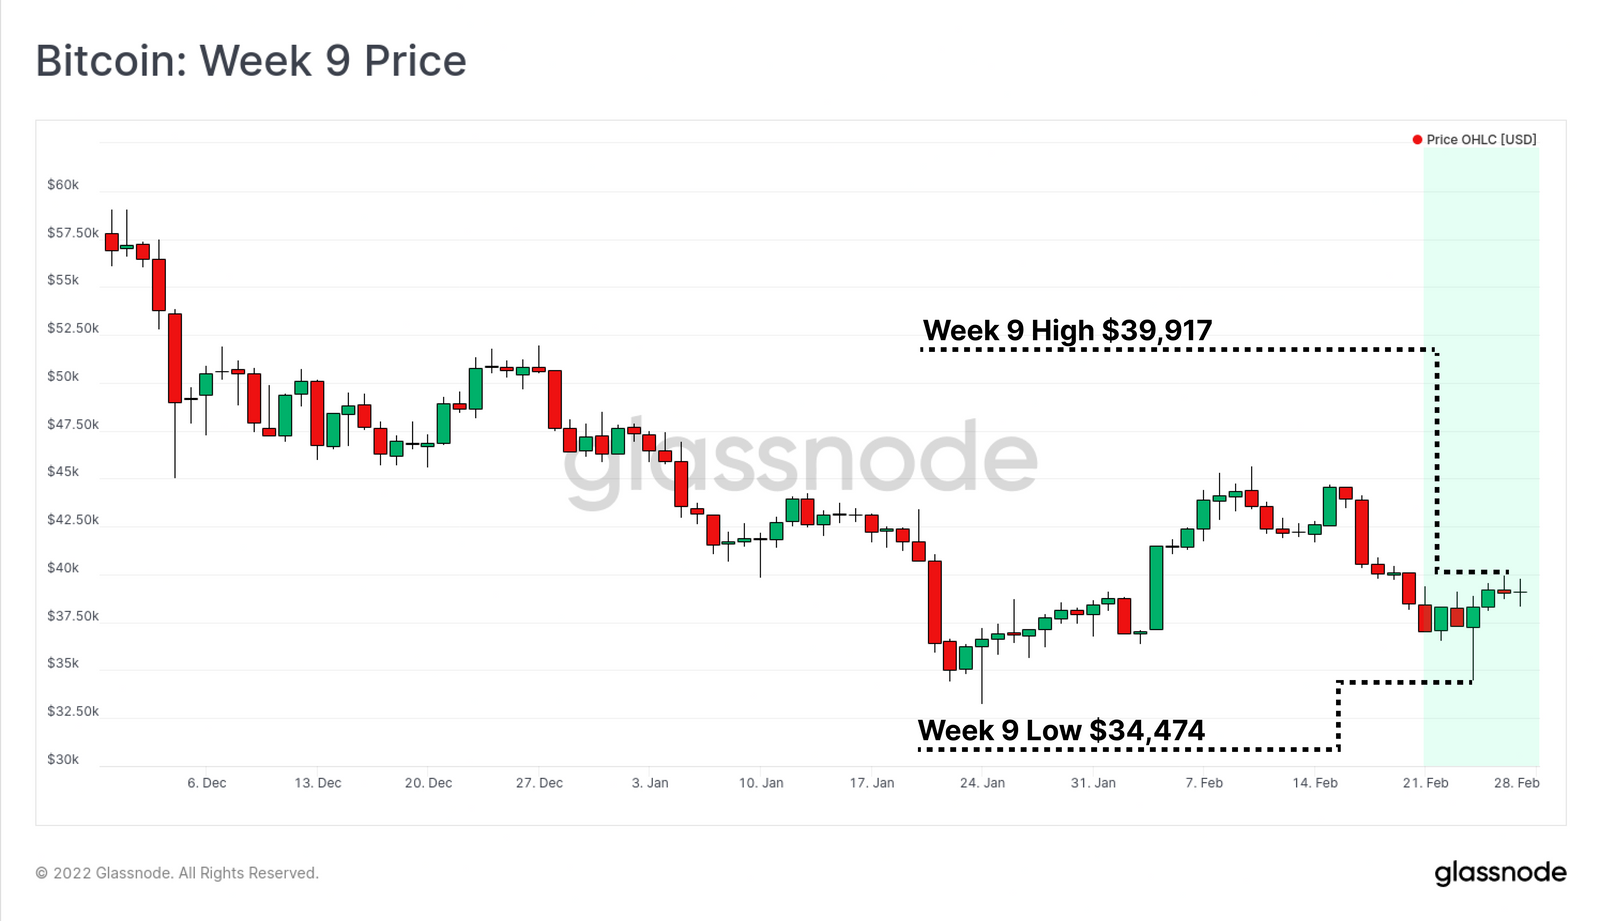
Global markets face a very sober week as armed conflict breaks out between Russia and Ukraine. As a global macro asset, and because the market never “closes,” Bitcoin’s price fluctuates wildly. The market traded as low as $34,474 last week before quickly recovering to $39,917.
Now 138 days down from its November ATH, the confidence of many Bitcoin investors, primarily those who bought near the top, has been significantly challenged this week. In this issue, we take a look at which buyers will flock and compare the current market structure to the May-July 2021 period.
What we have observed is that the top buyers have now almost completely capitulated. However, the remaining distribution of holders appears to have a higher level of determination, arguably reflecting the unwavering conviction of the buyers of last resort: Bitcoin HODLers.
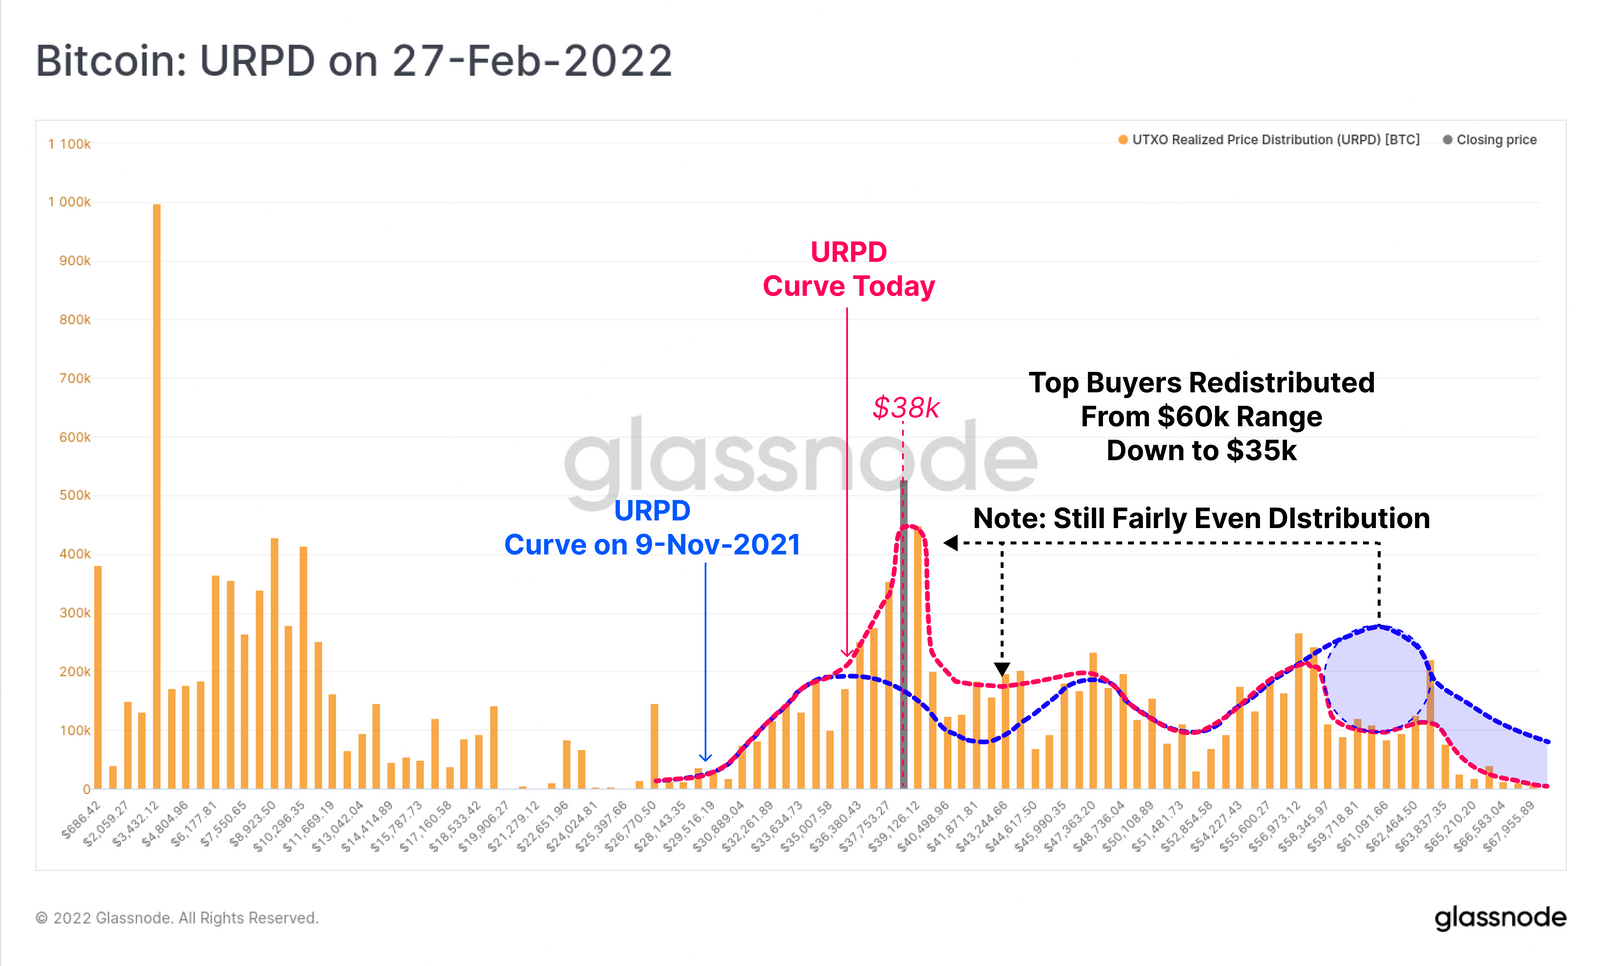
We’ll start our in-depth analysis with the URPD indicator, which shows the price at which the token supply distribution last moved on-chain. What we wish to explore here is the similarities and differences between investor behavior during this drawdown and a similar drawdown from May to July 2021.
We will analyze the URPD indicator from four dates:
May 10, 2021, before the mass sell-off liquidation event
July 20, 2021, $29,000 low before rally to ATH in late 2021
November 9, 2021, when the market was at an all-time high
February 27, 2022, at the time of writing
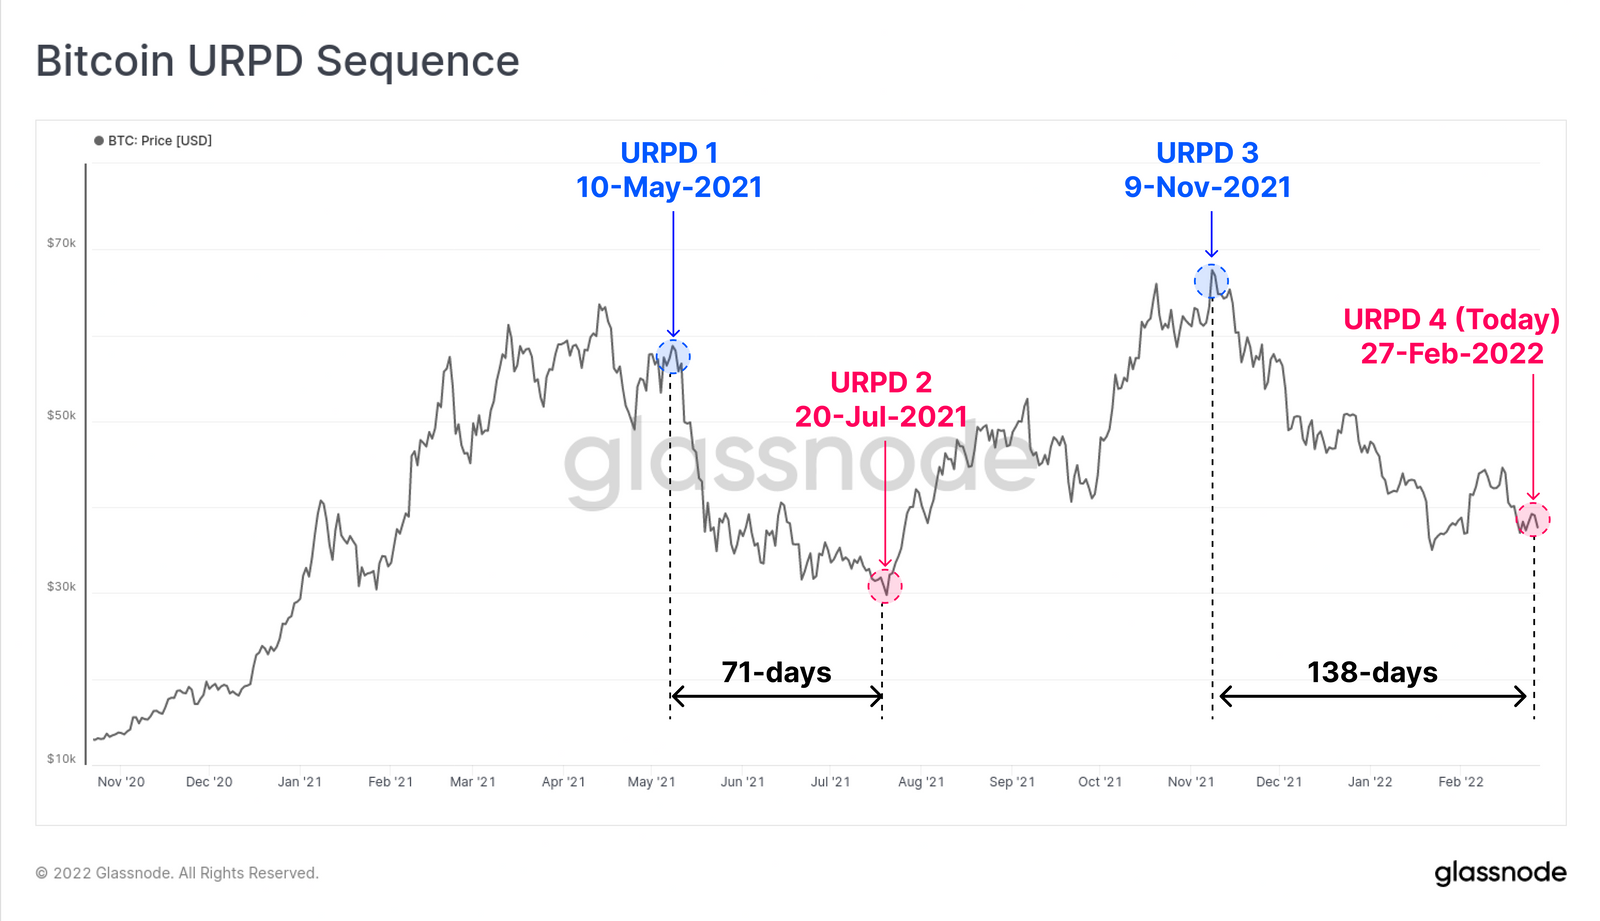
image description
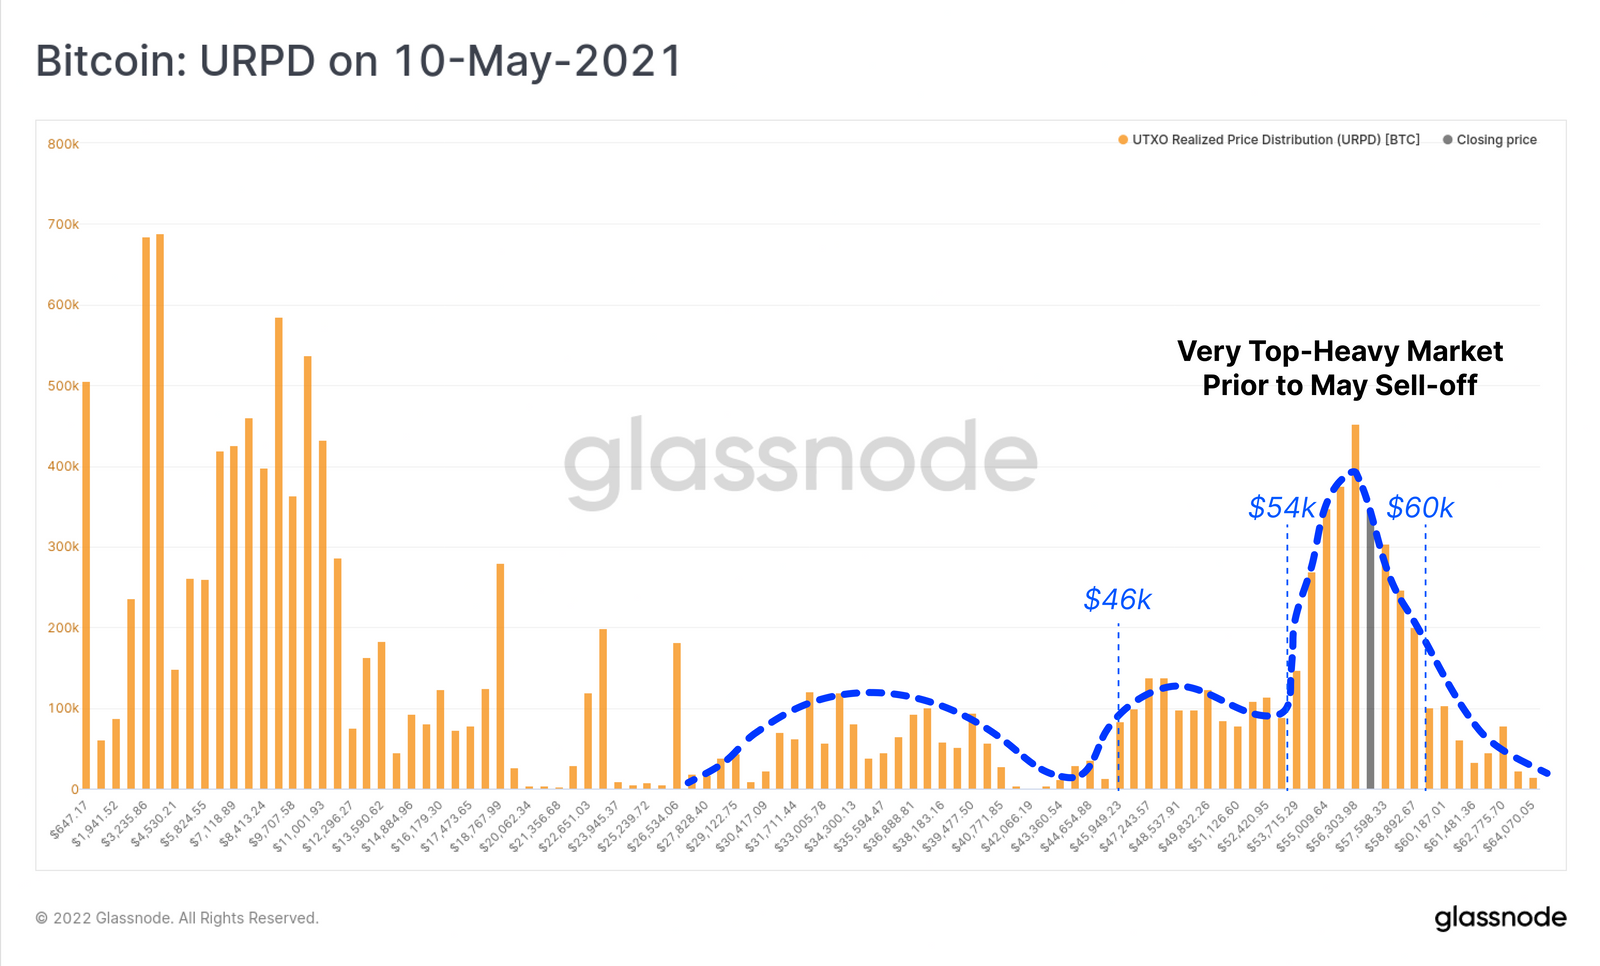
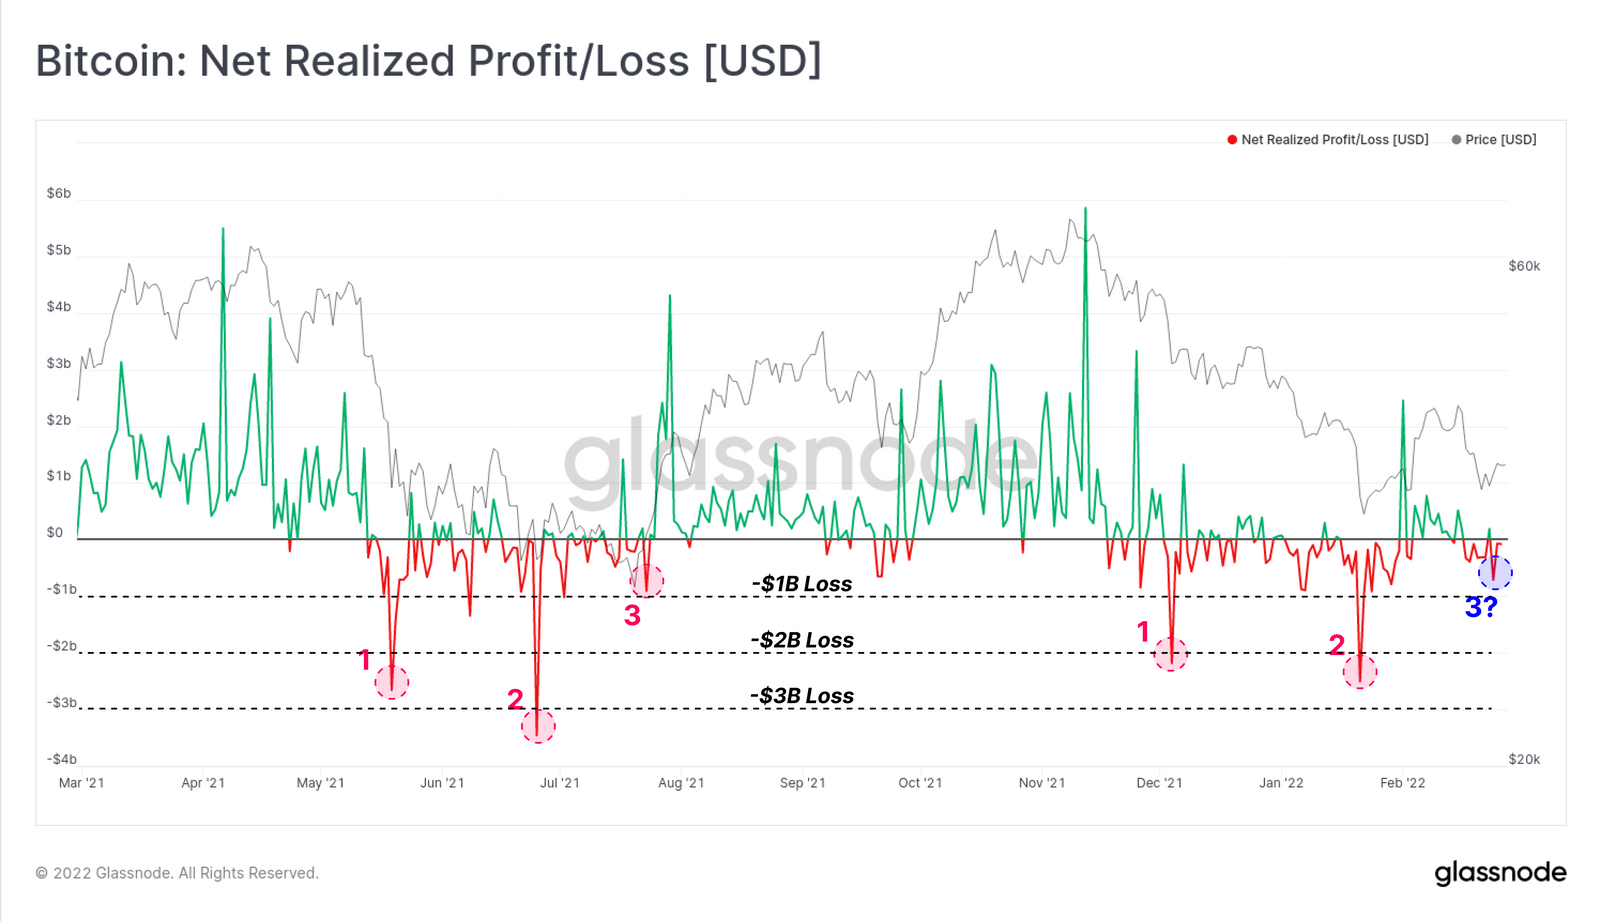
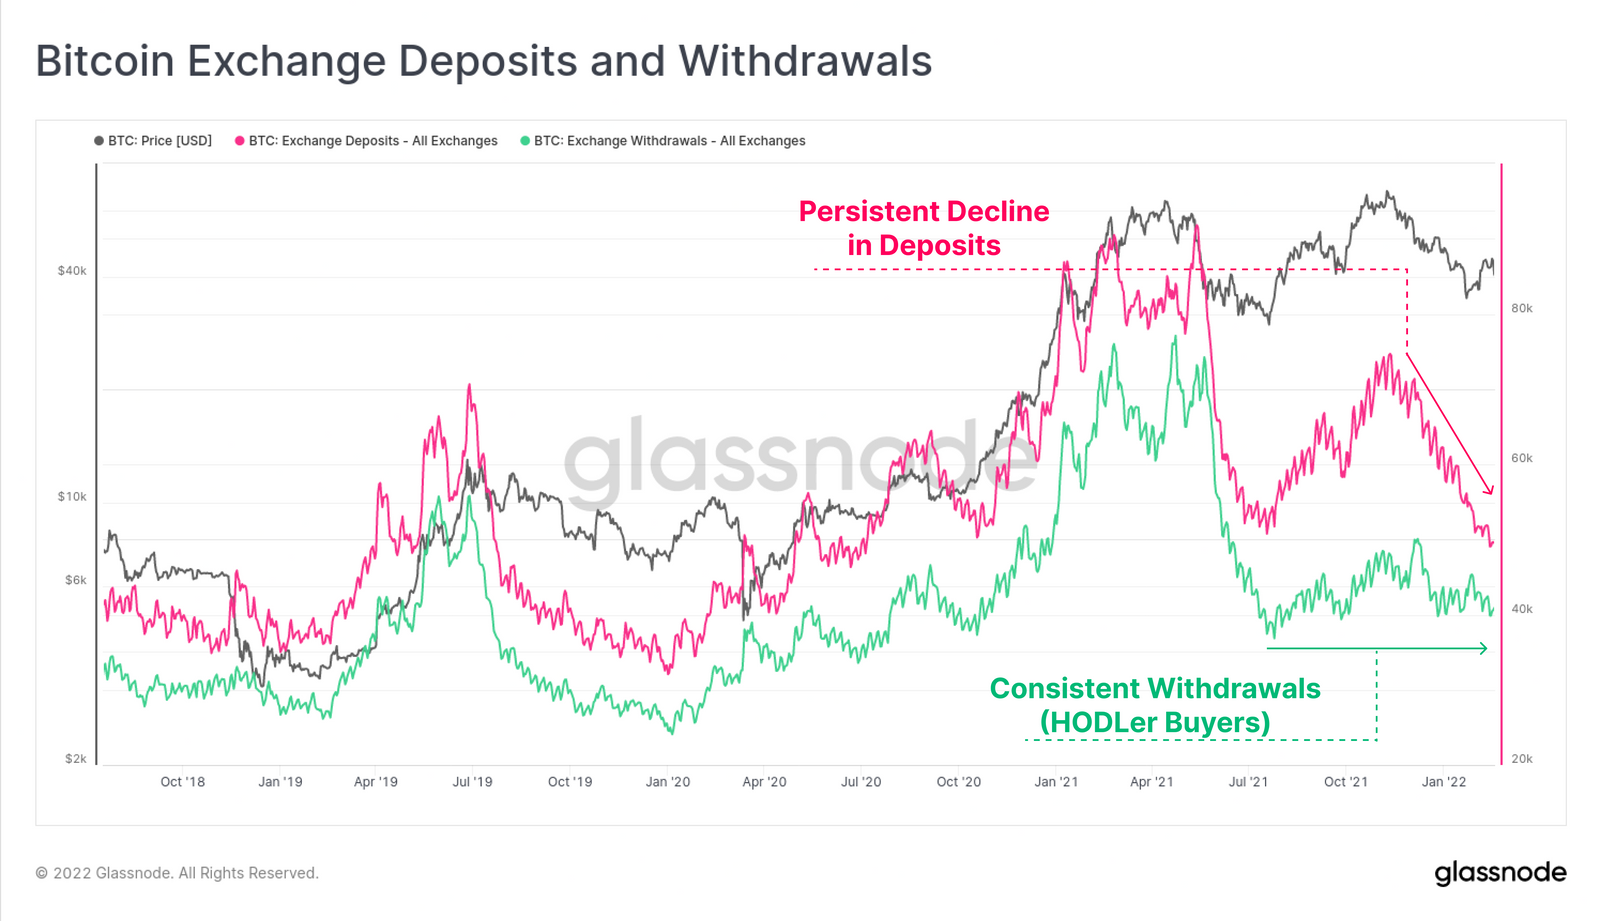
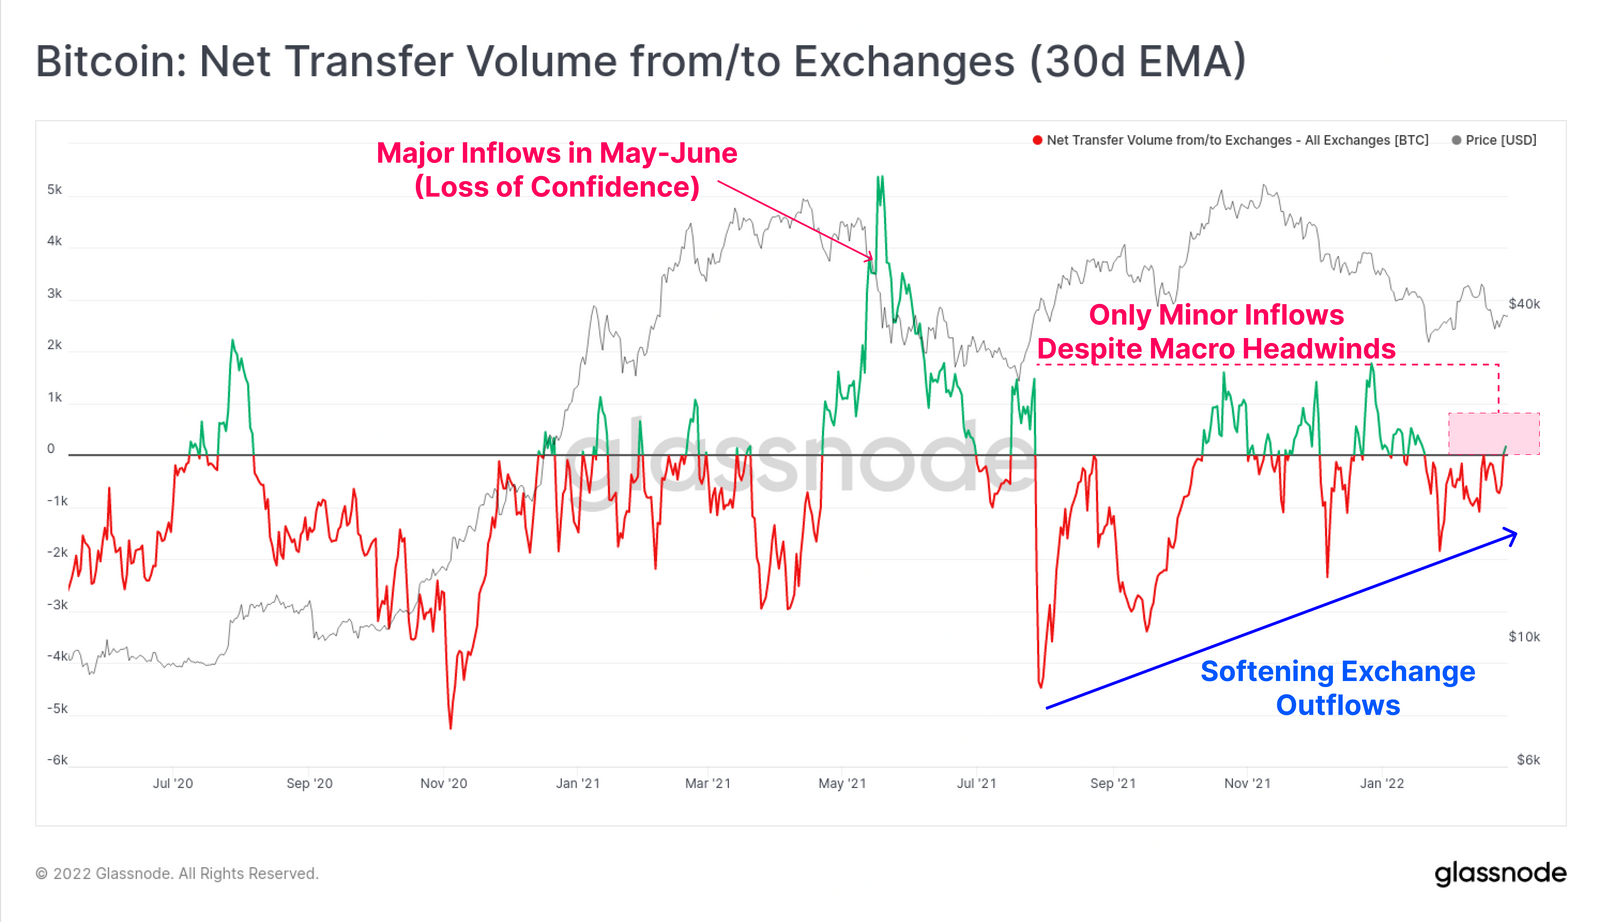
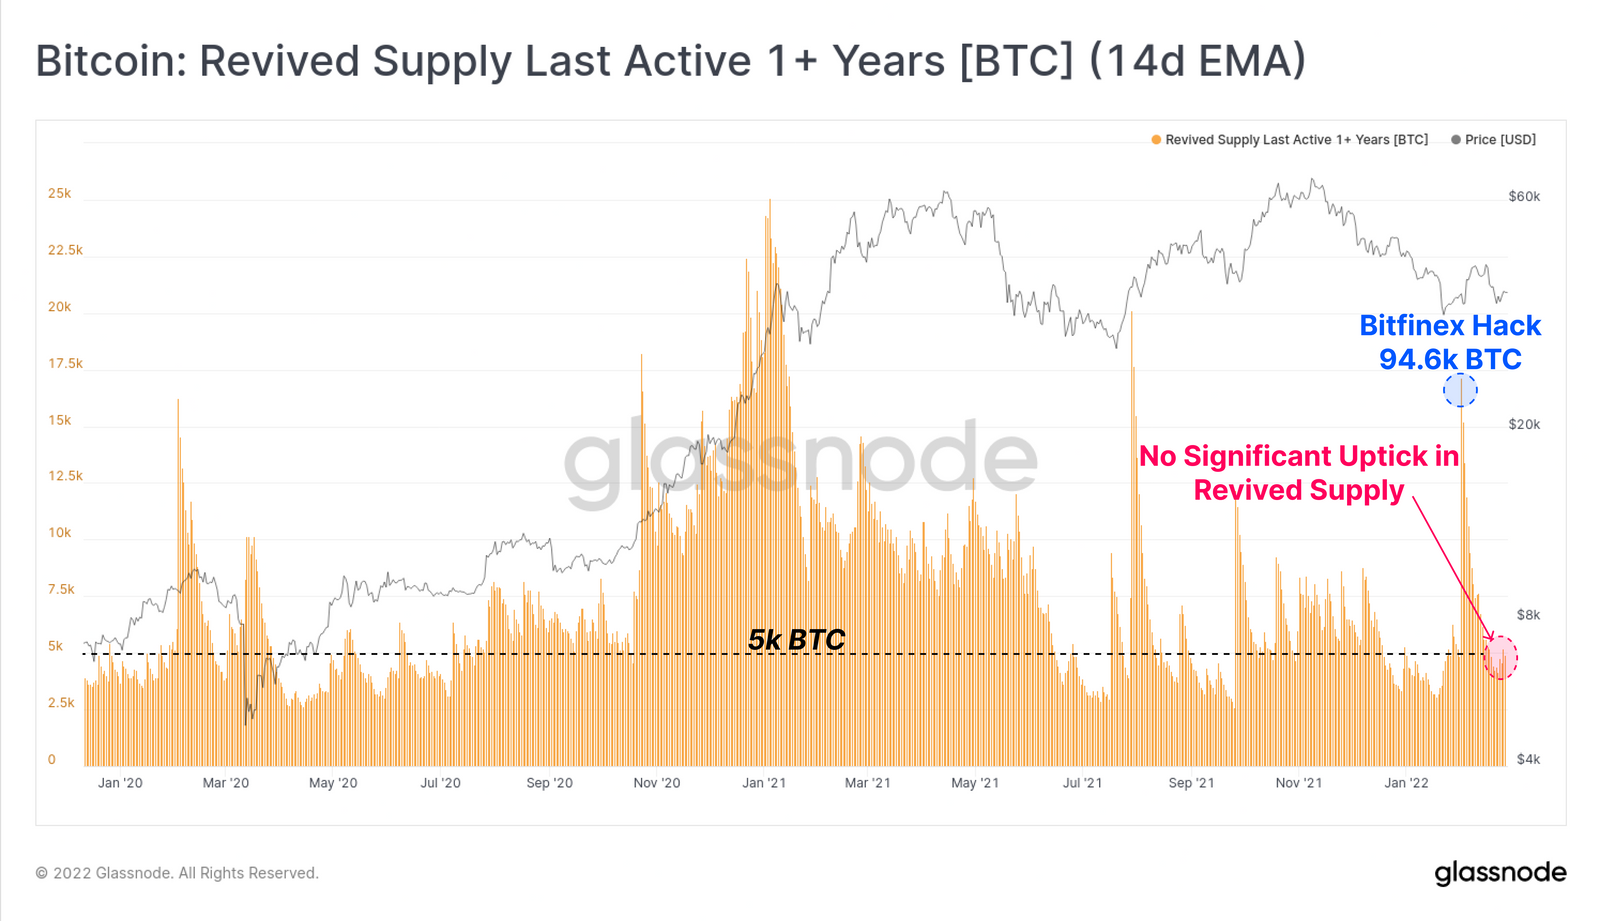
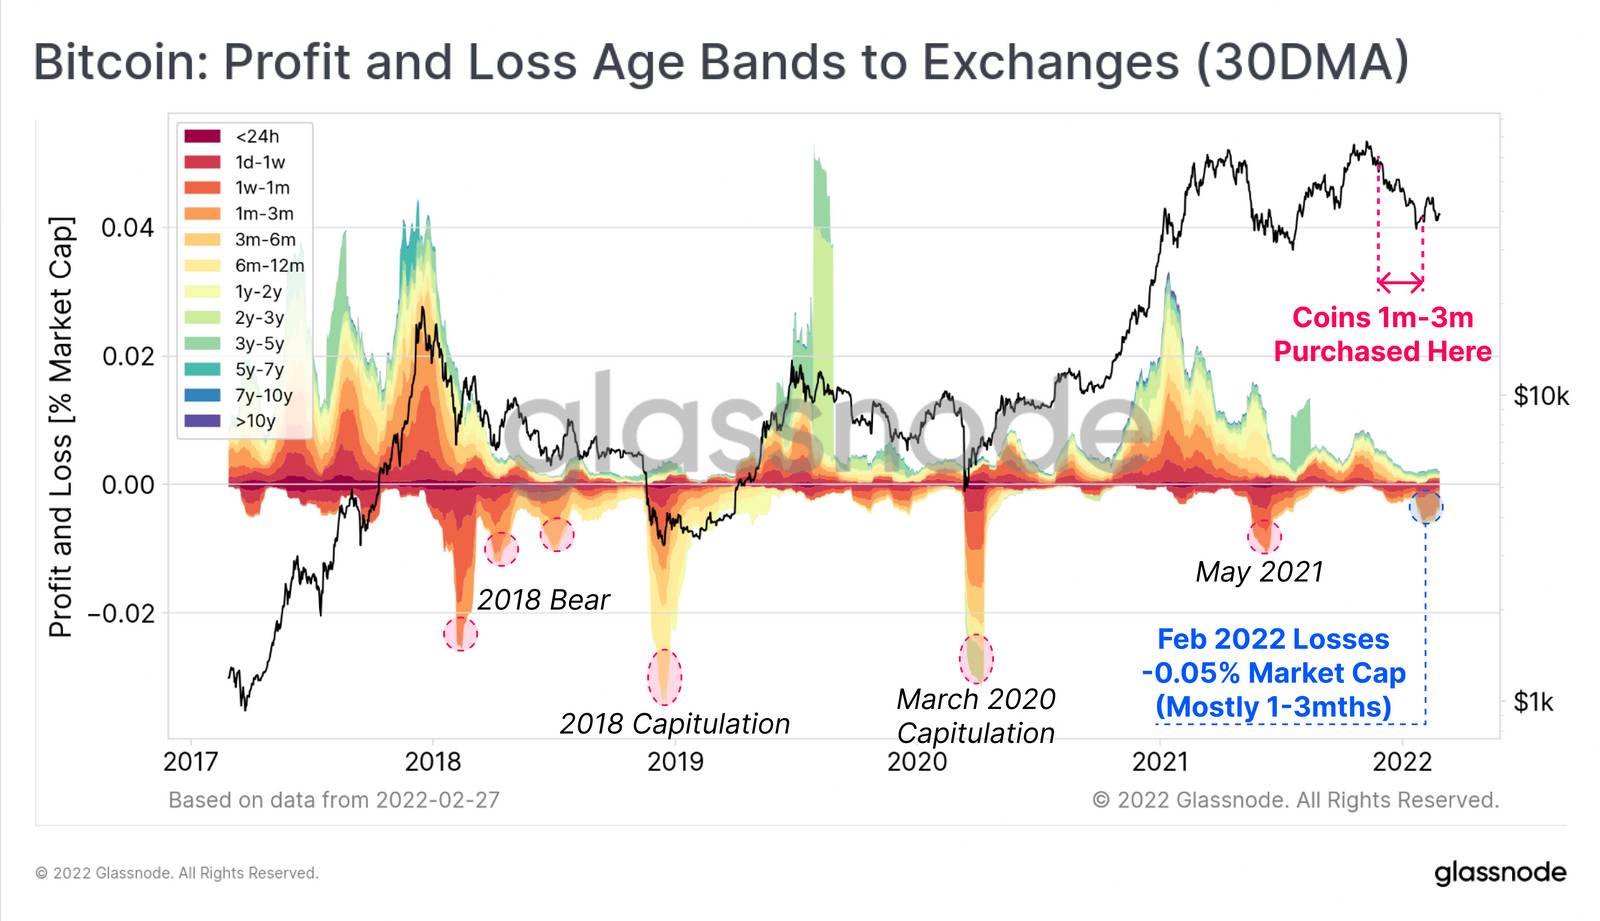
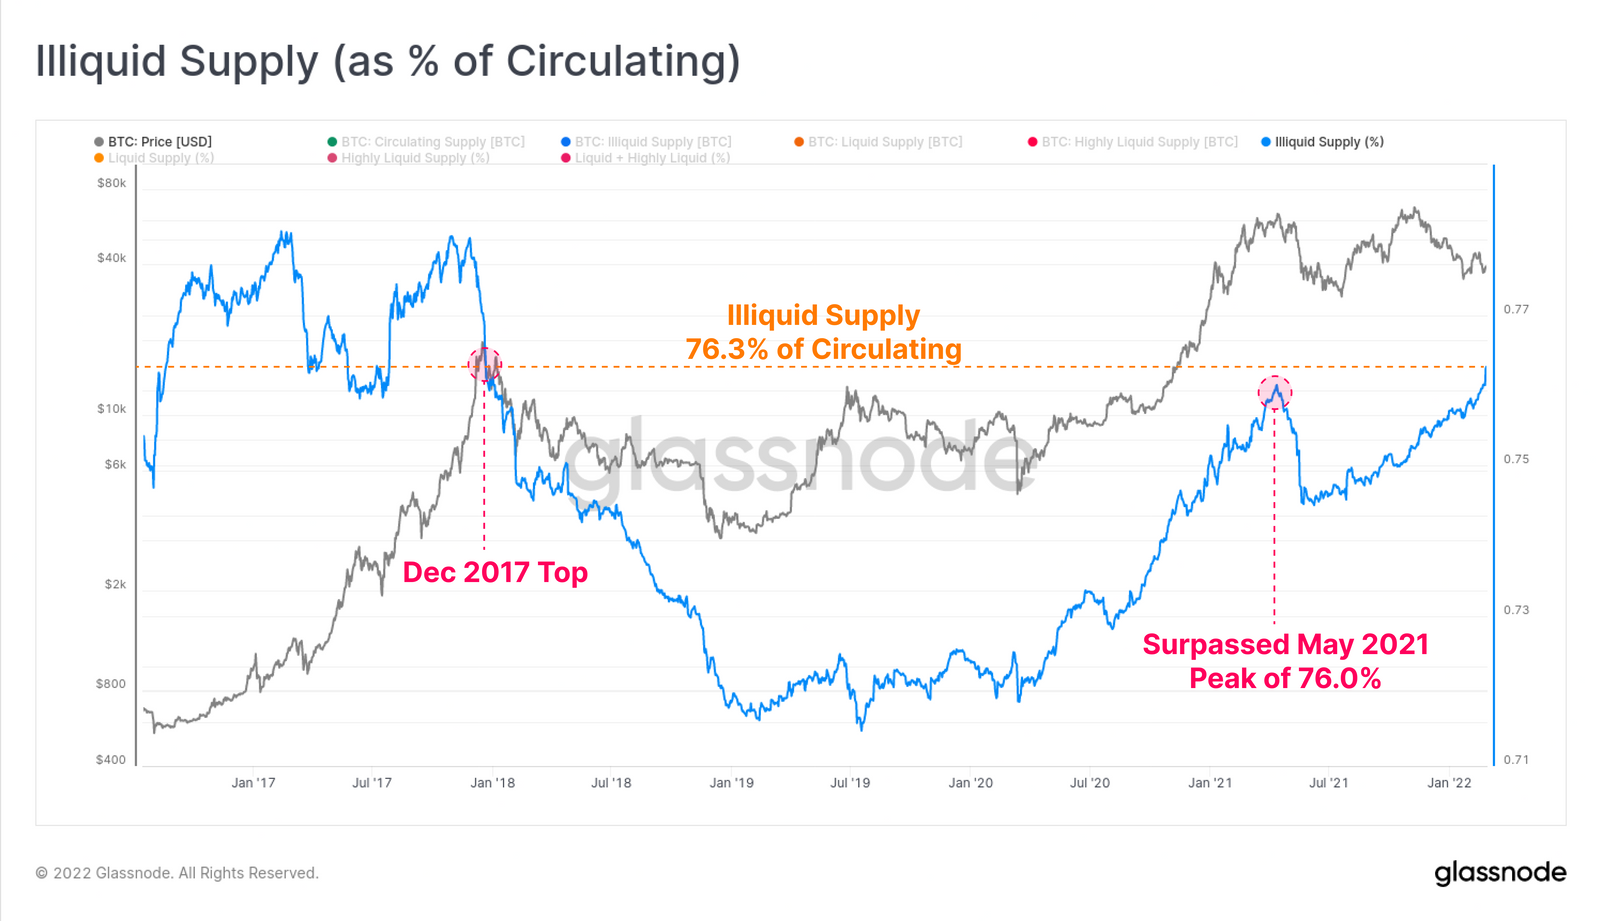
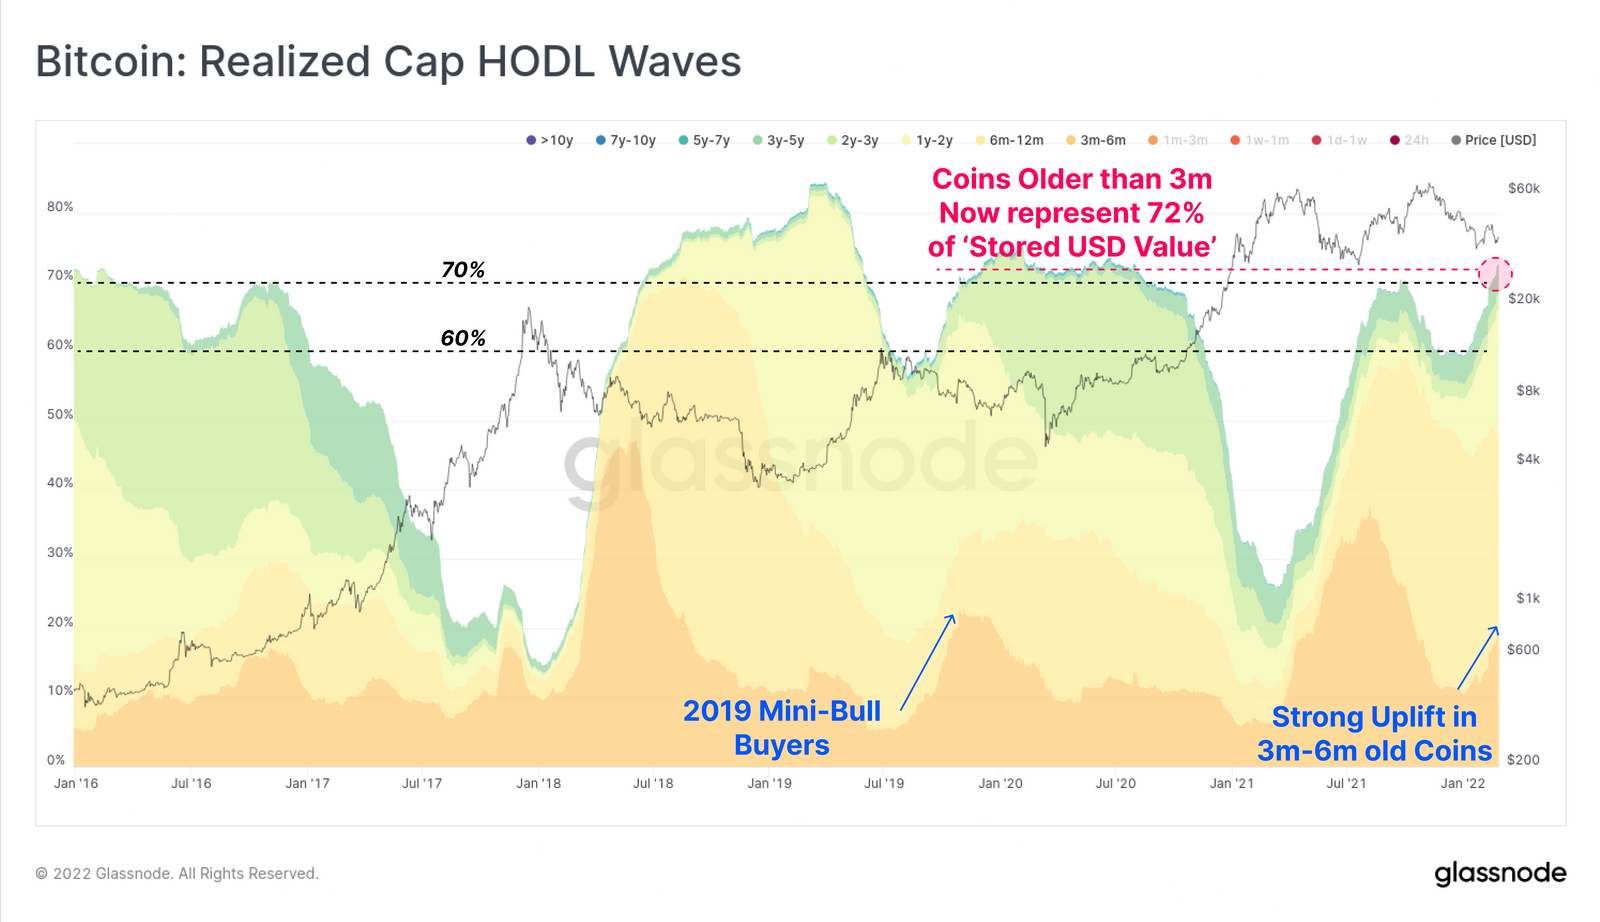
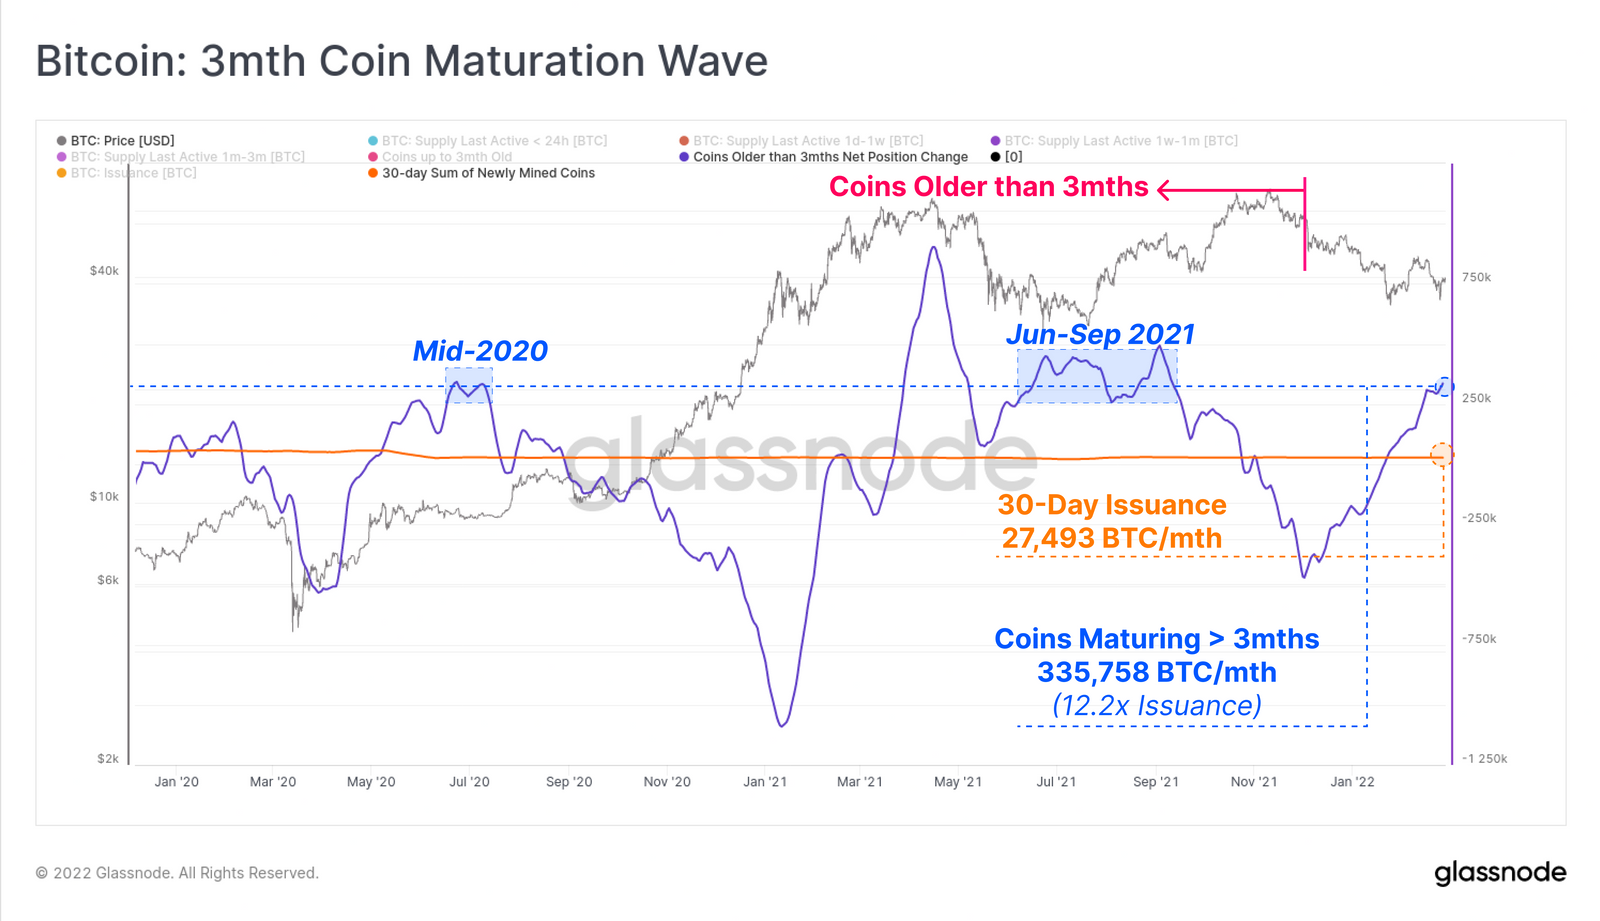
Many investors who accumulated during the May-July adjustment took profits on the way up. This creates volume nodes around $35,000, $47,000, and $62,000. image description Real-time chart (November 9, 2021) Moving on to the current market, here we can see that the evenly distributed supply from November is still mostly there. These investors have not closed their positions despite the 50%+ pullback. Additionally, the major redistribution appears to be coming from investors who bought into the $60K+ range near all-time highs and have found new owners in the current $35K to $38K range. real time chart This week's news events are changing the world. If bitcoin investors, especially those who see bitcoin as a risky asset, are to one day capitulate, the outbreak of dynamic wars could be a catalyst. However, the degree of “on-chain capitulation” that occurred during this week’s sell-off was underwhelming, to say the least. In fact, it exhibits similar characteristics to the July 20, 2021 sell-off to $29,000 (point 3 below), which saw no bearish follow-through at all, sending prices to new lows. real time chart image description Of course, the number of exchange deposits and withdrawals is only part of the picture, and the volume of each exchange helps establish a balance between supply and demand. The chart below shows the 30-day net flow EMA of exchanges, and we can see that since July, the market has favored withdrawals (red, outflows). During this time, the trend of exchange outflows has softened, however we are still not seeing inflows anywhere near the May-July levels of last year, even with various macro headwinds. real time chart We can also see this in the recovering supply metrics, looking at the number of tokens over 1 year this week. If there is a general loss of confidence among the Bitcoin HODLer crowd, we would expect a sharp uptick in this metric. real time chart Over the past few weeks, one group has dominated exchanges’ on-chain spend. Investors who bought the dip, only to find more declines to come. Over the past 30 days, investors with coins aged less than 3 months have dominated loss-making payouts. These token payouts cost them a daily loss of -0.05% of market capitalization, matching the bear market lows of the first half of 2018. With the exception of June-July last year, broad market bottoms are usually marked by massive exits by investors old and new as fear prevails. Perhaps Bitcoin HODLers are structured differently this time around, given that we haven’t seen similar long-term holder capitulation? Or, there may be another painful drop that drives all remaining sellers out of the market entirely. Here's an early look at an unpublished chart from the Glassnode Engine Room. With top buyers largely driven off the network and proving to be a market dominated by HODLers, we'll use three charts to help describe what this long-term lineup might be doing. The first is "Illiquid Supply," which tracks the amount of tokens held in wallets with little to no spending history. These typically represent the wallets of cold storage and HODLers who make withdrawals while adopting a dollar cost averaging strategy. The ratio of illiquid supply to circulating supply has exceeded the peak in May 2021, reaching 76.3%. This has now returned to the same level as the 2017 market top, reversing a four-year increase in token wallet liquidity. Note, however, that both of these instances occurred prior to major sell-off events, so it remains to be seen whether these tokens are actually in cold storage. Similarly, the 3+ month Realized Cap HODL band is pushing 72% to new local highs. This means that 72% of the USD value "stored in Bitcoin" is held by coins older than 3 months. This is typical of a bear market, with long-term investors seeing value while slowing spending (as seen in the recovering supply chart above). Note that most of the recent uptick has been driven by the orange 3-6 month tokens at the bottom. These tokens are approaching or crossing the 155-day (approximately 5-month) border of short-term to long-term holders. Finally, to demonstrate how many tokens have been absorbed by HODLers over the past 3 months, we looked at the number of tokens that crossed the age threshold of 3+ months in the past 30 days. Summarize The current market is very interesting, both on-chain and from a macro perspective. Given the enormous uncertainty and risks posed by dynamic conflicts, further de-risking, investor panic, and capitulation events must be approached with caution. However, so far we have not seen a widespread capitulation event, except for very short-term holders, buying at ATHs or selling prematurely on dips. Note that many of the "hyped demand" signals are still well below bull market levels (reported last week). Despite this very uncertain macro and geopolitical factors, the behavior of Bitcoin HODLers maintains a clear bullish conviction. Tokens continue to be withdrawn from exchanges, into increasingly illiquid wallets, and mature into higher and higher age brackets at a rapid rate. These look like long-term holder tokens that are forming. Now, the key will be to see if these consistent trends start to reverse, which could signal a general loss of confidence. Still, these observations paint a rosy and constructive future for Bitcoin.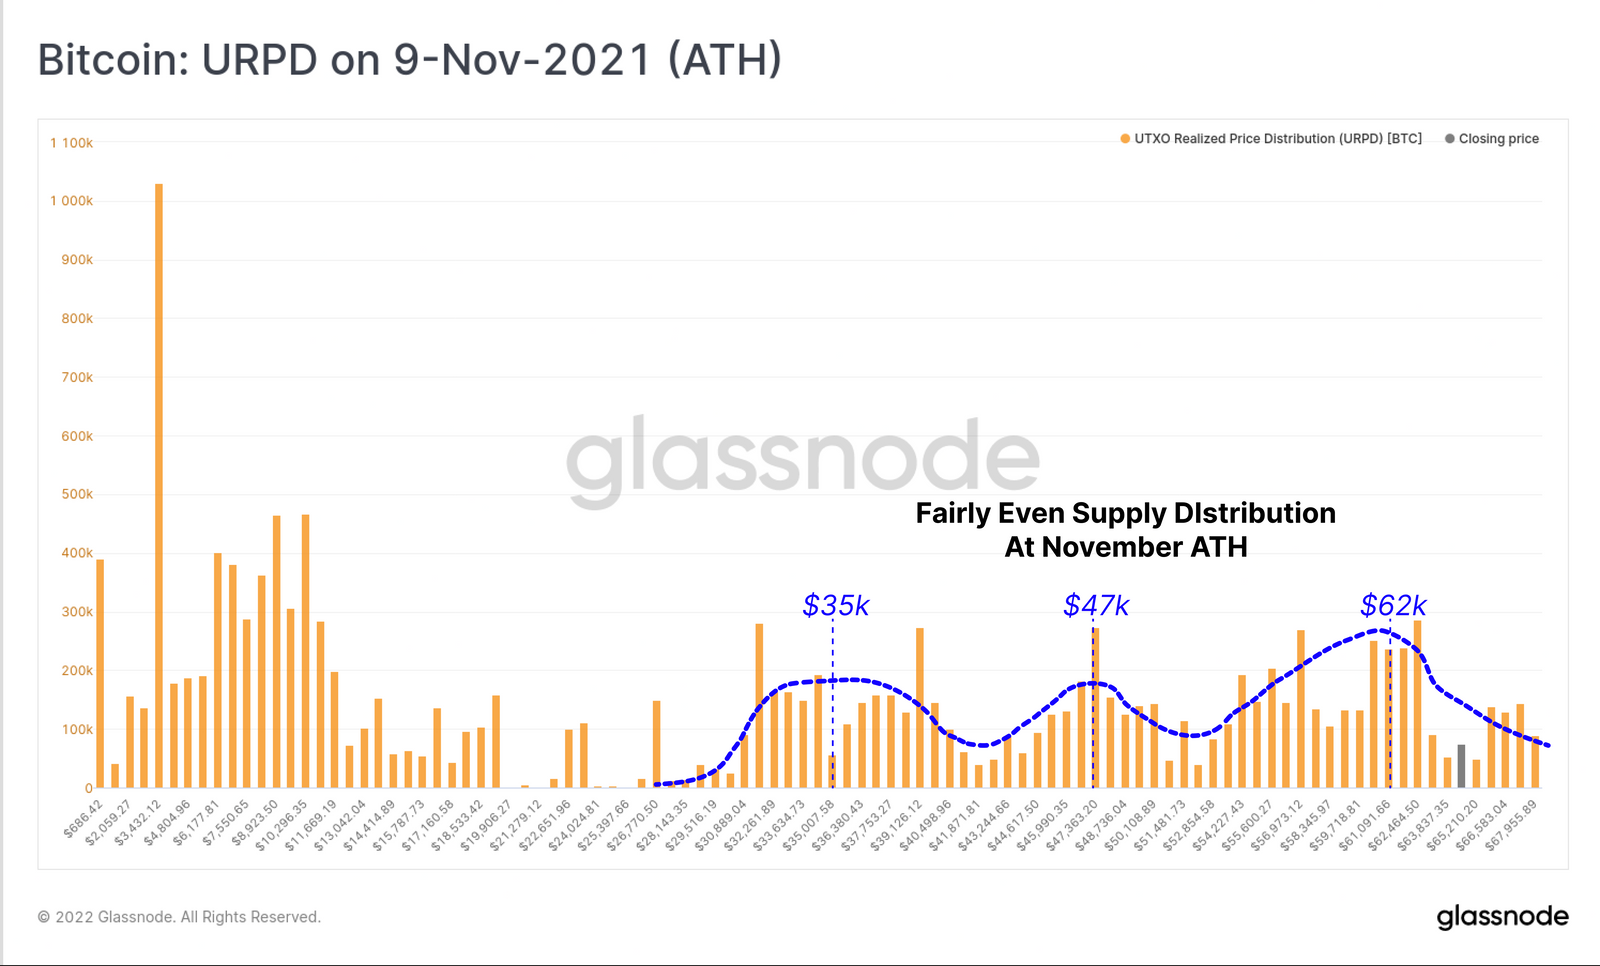
Top buyers may have surrendered
Strong hands keep accumulating
Summarize


