first level title
January 18, 2021 - January 26, 2021
secondary title
Highlights of this report:
This week's market trend: high and weak callback, shrinking and consolidating
Exchange trading volume: The average daily trading volume of the nine major exchanges fell by 25.81%
Digital asset turnover rate: The cumulative turnover rate of the top ten digital assets fell by 6.65% year-on-year
Exchange wallet balance: USDT circulation increased by 1.7%, USDT wallet balance increased by 4.6%
USDT premium rate: The premium rate fluctuates widely, closing at a negative premium in late trading
Bitcoin Volatility Index: The VIX fluctuates in a wide range, and the market sentiment remains greedy
Macro perspective: All kinds of risky assets are generally rising, and the price of Bitcoin is back
Summarize
secondary title
1. The trend of the market this week: high and weak callback, shrinking and consolidatingAs of the statistical time of the report (January 26, 2021), the average total market capitalization of global blockchain assets this week was US$977.00 billion, a decrease of 3.15% from the average value of last week; The weekly average fell by 12.05%.As of the statistical time of the report, the latest point of the Tokenmania 8-week market index is -3.34%, the latest point of the Tokenmania 32-week market index is -4.86%, and the latest point of the Tokenmania 60-week market index is -4.42%.
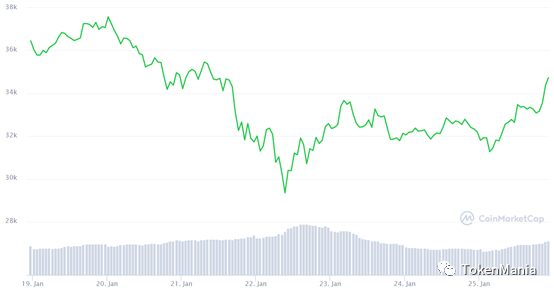
This week, the market surged and came under pressure, the market trading activity fell, and investor sentiment turned from neutral to greedy. At the beginning of the week, the market continued the previous trend and fluctuated at a high level above 100 billion US dollars, and then the market was under pressure and pulled back. It touched a minimum of 84 billion US dollars on Friday, then stabilized and rebounded for a short time, and once again rose above 100 billion US dollars. The price closed at around 94 billion US dollars in late trading , the daily average value of the total market capitalization decreased by 3.15% from last week. In the external market, all kinds of risk assets generally rose this week, and the price of gold rose slightly. Although the rising dollar dragged down the price of gold, the hope of further stimulus plan in the United States made the price of gold rise for the first time in three weeks. From the perspective of the disk, the price of Bitcoin this week has retreated from the previous high, showing a U-shaped trend. It once fell below the $30,000 point in the session. The market rebounded in late trading and failed to rise. In line with the regulatory news, it fell back to the low point in the small area again. Around $31,000. This week, the Grayscale Bitcoin Trust premium rate fell back to a low level last week, and the value rebounded rapidly on Friday. During the same period, the USDT balance on the exchange increased by more than 4.5% compared with last week, and the USDT circulation increased by 1.7%. The North American mining company Marathon Patent Group announced Self-owned funds purchased $150 million worth of Bitcoin, and the trend of capital inflows has not changed. In the long run, the bull market driven by institutional funds has not yet ended; but in the short term, the bottom has not been effectively established after this decline, and there will be a second correction in the market outlook Possibly, you can open a spot position on bargain hunting; the current forward contract basis has increased in amplitude, and it is recommended that futures investors pay attention to risks and strictly control leverage to prevent liquidation caused by pin pullbacks and platform downtime.
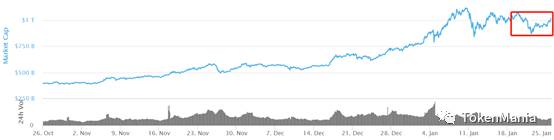
Figure 1 Changes in the total market value of global blockchain assets in the past three monthsSource: CoinMarketCap, TokenMania
Source: CoinMarketCap, TokenMania
secondary title
2. Exchange trading volume: The average daily trading volume of the nine major exchanges rose by 21.35%The total turnover of the nine major exchanges this week was 4.511473 billion yuan, a decrease of 1.569298 billion yuan or 25.81% from last week. From the perspective of transaction volume structure, the top three exchanges with the largest share of transaction volume are Binance (39.67%), Huobi (29.71%), OKEX (21.26%), the trading volume of the top three exchanges accounted for 90.64% of the total trading volume of the nine exchanges, and the proportion of the top three exchanges increased by 0.84% compared with last week; Binance this week Cumulative trading volume decreased by 0.5367 trillion yuan or 23.07% from last week. Huobi’s cumulative trading volume this week decreased by 0.4455 trillion yuan or 24.94% from last week. OKEX’s cumulative trading volume this week decreased by 0.389 trillion compared to last week yuan, a decrease of 28.86%.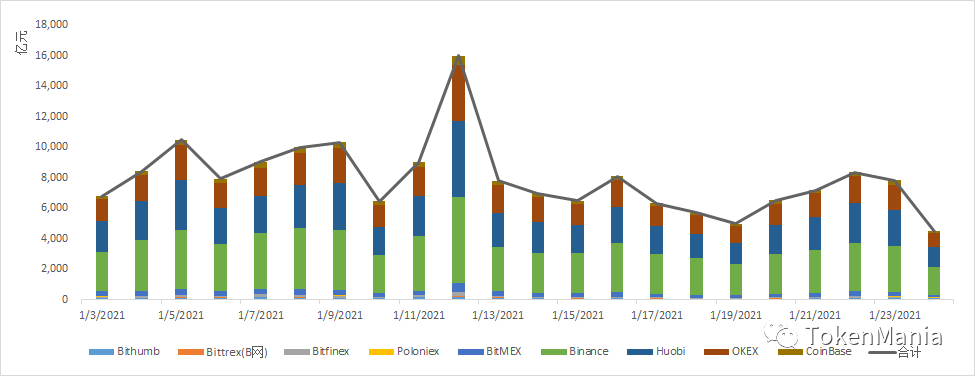
Figure 3 Changes in the total trading volume of the nine major exchanges in the past two weeksSource: Feixiaohao, TokenMania
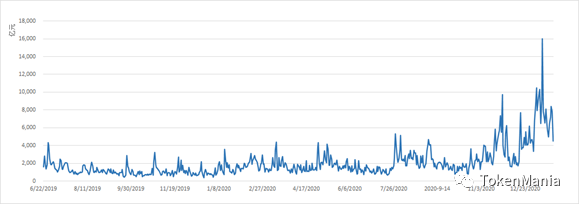
Figure 4 Changes in the historical total daily trading volume of the nine major exchangesSource: Feixiaohao, TokenManiaFrom a longer-term perspective, from the beginning of 2020 to the end of February, the market is positive under the influence of production reduction expectations, and the volume can be enlarged simultaneously; in March, the epidemic spread globally, and the global capital market experienced large fluctuations and panicky declines. Encrypted assets were also hit hard, with a daily trading volume of up to 400 billion yuan; as the global multi-national policies continued to exert force, global assets gradually bottomed out and stabilized under strong stimulus, global risk appetite gradually recovered, and there were obvious signs of bottom-buying funds in the encrypted market. After the panic decline ended, the trading volume of the nine major exchanges fell below 200 billion yuan; the market volume and price increased before the halving of Bitcoin, but the market reaction was flat for a period of time after the completion of the halving, and the volatility narrowed. The range fluctuated, and the trading volume showed a downward trend; after several weeks of range adjustment, the BTC price broke through upwards, and this week the price remained high and volatile. , a decrease of 25.81%. Considering the current trading volume behavior in major exchanges, the actual transaction data may be lower than the statistical data.The global Bitcoin OTC transaction volume increased by 0.24% to 46,539,479 US dollars, the Chinese Bitcoin OTC transaction volume decreased by 23.67% to 12,818,867 yuan, and the Venezuelan Bitcoin OTC transaction volume decreased by 1.14% to 7,248,595,380,249 billion bolivars. Calculated based on the conversion ratio between Bolivar and RMB (1 CNY = 267913.3503VES), the off-site BTC transaction volume in the last week was about 27.05575 million yuan.
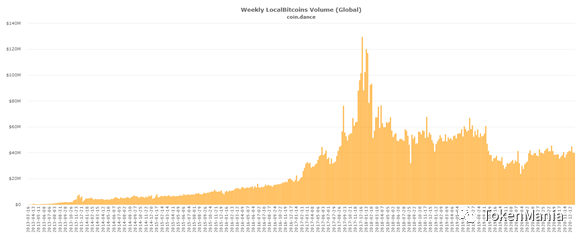
Figure 5 LocalBitcoins global trading volumeSource: Coin.Dance, TokenMania
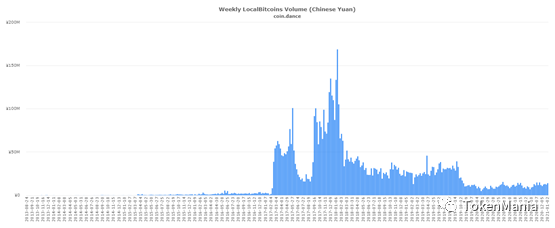
Figure 6 LocalBitcoins transaction volume in ChinaSource: Coin.Dance, TokenMania
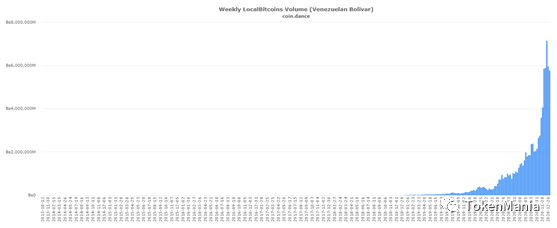
Figure 7 LocalBitcoins trading volume in Venezuela
[Note]: The nine major exchanges refer to: Binance, Huobi, OKEX, CoinBase, Poloniex, Bitmex, Bittrex, Bitfinex, Bithumb
secondary title
3. Digital asset turnover rate: The cumulative turnover rate of the top ten digital assets fell by 6.65% year-on-yearThe turnover rate of the top ten digital assets this week accumulated to 58.33%, a decrease of 4.16% or 6.65% from last week; the highest average turnover rate this week was 72.678%, the lowest was 57.24%, and the extreme value difference was 15.438 percentage points, of which XRP had the lightest decline, down 9.36% from last week, down 6.78%.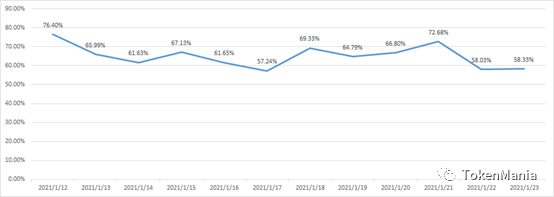
Figure 8 Changes in the daily average turnover rate of the top ten assets in the past two weeks
Source: CoinMarketCap, TokenMania
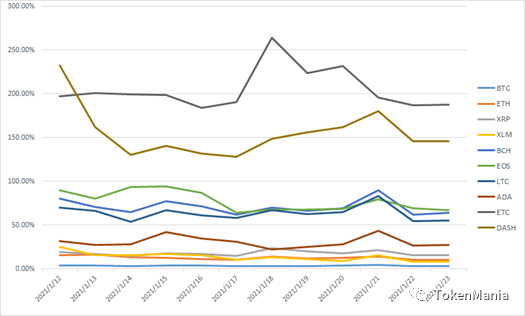
Figure 9 Breakdown of the turnover rate of the top ten assets in the past two weeksSource: CoinMarketCap, TokenMania[Note] The turnover rate is the daily average of the top ten currencies (BTC, ETH, XRP, XLM, BCH, EOS, LTC, ADA, ETC, DASH).
secondary title
4. Exchange wallet balance: USDT circulation increased by 1.7%, USDT wallet balance increased by 4.6%This week, the BTC wallet balance of the exchange was 2,007,570 BTC, an increase of 0.44% over the same period last week; the USDT balance of the exchange was 12.3384 billion USDT, an increase of 4.56% over the same period last week; the current total USDT circulation (including Omni, ERC-20, TRC- 20) It was US$24.8174 billion, an increase of 1.7% over the same period last week.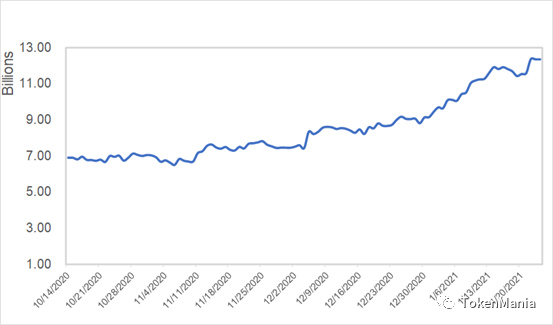
Figure 10 Changes in total balance of USDT on exchanges
[Note] Exchange wallet balance is comprehensive data covering multiple mainstream exchanges such as Binance, Bitfinex, OKEX, etc.
secondary title
5. USDT premium rate: the premium rate fluctuated within a narrow range, and maintained a positive premium in late tradingThe off-market premium rate reflects the premium level of off-market prices, and is also a tool to capture the sentiment of off-market funds. Generally speaking, a high premium rate means that the sentiment of off-market funds entering the market is positive, and vice versa. High, even the funds are fleeing; the market premium rate reflects the premium level of the market price, and is also a tool to capture the sentiment of funds in the market.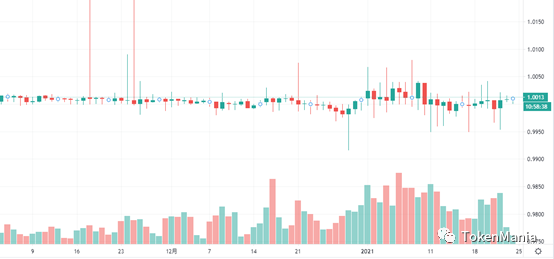
Figure 11 Kraken USDT/USD trading pair priceSource: Tradingview, TokenMania[Note] When the USDT discount premium index is 100, it means USDT parity, if the index is greater than 100, it means USDT premium, and if it is less than 100, it means USDT discount.
secondary title
6. Bitcoin Volatility Index: The volatility index fluctuates upwards, and the market sentiment is extremely greedyGenerally speaking, the Bitcoin price volatility index can be used to measure the degree of panic in the market, and the higher the value, the higher the degree of divergence in the market outlook.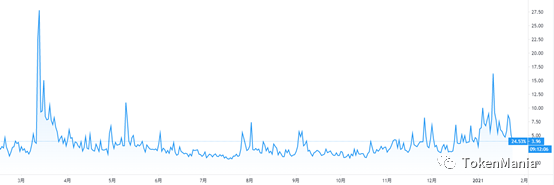
Figure 12 level Bitcoin BVOL24H volatility
Source: BitMEX, TokenMania
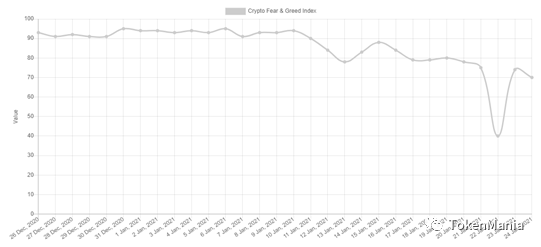
Figure 13 Fear & Greed IndexThis week, the Bitcoin Volatility Index fluctuated widely, with a drop of 32.99% in late trading compared with the same period last week; the opening value was 5.91, the highest value was 10.18, the lowest value was 3.96, and the closing value was 3.96; the fear & greed index was 79 points 7 days ago, the highest this week It is 80 points, the lowest is 40 points, and the latest point of the Fear & Greed Index is 70 points, which is a significant drop from the same period last week. This week, the market sentiment has turned from neutral to greedy.
secondary title
7. Futures contracts: contract basis spreads increased, and short-term futures maintained premiumsFrom the perspective of futures contracts, the trading activity of the market dropped slightly this week, the contract basis spread increased, and short-term contracts maintained premiums. CME BTC futures formed a gap of "32560-33679.5 US dollars" this week, and the bitcoin options market currently accounts for about 33% of the open positions in the futures market. From the perspective of term structure, the average premium of OKEX’s weekly contracts this week is 0.319%, with a premium down by 0.54 percentage points; the average premium of next-week contracts is 0.744%, with a premium down by 0.754 percentage points; the average quarterly contract premium is 3.924%, with a premium down 1.425 percentage points; the average premium of BitMEX perpetual contracts was 0.006%, and the premium dropped by 0.65 percentage points. This week, OKEX's weekly contract price has the latest premium of 0.316%, the latest premium of the next week's contract is 0.721%, and the latest premium of the quarterly contract is 3.46%. This week, the market sentiment has turned from neutral to greedy. The amplitude of the forward contract basis has increased. It is recommended that futures investors pay attention to risks and strictly control their positions to prevent liquidation caused by pin pullbacks and platform downtime.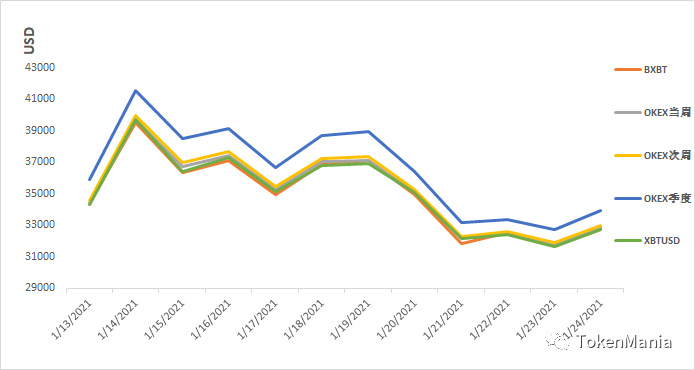
Figure 14 Bitcoin futures and spot price trends in the past two weeks
Source: OKEX, BitMEX, TokenMania
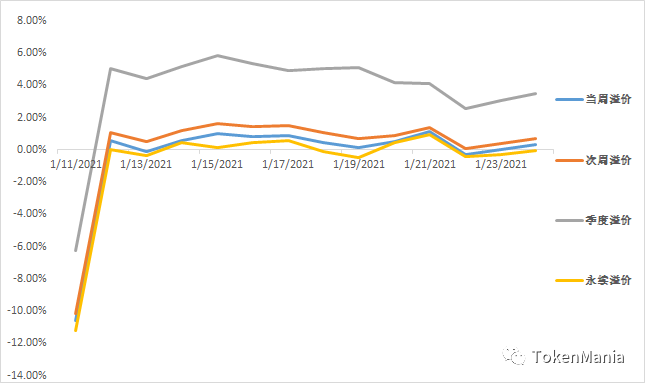
Figure 15 Bitcoin futures premium and discount rate in the past two weeks[Note] The futures premium and discount rate in the report is calculated based on BitMEX's BXBT spot data
secondary title8. Macro perspective: each
Risk-like assets generally rise, Bitcoin price pulls backFrom the perspective of asset allocation, digital currency is worthy of partial allocation as an alternative asset. For investors, the differentiated return on assets of various assets reflects the importance of asset allocation. According to investment needs, funds are allocated among different asset classes. With the diversification of asset classes, a wider investment portfolio can usually bring higher long-term returns under the same risk conditions.Various risk assets generally rose this week, the price of gold rose slightly, and the price of Bitcoin fell. In terms of U.S. stocks, the three major U.S. stock indexes rose again this week. The Dow rose 0.59%, the S&P 500 rose 1.94%, and the Nasdaq rose 4.19%. The Nasdaq hit a new high. A higher U.S. dollar dragged down gold prices, but hopes of further U.S. stimulus led to its first weekly rise in three weeks. COMEX gold futures closed up 1.44% at $1,855.5 an ounce; The cumulative increase was 16 basis points; the April oil contract rose 0.2% to $55.21 a barrel. In terms of domestic stock markets, the Shanghai Composite Index rose by 1.13%, the Shenzhen Component Index rose by 3.97%; the ChiNext Index rose by more than 8%, the largest weekly gain in half a year; the net inflow of Hong Kong Stock Connect funds this week was 95.481 billion Hong Kong dollars, creating a record for Shanghai, Shenzhen and Hong Kong stocks The weekly net inflow scale has reached a new high since the opening of the channel, and it has flowed into the computer, communication and petroleum and petrochemical industries.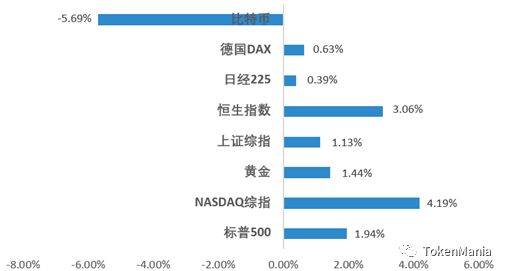
Figure 16 Comparison of dynamic return rates of various assets this weekSource: Straight Flush, TokenManiaComparing the dynamic rate of return of various assets in the past three years, the performance of Bitcoin is thriving. In the past three years, the dynamic rate of return of Bitcoin is 3274.10%, ranking first among all types of assets, and there is a large gap with the rate of return of other assets. Except for digital currencies, other asset yields were divided. U.S. stocks performed relatively well. The S&P 500 Index rose by 35.38%, and the Nasdaq Composite Index rose by 82.64%. In addition, the Shanghai Composite Index rose by 1.33%, and gold rose by 36.86%.
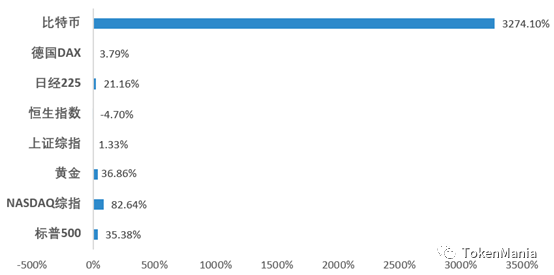
Figure 17 Comparison of Dynamic Return Rates of Various Assets in the Past Three YearsAmong all kinds of assets, the market value of digital currency fluctuates the most. During the process of bubble expansion and bubble burst, the price of digital currency tends to show a trend of skyrocketing and plummeting. Since 2020, the market has been affected by the liquidity crisis brought about by the global epidemic, and Bitcoin has experienced a sharp correction; recently, the market has risen sharply, and the price has repeatedly hit record highs. However, in the long run, digital currencies are relatively low in valuation. With the bubble The extrusion of digital currency is worth some configuration.
secondary title
The trend of the market: this week, the market soared and came back under pressure, the market trading activity fell, and investor sentiment turned from neutral to greedy. At the beginning of the week, the market continued the previous trend and fluctuated at a high level above 100 billion US dollars, and then the market was under pressure and pulled back. It touched a minimum of 84 billion US dollars on Friday, then stabilized and rebounded for a short time, and once again rose above 100 billion US dollars. The price closed at around 94 billion US dollars in late trading , the daily average value of the total market capitalization decreased by 3.15% from last week. In the external market, all kinds of risk assets generally rose this week, and the price of gold rose slightly. Although the rising dollar dragged down the price of gold, the hope of further stimulus plan in the United States made the price of gold rise for the first time in three weeks. From the perspective of the disk, the price of Bitcoin this week has retreated from the previous high, showing a U-shaped trend. It once fell below the $30,000 point in the session. The market rebounded in late trading and failed to rise. In line with the regulatory news, it fell back to the low point in the small area again. Around $31,000. This week, the Grayscale Bitcoin Trust premium rate fell back to a low level last week, and the value has rebounded rapidly since Friday. The USDT balance on the exchange has increased by more than 4.5% compared with the same period last week, and the USDT circulation has increased by 1.7%. The North American mining company Marathon Patent Group announced Self-owned funds purchased $150 million worth of Bitcoin, and the trend of capital inflows has not changed. In the long run, the bull market driven by institutional funds has not yet ended; but in the short term, the bottom has not been effectively established after this decline, and there may be a second correction in the market outlook , You can open positions and hold them on dips; the current forward contract basis has increased in amplitude, it is recommended that futures investors pay attention to risks and strictly control leverage, and prevent liquidation caused by pin pullbacks and platform downtime.Exchange trading volume: The average daily trading volume of the nine major exchanges fell by 25.81%. The total turnover of the nine major exchanges this week was 4.511473 billion yuan, a decrease of 1.569298 billion yuan or 25.81% from last week. From the perspective of transaction volume structure, the top three exchanges with the largest share of transaction volume are Binance (39.67%), Huobi (29.71%), OKEX (21.26%), the trading volume of the top three exchanges accounted for 90.64% of the total trading volume of the nine exchanges, and the proportion of the top three exchanges increased by 0.84% compared with last week; Binance this week Cumulative trading volume decreased by 0.5367 trillion yuan or 23.07% from last week. Huobi’s cumulative trading volume this week decreased by 0.4455 trillion yuan or 24.94% from last week. OKEX’s cumulative trading volume this week decreased by 0.389 trillion compared to last week yuan, a decrease of 28.86%.From a longer-term perspective, from the beginning of 2020 to the end of February, the market is positive under the influence of production reduction expectations, and the volume can be enlarged simultaneously; in March, the epidemic spread globally, and the global capital market experienced large fluctuations and panicky declines. Encrypted assets were also hit hard, with a daily trading volume of up to 400 billion yuan; as the global multi-national policies continued to exert force, global assets gradually bottomed out and stabilized under strong stimulus, global risk appetite gradually recovered, and there were obvious signs of bottom-buying funds in the encrypted market. After the panic decline ended, the trading volume of the nine major exchanges fell below 200 billion yuan; the market volume and price increased before the halving of Bitcoin, but the market reaction was flat for a period of time after the completion of the halving, and the volatility narrowed. The range fluctuated, and the trading volume showed a downward trend; after several weeks of range adjustment, the BTC price broke through upwards, and this week the price remained high and volatile. , a decrease of 25.81%. Considering the current trading volume behavior in major exchanges, the actual transaction data may be lower than the statistical data.The global Bitcoin OTC transaction volume increased by 0.24% to 46,539,479 US dollars, the Chinese Bitcoin OTC transaction volume decreased by 23.67% to 12,818,867 yuan, and the Venezuelan Bitcoin OTC transaction volume decreased by 1.14% to 7,248,595,380,249 billion bolivars. Calculated based on the conversion ratio between Bolivar and RMB (1 CNY = 267913.3503VES), the off-site BTC transaction volume in the last week was about 27.05575 million yuan.Digital asset turnover rate: The cumulative turnover rate of the top ten digital assets fell by 6.65% year-on-year. The turnover rate of the top ten digital assets this week accumulated to 58.33%, a decrease of 4.16% or 6.65% from last week; the highest average turnover rate this week was 72.678%, the lowest was 57.24%, and the extreme value difference was 15.438 percentage points, of which XRP had the lightest decline, down 9.36% from last week, down 6.78%.The top three cumulative turnover rates this week are ETC (1479.98% this week, down 121.79% or 7.6% from last week), DASH (1065.96% this week, down 283.34% or 21.0% from last week) , EOS (484.34% this week, down 252.02% from last week, down 34.23%); the last three in the cumulative turnover rate are BTC (24.44% this week, down 3.68% from last week, down 13.09%), XLM (76.04% this week, down 90.86% from last week, down 54.44%), ETH (82.38% this week, down 17.05% from last week, down 17.15%).Exchange wallet balance: USDT circulation increased by 1.7%, and USDT wallet balance increased by 4.6%. This week, the BTC wallet balance of the exchange was 2,007,570 BTC, an increase of 0.44% over the same period last week; the USDT balance of the exchange was 12.3384 billion USDT, an increase of 4.56% over the same period last week; the current total USDT circulation (including Omni, ERC-20, TRC- 20) It was US$24.8174 billion, an increase of 1.7% over the same period last week.USDT premium rate: The premium rate fluctuated within a narrow range, and maintained a positive premium in late trading. The USDT premium rate fluctuated upwards this week, and remained positive at the end of the session. The USDT/USD trading pair on the Kraken exchange opened at a premium of -0.02%, with a maximum premium of 0.42%, a minimum premium of -0.50%, and a closing premium of 0.12%.Bitcoin Volatility Index: The volatility index fluctuates in a wide range, and the market sentiment remains greedy. This week, the Bitcoin Volatility Index fluctuated widely, with a drop of 32.99% in late trading compared with the same period last week; the opening value was 5.91, the highest value was 10.18, the lowest value was 3.96, and the closing value was 3.96; the fear & greed index was 79 points 7 days ago, the highest this week It is 80 points, the lowest is 40 points, and the latest point of the Fear & Greed Index is 70 points, which is a significant drop from the same period last week. This week, the market sentiment has turned from neutral to greedy.Macro perspective: All kinds of risk assets generally rose this week, the price of gold rose slightly, and the price of Bitcoin fell. In terms of U.S. stocks, the three major U.S. stock indexes rose again this week. The Dow rose 0.59%, the S&P 500 rose 1.94%, and the Nasdaq rose 4.19%. The Nasdaq hit a new high. A higher U.S. dollar dragged down gold prices, but hopes of further U.S. stimulus led to its first weekly rise in three weeks. COMEX gold futures closed up 1.44% at $1,855.5 an ounce; The cumulative increase was 16 basis points; the April oil contract rose 0.2% to $55.21 a barrel. In terms of domestic stock markets, the Shanghai Composite Index rose by 1.13%, the Shenzhen Component Index rose by 3.97%; the ChiNext Index rose by more than 8%, the largest weekly gain in half a year; the net inflow of Hong Kong Stock Connect funds this week was 95.481 billion Hong Kong dollars, creating a record for Shanghai, Shenzhen and Hong Kong stocks The weekly net inflow scale has reached a new high since the opening of the channel, and it has flowed into the computer, communication and petroleum and petrochemical industries.Regulatory policies at home and abroad exceed expectationsChanges in the international geo-environment exceed expectationsBitcoin contract price fluctuationsdisclaimer
disclaimer
TAMC Research Institute does not have any relationship with digital assets or other third parties involved in this report that may affect the objectivity, independence, and impartiality of the report.
The materials and data cited in this report come from compliance channels. The sources of the materials and data are considered reliable by TAMC Research Institute, and necessary verifications have been carried out for their authenticity, accuracy and completeness. However, TAMC Research Institute is not responsible for makes no warranty as to its truth, accuracy or completeness.
The content of the report is for reference only, and the facts and opinions in the report do not constitute any investment advice on relevant digital assets. TAMC Research Institute shall not be liable for any losses arising from the use of the contents of this report, unless expressly stipulated by laws and regulations. Readers should not make investment decisions solely based on this report, nor should they lose the ability to make independent judgments based on this report.
The information, opinions and speculations contained in this report only reflect the judgment of the researchers on the date of finalizing this report. In the future, based on industry changes and updates of data information, there is a possibility of updating opinions and judgments.