secondary title
December 22, 2020 - December 29, 2020Highlights of this report:Highlights of this report:
This week's market trend: heavy volume breaks through to a new level, market sentiment is extremely greedy
Exchange trading volume: The average daily trading volume of the nine major exchanges rose by 21.35%
USDT premium rate: The premium rate fluctuates widely, closing at a negative premium in late trading
USDT premium rate: The premium rate fluctuates widely, closing at a negative premium in late trading
Bitcoin Volatility Index: The VIX fluctuates in a wide range, and the market sentiment remains greedy
Bitcoin Volatility Index: The VIX fluctuates in a wide range, and the market sentiment remains greedy
Summarize
Summarize
Details of this report:
Details of this report:
1. This week's market trend: heavy volume breakthroughs reached a new level, market sentiment is extremely greedy
As of the statistical time of the report (December 29, 2020), the average total market value of global blockchain assets this week was US$682.123 billion, an increase of 12.32% from the average value of last week; The weekly average rose 18.32%.
As of the statistical time of the report, the latest point of the Tokenmania 8-week market index is 14.05%, the latest point of the Tokenmania 32-week market index is 12.83%, and the latest point of the Tokenmania 60-week market index is 11.21%.
Figure 1 Changes in the total market value of global blockchain assets in the past three months
Figure 1 Changes in the total market value of global blockchain assets in the past three monthsSource: CoinMarketCap, TokenManiaSource: CoinMarketCap, TokenMania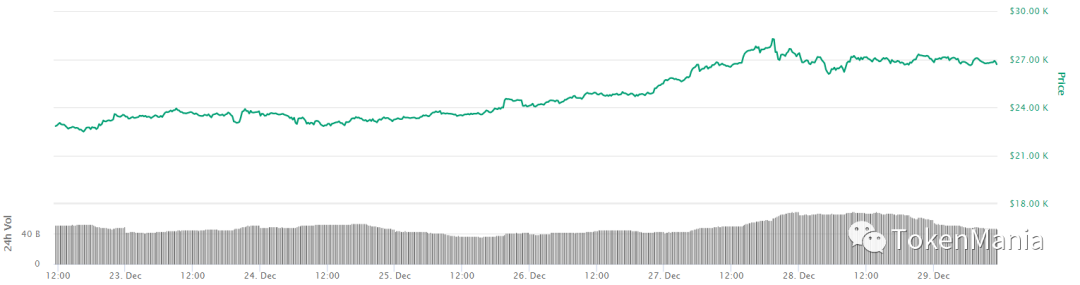 Source: CoinMarketCap, TokenMania2. Exchange trading volume: The average daily trading volume of the nine major exchanges rose by 21.35%Figure 4 Changes in the historical total daily trading volume of the nine major exchangesFigure 3 Changes in the total trading volume of the nine major exchanges in the past two weeks
Source: Feixiaohao, TokenManiaFigure 4 Changes in the historical total daily trading volume of the nine major exchanges
Source: Feixiaohao, TokenManiaSource: Feixiaohao, TokenManiaSource: Coin.Dance, TokenManiaFigure 5 LocalBitcoins global trading volumeSource: Coin.Dance, TokenManiaFigure 6 LocalBitcoins transaction volume in China
Source: Coin.Dance, TokenManiaFigure 7 LocalBitcoins trading volume in Venezuela
Source: Coin.Dance, TokenMania
[Note]: The nine major exchanges refer to: Binance, Huobi, OKEX, CoinBase, Poloniex, Bitmex, Bittrex, Bitfinex, Bithumb[Note]: The nine major exchanges refer to: Binance, Huobi, OKEX, CoinBase, Poloniex, Bitmex, Bittrex, Bitfinex, BithumbFigure 9 Breakdown of the turnover rate of the top ten assets in the past two weeksFigure 8 Changes in the daily average turnover rate of the top ten assets in the past two weeks
Source: CoinMarketCap, TokenMania
Figure 9 Breakdown of the turnover rate of the top ten assets in the past two weeksSource: CoinMarketCap, TokenManiaThe top three cumulative turnover rates this week are EOS (1130.29% this week, up 539.51% or 91.32% from last week), LTC (1065.32% this week, up 287.51% or 36.96% from last week) , ETC (1018.31% this week, up 318.08% from last week, up 45.42%); the last three in the cumulative turnover rate are BTC (74.62% this week, up 6.09% from last week, up 8.88%), ETH (157.45% this week, up 18.12% from last week, up 13.00%), XLM (187.19% this week, up 49.34% from last week, up 35.79%).[Note] The turnover rate is the daily average of the top ten currencies (BTC, ETH, XRP, XLM, BCH, EOS, LTC, ADA, ETC, DASH).[Note] The turnover rate is the daily average of the top ten currencies (BTC, ETH, XRP, XLM, BCH, EOS, LTC, ADA, ETC, DASH).This week, the BTC wallet balance on the exchange was 2,054,070 BTC, a decrease of 1% from the same period last week; the USDT balance on the exchange was 9,028.3 million USDT, an increase of 2.7% from the same period last week; 20) It was 20.7532 billion US dollars, an increase of 4.63% over the same period last week.Figure 10 Changes in total balance of USDT on exchanges[Note] Exchange wallet balance is comprehensive data covering multiple mainstream exchanges such as Binance, Bitfinex, OKEX, etc.Figure 11 Kraken USDT/USD trading pair priceThe off-market premium rate reflects the premium level of off-market prices, and is also a tool to capture the sentiment of off-market funds. Generally speaking, a high premium rate means that the sentiment of off-market funds entering the market is positive, and vice versa. High, even the funds are fleeing; the market premium rate reflects the premium level of the market price, and is also a tool to capture the sentiment of funds in the market.Figure 11 Kraken USDT/USD trading pair priceSource: Tradingview, TokenManiaFigure 13 Fear & Greed Index[Note] When the USDT discount premium index is 100, it means USDT parity, if the index is greater than 100, it means USDT premium, and if it is less than 100, it means USDT discount.6. Bitcoin Volatility Index: The volatility index fluctuates upwards, and the market sentiment is extremely greedyGenerally speaking, the Bitcoin price volatility index can be used to measure the degree of panic in the market, and the higher the value, the higher the degree of divergence in the market outlook.Figure 12 level Bitcoin BVOL24H volatilitySource: BitMEX, TokenManiaFigure 13 Fear & Greed Index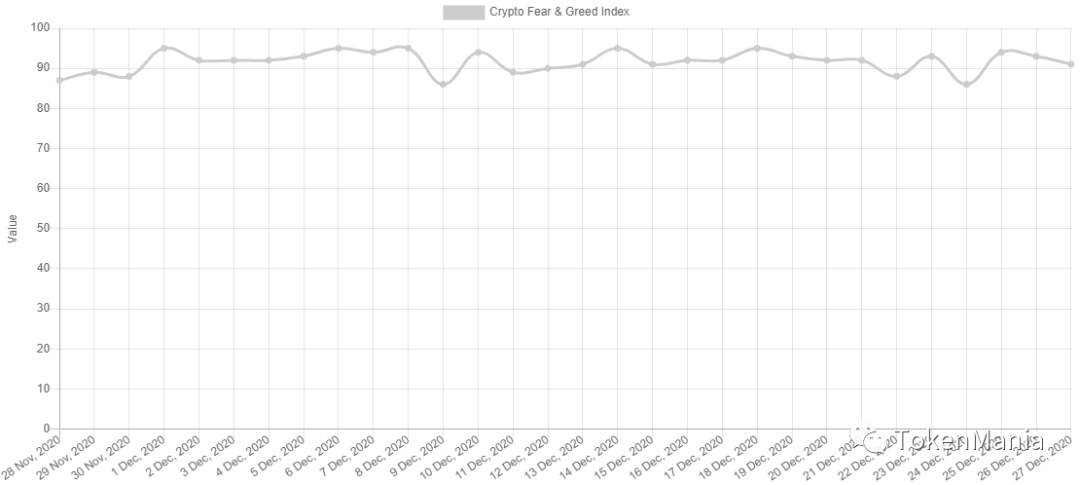 Source: Alternative.me, TokenManiaSource: Alternative.me, TokenManiaThis week, the Bitcoin volatility index fluctuated widely, with an increase of 83% in late trading compared with the same period last week; the opening value was 3.51, the highest value was 6.53, the lowest value was 2.75, and the closing value was 6.53; the fear & greed index was 92 points 7 days ago, the highest this week The latest point of the Fear & Greed Index is 91 points, which is a slight drop from 92 points in the same period last week. With the price of Bitcoin breaking through its historical high, the market sentiment remains extremely greedy.Source: OKEX, BitMEX, TokenManiaFigure 14 Bitcoin futures and spot price trends in the past two weeksSource: OKEX, BitMEX, TokenMania
Figure 15 Bitcoin futures premium and discount rate in the past two weeks
Source: OKEX, BitMEX, TokenMania[Note] The futures premium and discount rate in the report is calculated based on BitMEX's BXBT spot data8. Macro perspective: All kinds of risky assets generally fell, and Bitcoin’s growth was thrivingFrom the perspective of asset allocation, digital currency is worthy of partial allocation as an alternative asset. For investors, the differentiated return on assets of various assets reflects the importance of asset allocation. According to investment needs, funds are allocated among different asset classes. With the diversification of asset classes, a wider investment portfolio can usually bring higher long-term returns under the same risk conditions.Figure 16 Comparison of dynamic return rates of various assets this weekFigure 16 Comparison of dynamic return rates of various assets this week
Source: Straight Flush, TokenManiaAmong all kinds of assets, the market value of digital currency fluctuates the most. During the process of bubble expansion and bubble burst, the price of digital currency tends to show a trend of skyrocketing and plummeting. Since 2020, the market has been affected by the liquidity crisis brought about by the global epidemic, and Bitcoin has experienced a sharp correction; recently, the market has risen sharply, and the price has repeatedly hit record highs. However, in the long run, digital currencies are relatively low in valuation. With the bubble The extrusion of digital currency is worth some configuration.Figure 17 Comparison of Dynamic Return Rates of Various Assets in the Past Three Years
Source: Straight Flush, TokenManiaAmong all kinds of assets, the market value of digital currency fluctuates the most. During the process of bubble expansion and bubble burst, the price of digital currency tends to show a trend of skyrocketing and plummeting. Since 2020, the market has been affected by the liquidity crisis brought about by the global epidemic, and Bitcoin has experienced a sharp correction; recently, the market has risen sharply, and the price has repeatedly hit record highs. However, in the long run, digital currencies are relatively low in valuation. With the bubble The extrusion of digital currency is worth some configuration.Market trend: This week, the market continued to break through to new highs in the near future, the market trading sentiment was hot, investors remained extremely greedy, and institutional investors accelerated their deployment. At the beginning of the week, the market remained in the range of 620 billion to 670 billion US dollars. After a few days of trading around 650 billion US dollars, the market entered an accelerated channel on Friday, breaking through the 650 billion and 700 billion US dollars one after another. After a slight correction, it closed at around US$705 billion, and the daily average value of the total market value rose by 12.32% from last week. In the external market, institutions often take profits at the end of the year in order to lock in annual income, leading to a correction in sectors with higher gains. This week, the market sentiment is relatively cold. Various risk assets generally closed down slightly. The price of gold fell slightly. .This week, Bitcoin's market value accounted for 70.16%, and it returned to above 70% for the first time since March 2017. From the perspective of the disk, this week, the price of Bitcoin has increased in volume and momentum. It broke through the previous high and continued to break through. The highest point was close to $28,500, setting a new record high. Although the upward process experienced a slight correction, the overall trend remained healthy. The support levels of various indicators moved up, and the upward trend of disk shocks has not yet been broken. Ethereum broke through $660 in late trading, attracting more Over-the-counter funds are concerned; during the same period, the total USDT circulation increased by more than 3% this week, and institutional funds are still accelerating their entry. The short-term market maintains a bullish sentiment, and the support below 26,000 points is effective; overall, the current increase in institutional holdings has boosted prices. The logic remains unchanged, and the probability of a sharp drop to the bottom is low. Before it falls below the short-term moving average, you can follow the trend and continue to hold after strictly setting the stop loss point. In addition, this week, Bitcoin futures once again experienced short-term pin insertions. The current overall basis of Bitcoin futures has increased. Investors are expected to pay attention to risks and reduce leverage.Exchange trading volume: The average daily trading volume of the nine major exchanges rose by 65.43%. The total turnover of the nine major exchanges this week was 2.53438 billion yuan, an increase of 1002.392 billion yuan from last week, an increase of 65.43%. From the perspective of transaction volume structure, the top three exchanges in terms of transaction volume are Binance (39.17%), Huobi (29.73%), OKEX (21.50%), the trading volume of the top three exchanges accounted for 90.40% of the total trading volume of the nine exchanges, and the proportion of the top three exchanges decreased by 0.03% compared with last week; Binance this week The cumulative trading volume increased by 370.523 billion yuan, an increase of 59.56%, compared with last week. The cumulative trading volume of Huobi this week increased by 312.363 billion yuan, an increase of 70.81%. It was 69.17%.The global Bitcoin OTC transaction volume decreased by 0.302% to 41.309718 million US dollars, the Chinese Bitcoin OTC transaction volume increased by 16.42% to 12.415083 million yuan, and the Venezuelan Bitcoin OTC transaction volume increased by 0.6899% to 5891.3653 billion Bolivars. Based on the exchange rate between Bolivar and RMB (1 CNY = 160845VES), the OTC BTC transaction volume in the last week was about 36.2276 million yuan.Digital asset turnover rate: The cumulative turnover rate of the top ten digital assets rose by 28.84%. This week, the turnover rate of the top ten digital assets accumulated 370.46%, an increase of 82.92% and 28.84% compared with last week; the highest turnover rate was 81.92%, the lowest was 31.80%, and the extreme value difference was 50.12 percentage points. Among them, BCH ranked first, with a cumulative turnover rate of 450.45% this week, an increase of 84.26% from last week.The top three cumulative turnover rates this week are LTC (777.81% this week, up 264.02% or 51.39% from last week), ETC (700.23% this week, up 83.74% or 13.58% from last week) , EOS (590.78% this week, up 70.99% or 13.66% from last week); the last three in the cumulative turnover rate are BTC (68.53% this week, up 12.42% from last week, or 22.14%), ADA (114.06% this week, down 12.45% from last week, down 9.84%), XLM (137.85% this week, up 17.88% from last week, up 14.90%).Exchange wallet balance: USDT balance increased by 3.45%, and total USDT circulation increased by 2.35%. This week, the BTC wallet balance on the exchange was 2,054,070 BTC, a decrease of 1% from the same period last week; the USDT balance on the exchange was 9,028.3 million USDT, an increase of 2.7% from the same period last week; 20) It was 20.7532 billion US dollars, an increase of 4.63% over the same period last week.USDT premium rate: The premium rate fluctuated widely and closed at a negative premium in late trading. This week, the USDT premium rate fluctuated and declined. USDT once fell below the 6.4 mark, and maintained a negative premium in late trading. The USDT/USD trading pair on the Kraken exchange opened with a premium of 0.11% this week, with a maximum premium of 0.75%, a minimum premium of -0.31%, and a closing premium of -0.14%; with the overall surge in the market, Bitcoin set another historical record, and the USDT premium rate widened Shock, this week's overall downside closed at a negative premium.Bitcoin Volatility Index: The volatility index fluctuated upwards, and the market sentiment was extremely greedy. This week, the Bitcoin volatility index fluctuated widely, with an increase of 83% in late trading compared with the same period last week; the opening value was 3.51, the highest value was 6.53, the lowest value was 2.75, and the closing value was 6.53; the fear & greed index was 92 points 7 days ago, the highest this week The latest point of the Fear & Greed Index is 91 points, which is a slight drop from 92 points in the same period last week. As the price of Bitcoin continues to rise, the market sentiment remains extremely greedy.The content of the report is for reference only, and the facts and opinions in the report do not constitute any investment advice on relevant digital assets. TAMC Research Institute shall not be liable for any losses arising from the use of the contents of this report, unless expressly stipulated by laws and regulations. Readers should not make investment decisions solely based on this report, nor should they lose the ability to make independent judgments based on this report.Regulatory policies at home and abroad exceed expectationsChanges in the international geo-environment exceed expectationsThe risk of further spread of the epidemicBitcoin contract price fluctuationsdisclaimer
TAMC Research Institute does not have any relationship with digital assets or other third parties involved in this report that may affect the objectivity, independence, and impartiality of the report.
The materials and data cited in this report come from compliance channels. The sources of the materials and data are considered reliable by TAMC Research Institute, and necessary verifications have been carried out for their authenticity, accuracy and completeness. However, TAMC Research Institute is not responsible for makes no warranty as to its truth, accuracy or completeness.
The content of the report is for reference only, and the facts and opinions in the report do not constitute any investment advice on relevant digital assets. TAMC Research Institute shall not be liable for any losses arising from the use of the contents of this report, unless expressly stipulated by laws and regulations. Readers should not make investment decisions solely based on this report, nor should they lose the ability to make independent judgments based on this report.
The information, opinions and speculations contained in this report only reflect the judgment of the researchers on the date of finalizing this report. In the future, based on industry changes and updates of data information, there is a possibility of updating opinions and judgments.
The information, opinions and speculations contained in this report only reflect the judgment of the researchers on the date of finalizing this report. In the future, based on industry changes and updates of data information, there is a possibility of updating opinions and judgments.