OKEX Investment Research: There are signs of decoupling between Bitcoin and US stocks, and the rebound is rapid


Written by: OKEx analyst Yan Song
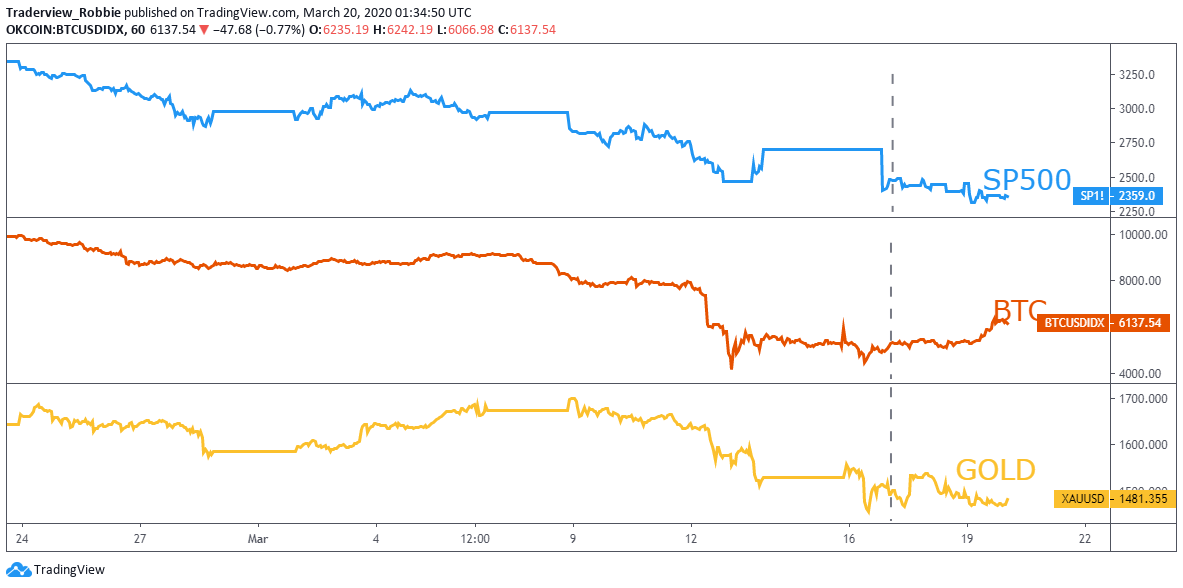
Bitcoin shows signs of decoupling from U.S. stocks midweek
200-week moving average takes over Bitcoin price again
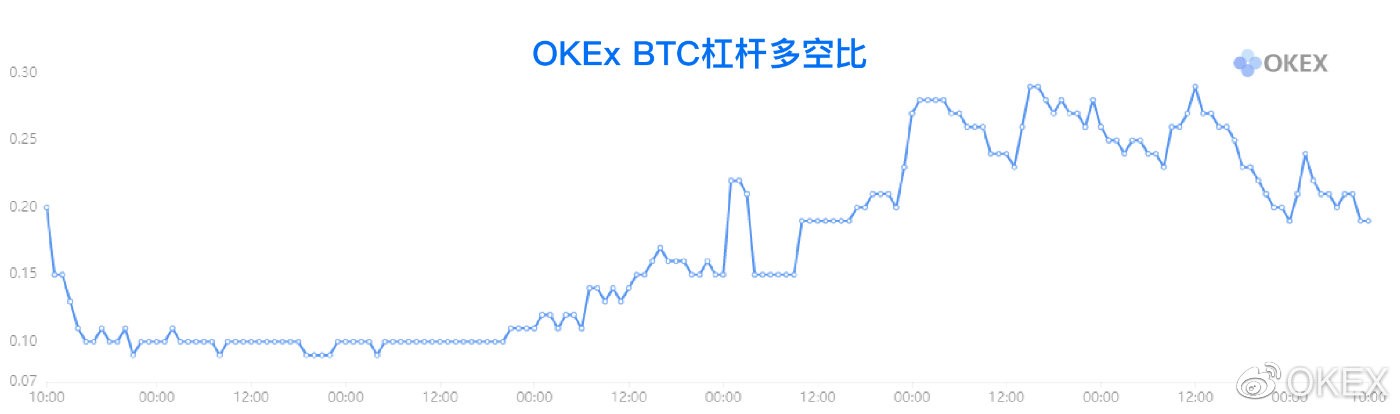
Short-term data is not friendly to low-level air forces
Financial asset prices around the world are in their worst free fall since the 2008 financial crisis, led by U.S. stocks, as more governments launched unprecedented measures, including travel bans and city lockdowns, to curb the spread of the coronavirus. Losing more than $10 trillion, the three major stock indexes wiped out nearly four years of gains. In addition, we noticed this week that as the risk aversion sentiment in the market has not yet dissipated, government bonds whose prices rose sharply in the early stage of the epidemic also began to plummet after the sell-off wave in the stock market. Interest rates on short-term and three-month U.S. Treasury bonds turned negative, while the U.S. dollar index hit its highest intraday level since April 2017 on the 19th.
In order to alleviate the shortage of liquidity in the market, after the Fed lowered the target interest rate to zero, it quickly launched a series of other measures including temporary liquidity swap agreements, increasing the amount of borrowing at the discount window, and creating the money market mutual fund liquidity facility (MMLF). measure. Previously, according to Goldman Sachs' measurement, the liquidity of US stocks has reached the worst level since the financial crisis, and the bid-ask spreads provided by market makers are extremely large.
Bitcoin and U.S. stocks show signs of decoupling, rebounding rapidly
image description
technical side
technical side
image description
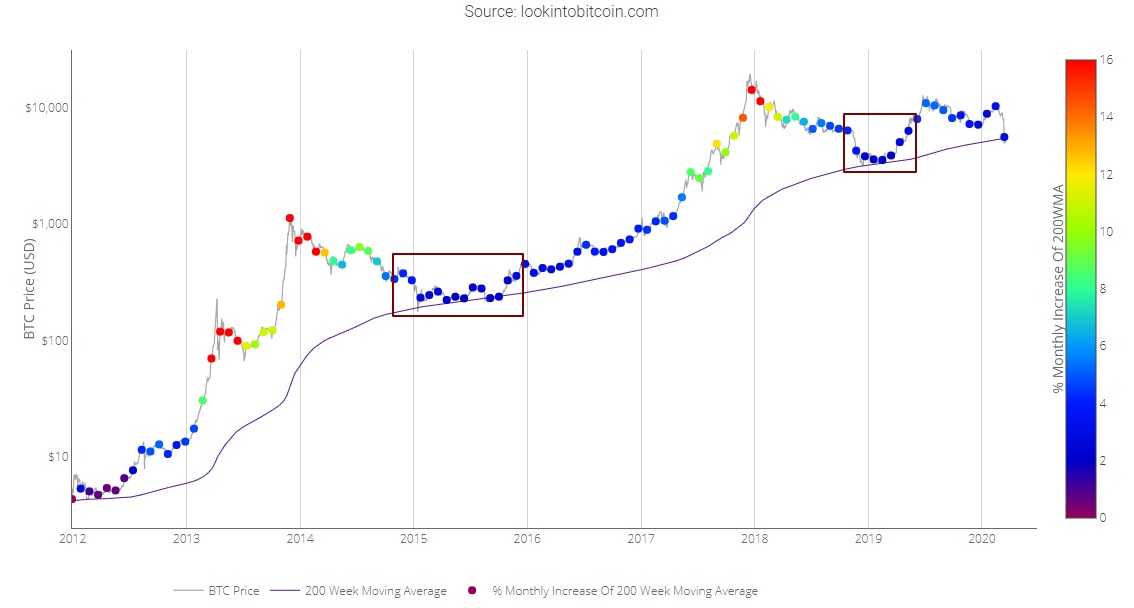
Figure 2: Bitcoin 200-week moving average heat map – Lookintobitcoin,com
Bitcoin pulled back this week after breaking below the 200-week moving average last week, which also shows that the moving average can still be regarded as an important support level. At the same time, we can see from the figure that in the past, when the price of Bitcoin dropped rapidly or approached the 200-week moving average, it always showed an arc-shaped bottom in a long-term dimension. Historically, there has never been a V-shaped reversal in price. example.
Emotional side
image description
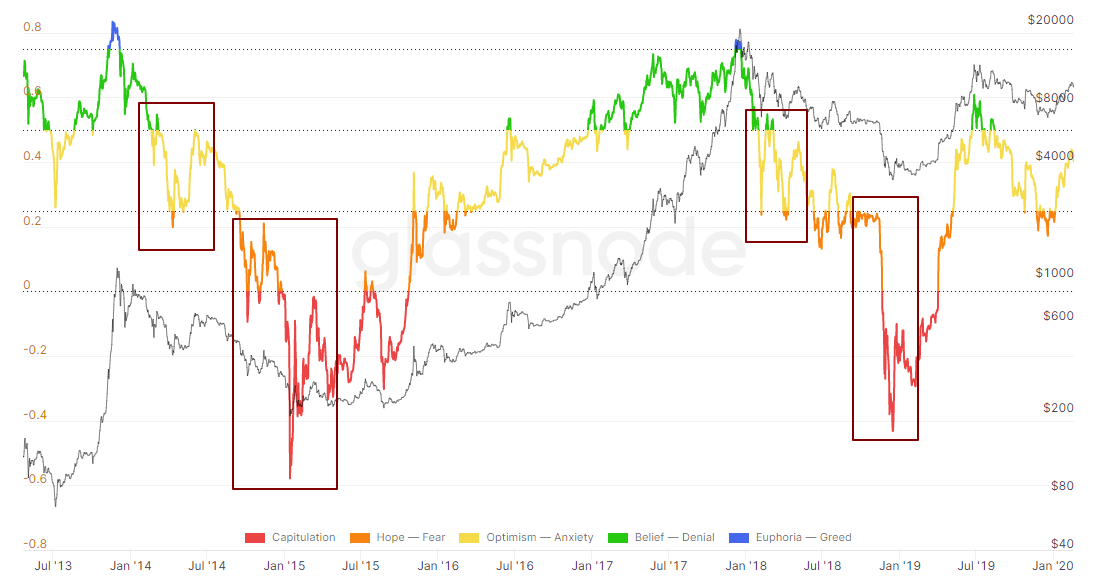
Figure 3: Bitcoin Net Unrealized Profit/Net Loss – Glassnode – (Red/Orange/Yellow/Green/Blue – Capitulation/Hope to Fear/Optimism to Anxiety/Faith to Denial/Excitement to Greed)
image description
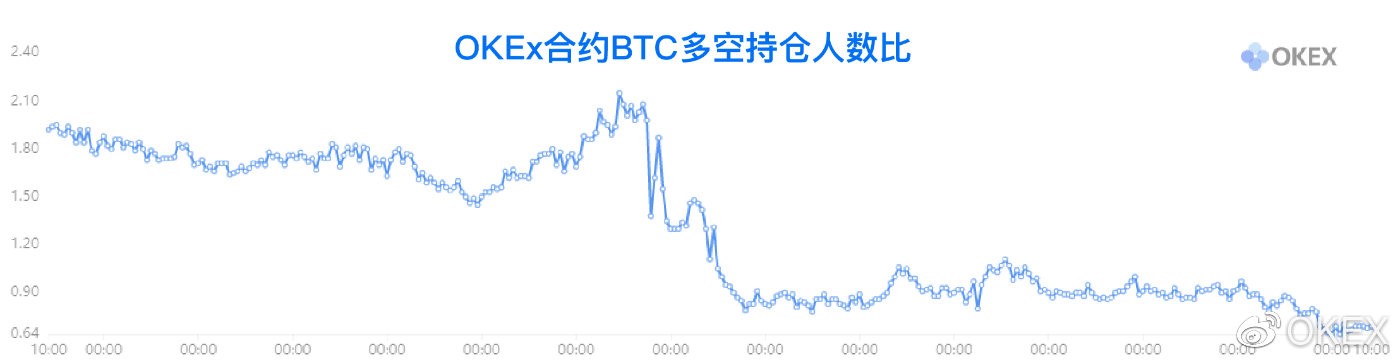
Figure 4: OKEx transaction big data - data collection time from 3/13 10:00 to 3/20 10:00
image description
Risk warning: This article does not constitute an investment recommendation. Investment is risky. Investment should consider personal risk tolerance. It is recommended to conduct an in-depth investigation of the project and carefully make your own investment decisions.
Risk warning: This article does not constitute an investment recommendation. Investment is risky. Investment should consider personal risk tolerance. It is recommended to conduct an in-depth investigation of the project and carefully make your own investment decisions.