OKEX Investment Research: The price war of crude oil has caused the prices of various risk assets to plummet, similar trends have appeared in late 2015


Written by: OKEx analyst Yan Song
Bitcoin has followed oil prices and US stock futures from the weekend to this morning, and multiple technical support levels have failed one after another. That is, it is difficult to predict the strength and fuse of this decline from the technical perspective. The direct cause of the plunge in the prices of risky assets was the spread of the epidemic and OPEC’s failure to reach an oil production reduction agreement with Russia. Then Saudi Arabia launched a new round of price wars in the oil market, and the volatility of global assets has increased.
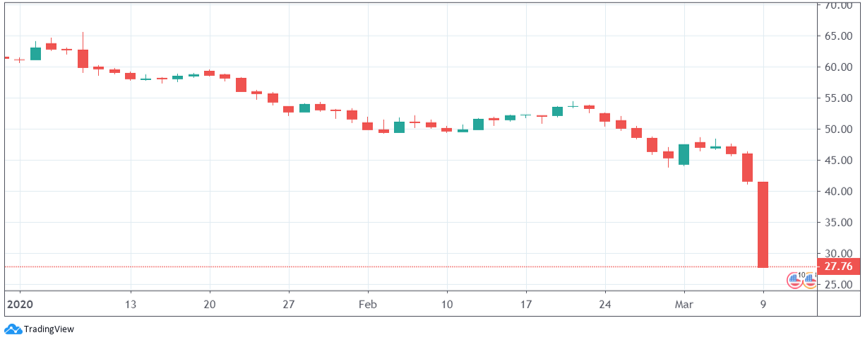
image description
Figure 1: WTI crude oil price 2020-to-day chart – Tradingview
The last time we saw crude oil below $30 a barrel was in late 2015 and early 2016, when Saudi Arabia launched a price war against U.S. shale gas fields, and the plunge in crude oil caused the S&P 500 to retreat 15% in a month. %about. Looking back at the price of Bitcoin from mid-December 2015 to mid-January 2016, it was also quite weak, falling from around $460 to above $350, a drop of 25%.
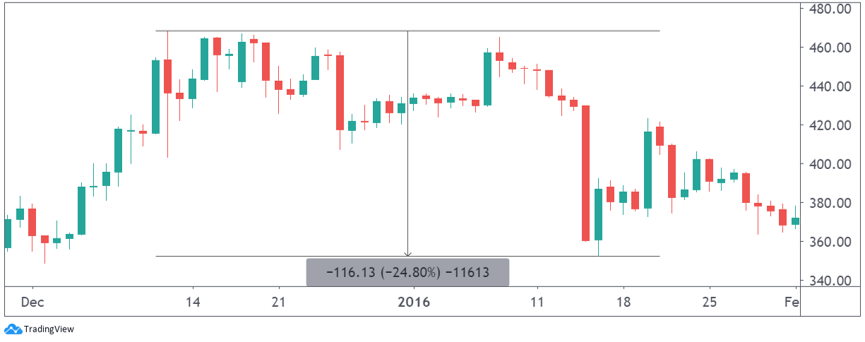
image description
Figure 2: Bitcoin Daily Chart December 2015-January 2016 – Tradingview
In addition, before the U.S. stock market plummeted last month, the more sensitive oil price had already reacted, that is, the economic recession factor was reflected in the price change ahead of the U.S. stock market. Crude oil prices began to fluctuate and fall from above US$60/barrel as early as the first ten days of January. Bitcoin also peaked a week ahead of U.S. stocks, falling rapidly from $10,500 in mid-February.
The weekend’s sharp drop left a gap around $900 (10%) in the CME Bitcoin futures chart. The last time we saw a gap of similar magnitude was when the blockchain hit the news at the end of October last year. The technical aspect has played a small role at present. The nearly 10% drop yesterday caused the currency price to break through the support of the 200-day moving average and the 120-day moving average one after another, and did not stop falling until around $8,000. The stronger support that can be observed below is around $7,500, and the pressure above is at the downward running 120-day moving average, which is currently around $8,330.
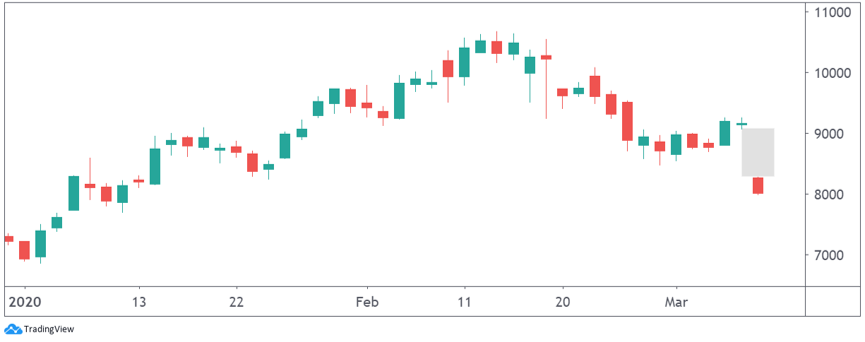
Figure 3: CME Bitcoin Futures Daily Chart – Tradingview
Risk warning: This article does not constitute an investment recommendation. Investment is risky. Investment should consider personal risk tolerance. It is recommended to conduct an in-depth investigation of the project and carefully make your own investment decisions.