Crypto Market Sentiment Research Report (11.3–11.10): BlackRock submitted a spot Ethereum ETF application, and ETH rose 12.35% in response


BlackRock files for spot Ethereum ETF, ETH rises 12.35% at 11.9
Nasdaq has filed an application with the U.S. SEC for BlackRock’s proposed spot Ethereum ETF, the “iShares Ethereum Trust,” which would have Coinbase Custody Trust Company as its custodian and use the CME CF Ether-Dollar reference rate.
Additionally, other asset managers such as Grayscale, Ark Invest, ProShares and Valkyrie have also filed for spot Ethereum ETFs.
ETH subsequently rose 12.35% at 11.9
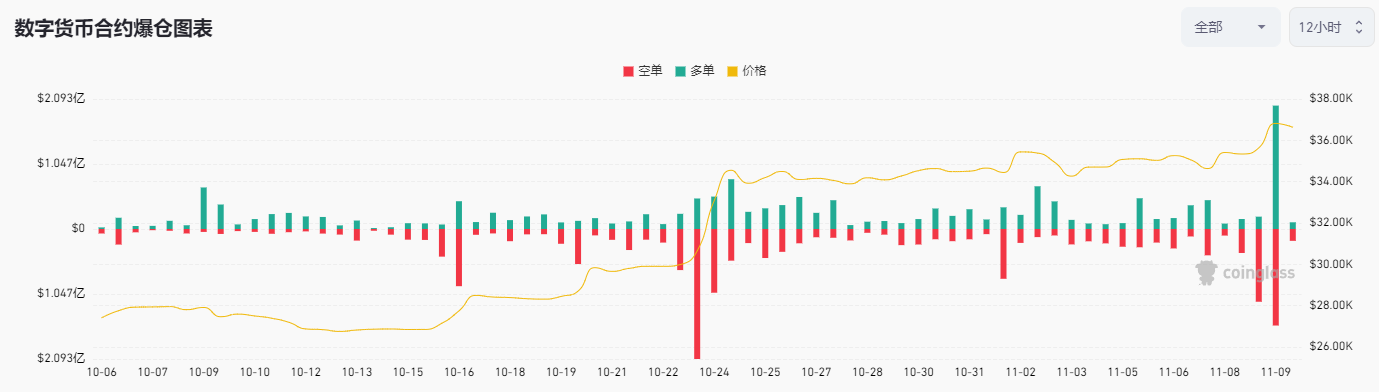
Data Sources:https://www.coinglass.com/zh/LiquidationData
11.9 In addition to ETH, the prices of multiple cryptocurrencies, including BTC, fell sharply after rising sharply. Long positions were liquidated to US$198.7 million, and short positions were liquidated to US$155.54 million.
The Bitcoin halving is about 158 days away from today (2023.11.10)
Countdown to halving:https://www.nicehash.com/countdown/btc-halving-2024-05-10-12-00?_360safeparam=1289146171
Market technical and emotional environment analysis
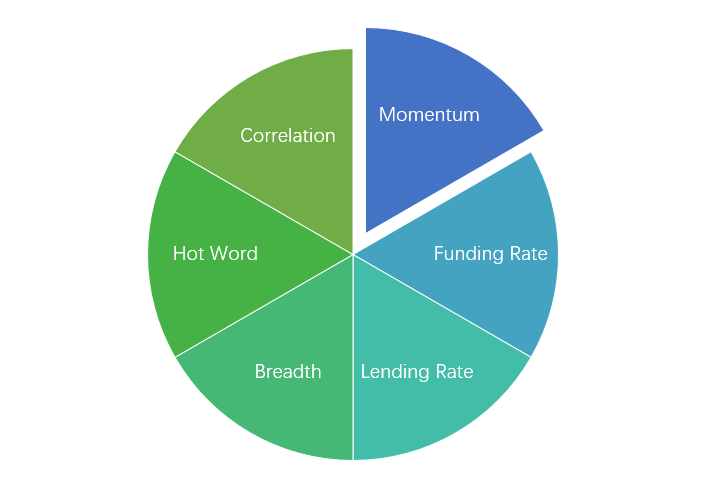
Sentiment analysis components
Technical Indicators Price Trend
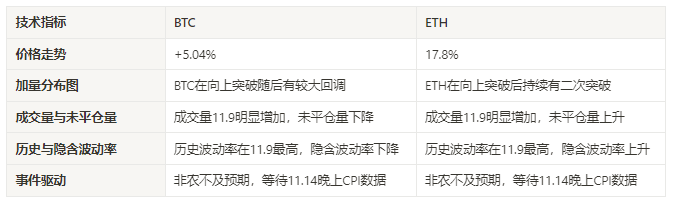
BTC prices increased by 5.04% and ETH prices by 17.8% in the past week.
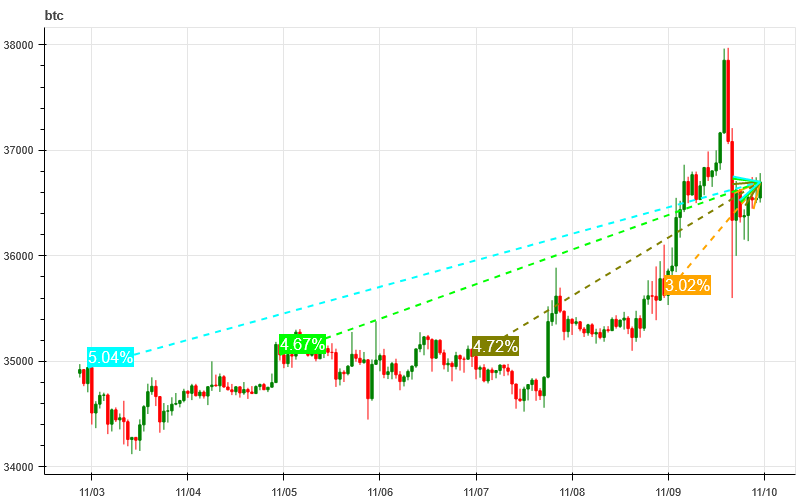
The picture above is the price chart of BTC over the past week
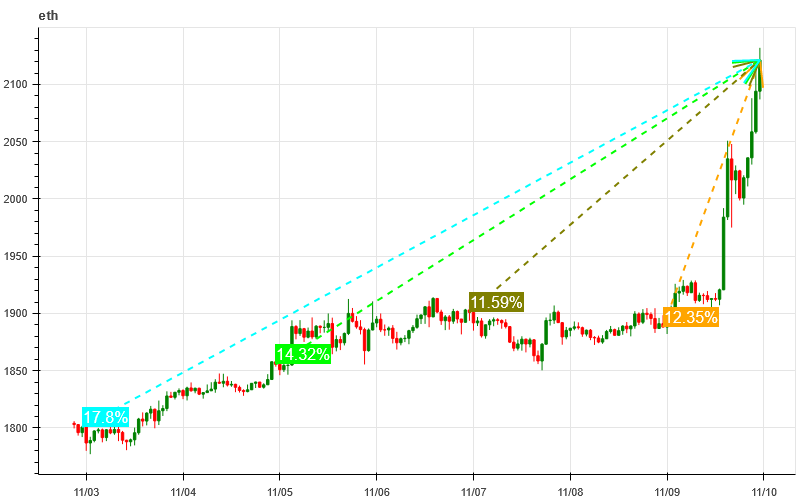
The picture above is the price chart of ETH over the past week

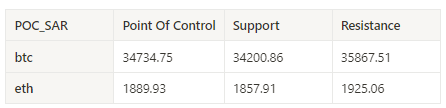
The table shows the price change rate and price volume distribution chart (support and resistance) over the past week
Price and volume distribution chart (support and resistance)
In the past week, the price of BTC had an upward breakthrough and then had a large correction, and ETH continued to have a second breakthrough after an upward breakthrough.
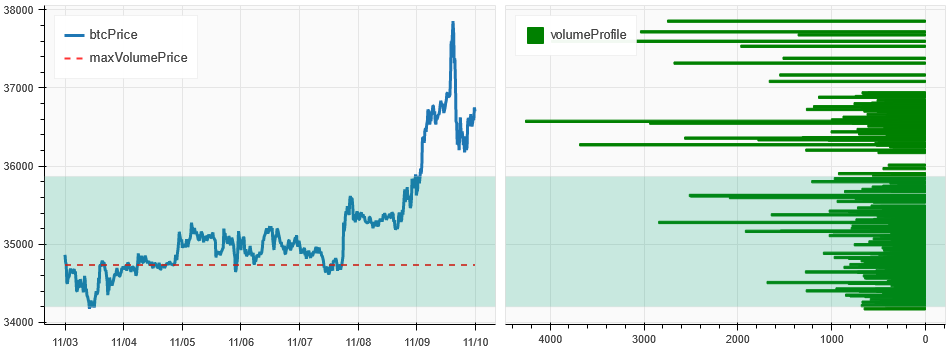
The picture above is the distribution map of BTC’s intensive trading areas in the past week.
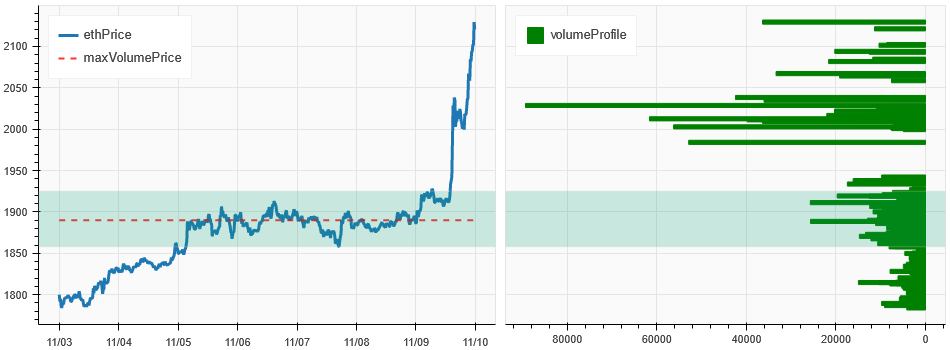
The picture above is the distribution map of ETH’s intensive trading areas in the past week.
Volume and Open Interest
In the past week, both BTC and ETH have seen a significant increase in trading volume at 11.9; open interest continues to rise.
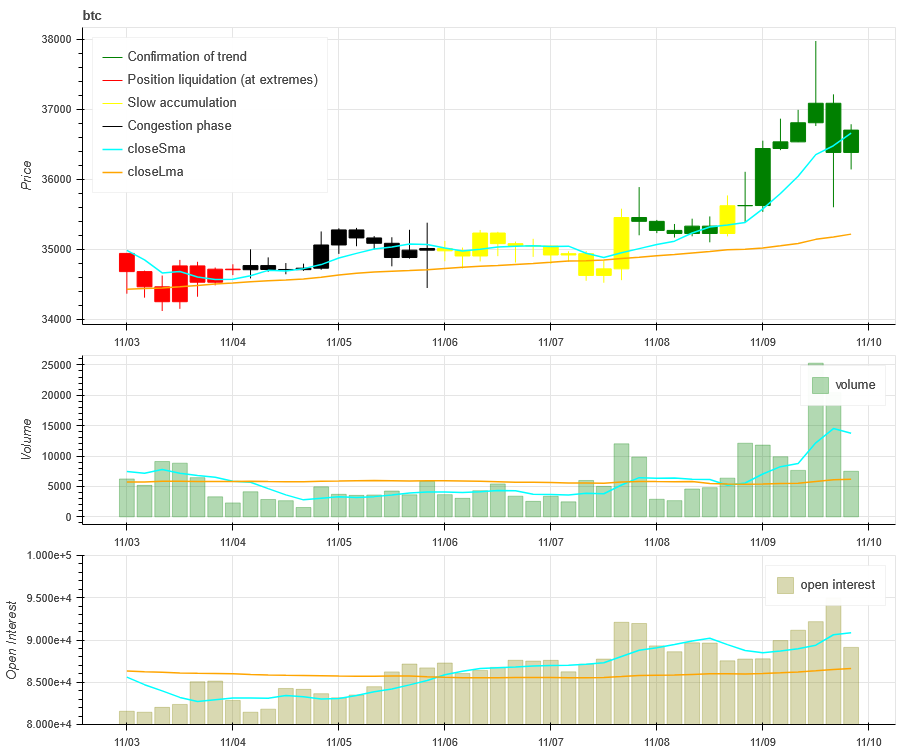
The price trend of BTC at the top of the picture above, the middle is the trading volume, the bottom is the open interest, the light blue is the 1-day average, and the orange is the 7-day average. The color of the K line represents the current status. Green means that the price rise is supported by trading volume, red means positions are being closed, yellow means positions are slowly accumulating, and black means congestion.
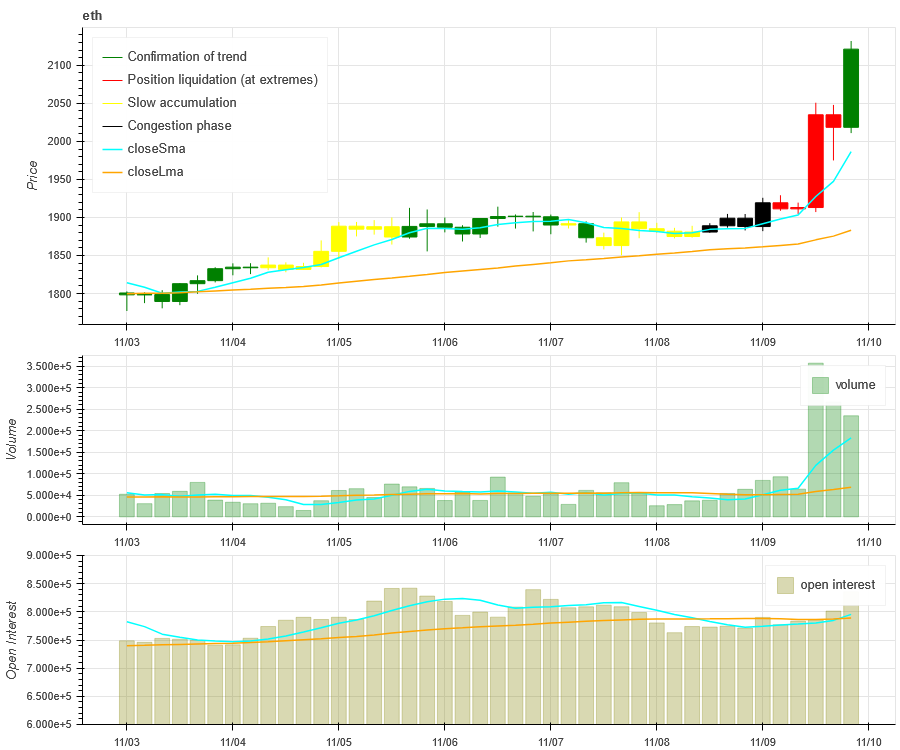
The price trend of ETH at the top of the picture above, the middle is the trading volume, the bottom is the open interest, the light blue is the 1-day average, and the orange is the 7-day average. The color of the K line represents the current status. Green means that the price rise is supported by trading volume, red means positions are being closed, yellow means positions are slowly accumulating, and black means congestion.
Historical Volatility vs. Implied Volatility
Historical volatility for BTC vs. ETH over the past week was at its highest at 11.9, with implied volatility falling for BTC and rising for ETH.
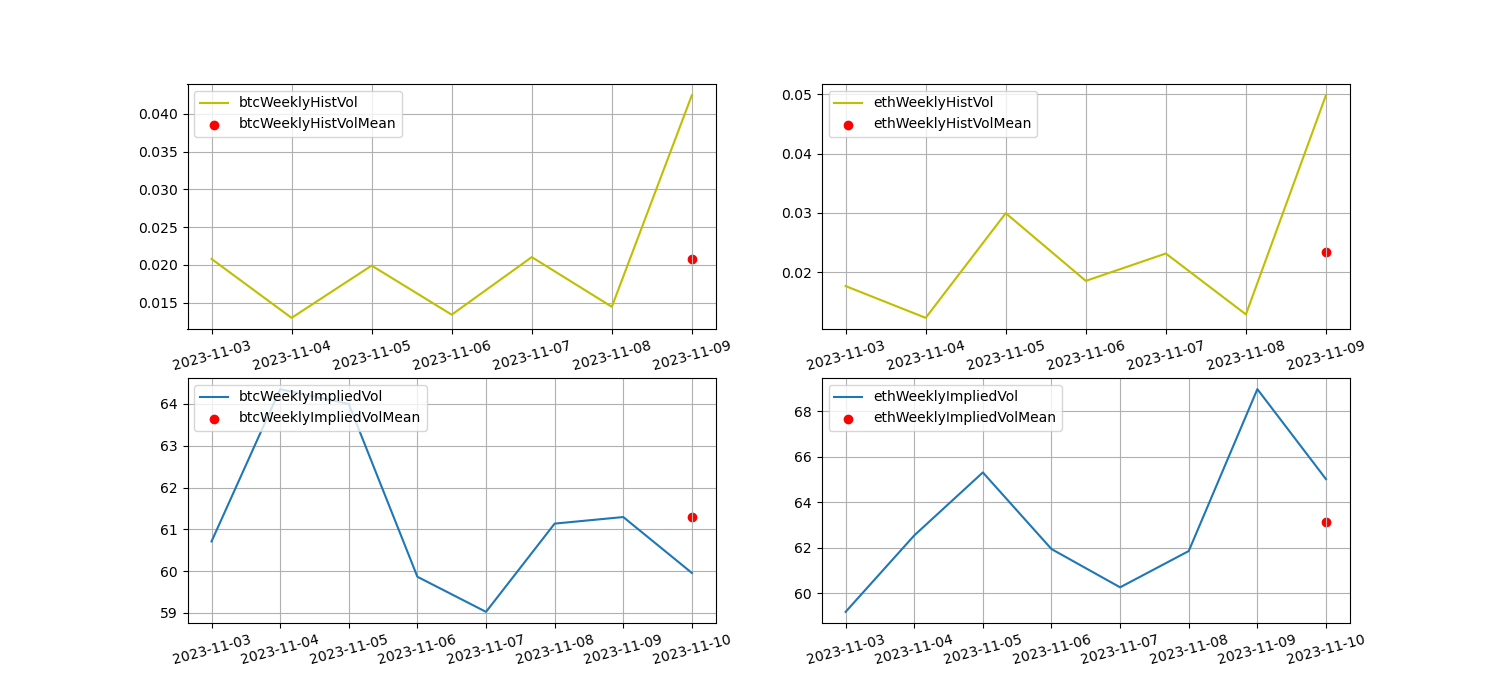
The yellow line is historical volatility, the blue line is implied volatility, and the red dot is its 7-day average
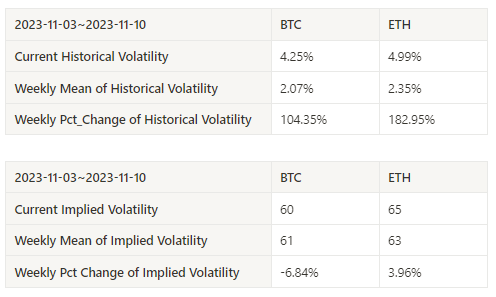
event driven
On the evening of Friday, November 3, Eastern Time, the non-agricultural data was released at 150 K, which was smaller than the forecast of 180 K. Prices rose slowly one day after the release. Pay attention to the release of CPI data on 11.14 next week.
sentiment indicator
momentum sentiment
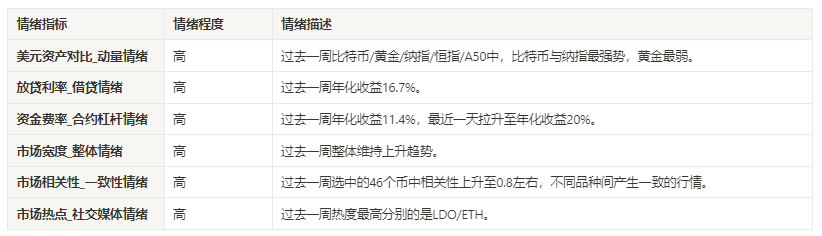
Among the Bitcoin/Gold/Nasdaq/HSI/A 50 in the past week, Bitcoin and the Nasdaq were the strongest, while the worst performer was gold.
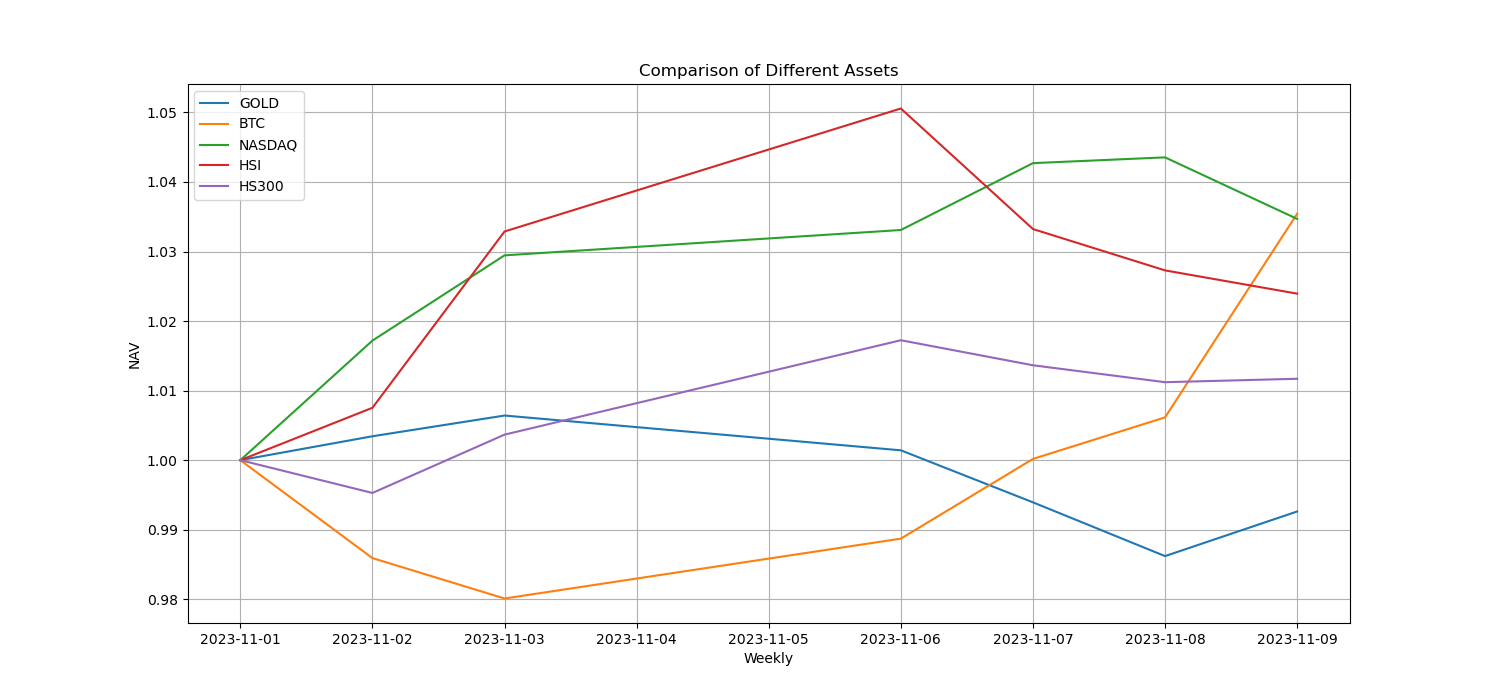
The picture above shows the trends of different assets over the past week.

Lending interest rate_Lending sentiment
The average annualized return on USD lending over the past week was 16.7%, with interest rates stable.
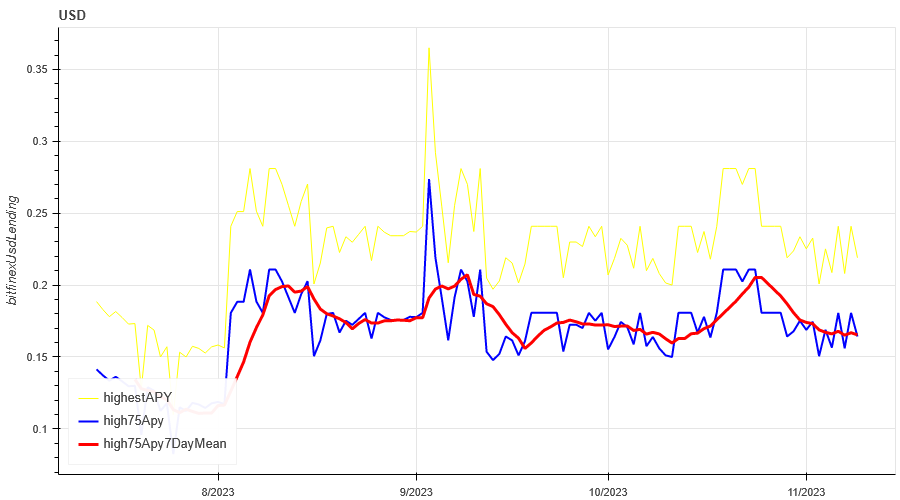
The yellow line is the highest price of the USD interest rate, the blue line is 75% of the highest price, and the red line is the 7-day average of 75% of the highest price

The table shows the average return of USD interest rate for different holding days in the past
Funding Rate_Contract Leverage Sentiment
The average annualized return on BTC tariffs in the past week was 11.4%
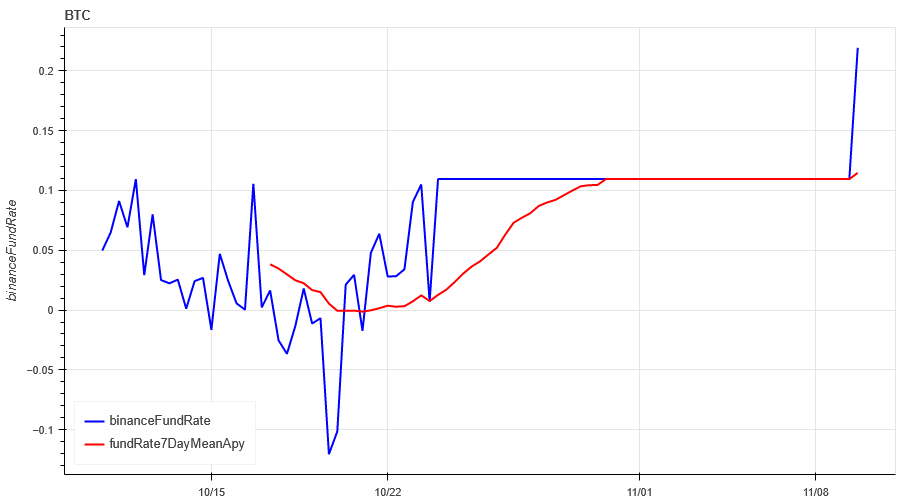
The blue line is the funding rate of BTC on Binance, and the red line is its 7-day average

The table shows the average return of BTC fees for different holding days in the past
Market Breadth_Overall Sentiment
With 90% of the 46 coins selected over the past week above the 30-day moving average, the market remains in an uptrend.
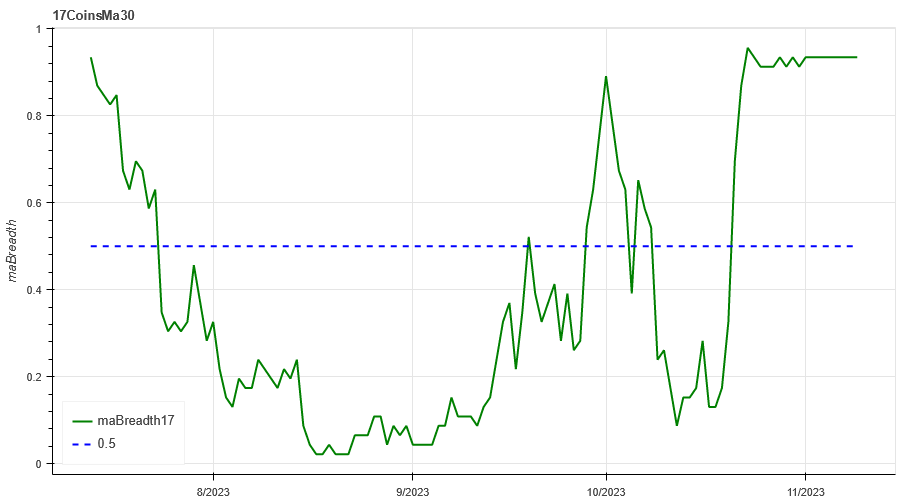
The picture above is [btc, eth, bnb, ltc, bch, doge, matic, sol,link,uni, enj,gala , mana, axs, dydx, fet ,gmx, xlm, xrp, ada, trx, sol, dot, avax, shib, atom, xmr, etc, ldo, hbar, apt, vet, qnt, vet,crv, aave, algo , ftm, ape, neo, sand, eos, xtz, rndr, theta, mkr] proportion above the 30-day moving average
Market Correlation_Consistent Sentiment
Among the 46 coins selected in the past week, the correlation has increased to around 0.8, resulting in consistent prices among different varieties.
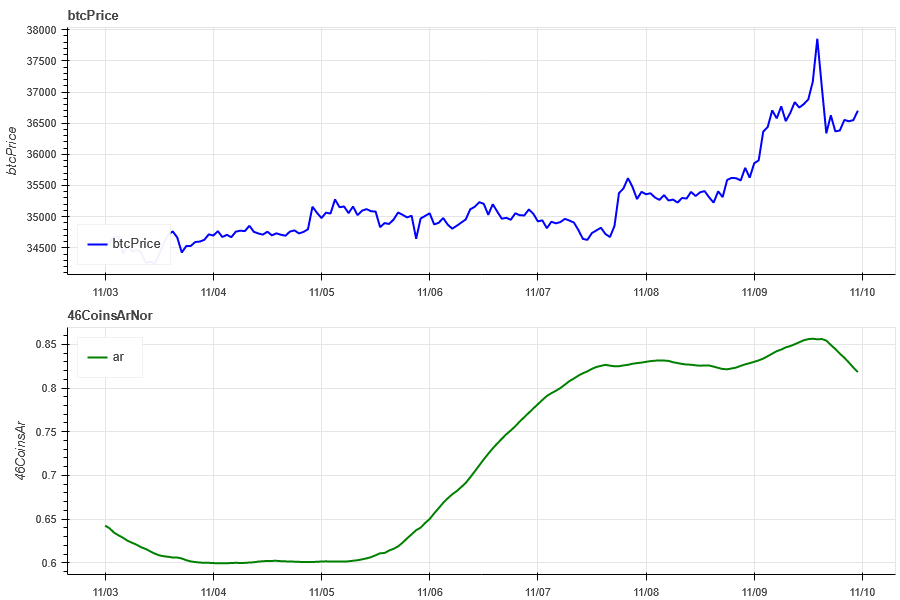
The blue line in the above picture first shows the Bitcoin price, and the green line is [btc, eth, bnb, ltc, bch, doge, matic, sol, link, uni, enj,gala, mana, axs, dydx, fet ,gmx, xlm, xrp, ada, trx, sol , dot, avax, shib, atom, xmr, etc, ldo, hbar, apt, vet, qnt, vet, crv, aave, algo, ftm, ape, neo, sand, eos, xtz, rndr, theta, mkr] overall Correlation
Market Hotspots_Social Media Sentiment
The most popular pair in the past week has been LDO/ETH.
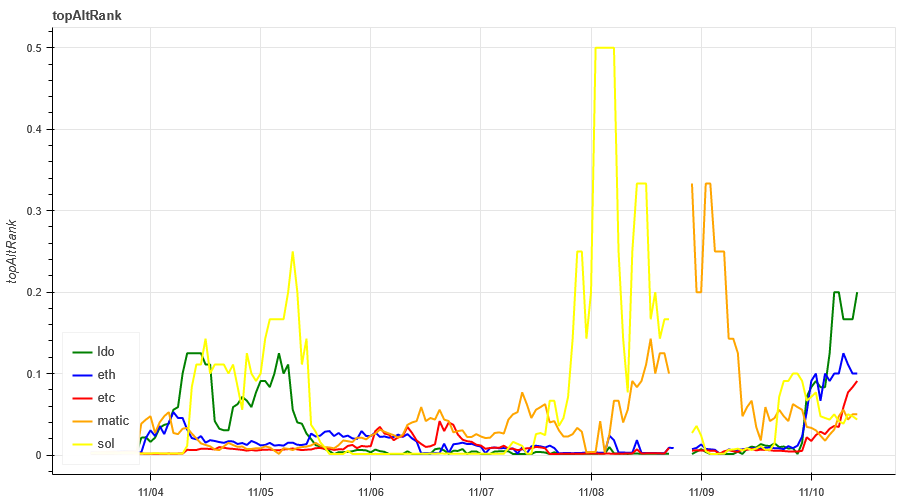
Data Sources:https://lunarcrush.com/categories/cryptocurrencies
Summarize
Trading sentiment continues to rise. ETHs ETF application has caused its price to rise strongly. Its related LDO has also become a hot topic of public opinion. The implied volatility of ETH has increased this week; in terms of price trends, BTC has risen to a maximum of 37972 and then fell sharply to insert long positions. The amount of liquidated positions surged, and ETH surged after the news about ETFs; in terms of events, non-agricultural data fell short of expectations. Pay attention to the release of CPI data on November 14th.
Twitter: @DerivativesCN
Website: https://dcbot.ai/