Crypto Market Sentiment Research Report (10.27-11.3): FTX Liquidation In Progress


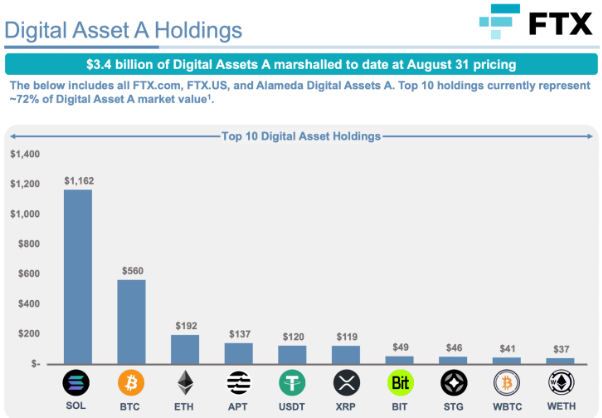
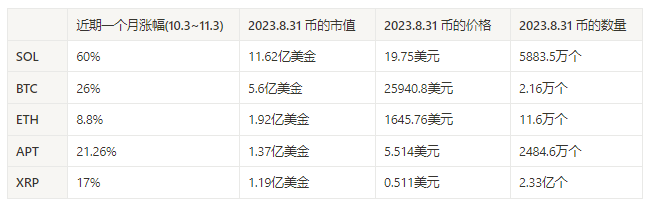
FTX Pump and Dump?
The coins held more by FTX all have a larger increase, especially SOL, followed by BTC, APT, and XRP
The media spoke highly of SOL,
SOLs price surged and fell after heavy volume on 2023.11.02, volatility increased, and short-term risks were high.
Are the fundamentals good?
BTC halving is approaching
BTC ETF Expectations
The Federal Reserves FOMC meeting did not continue to raise interest rates
Bitcoin halving is about 168 days away from today (2023.11.3)
Countdown to halving:https://www.nicehash.com/countdown/btc-halving-2024-05-10-12-00?_360safeparam=1289146171
Market technical and emotional environment analysis
Technical indicators
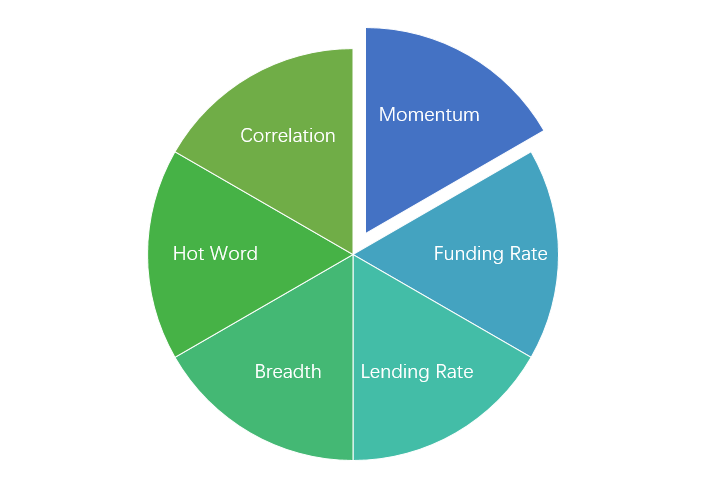
Sentiment analysis components
Technical indicators
Price trend
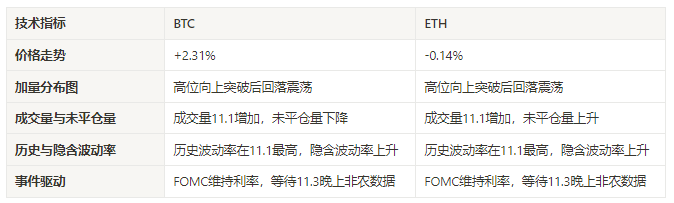
BTC price increased by 2.31% in the past week, and ETH price increased by -0.14%.
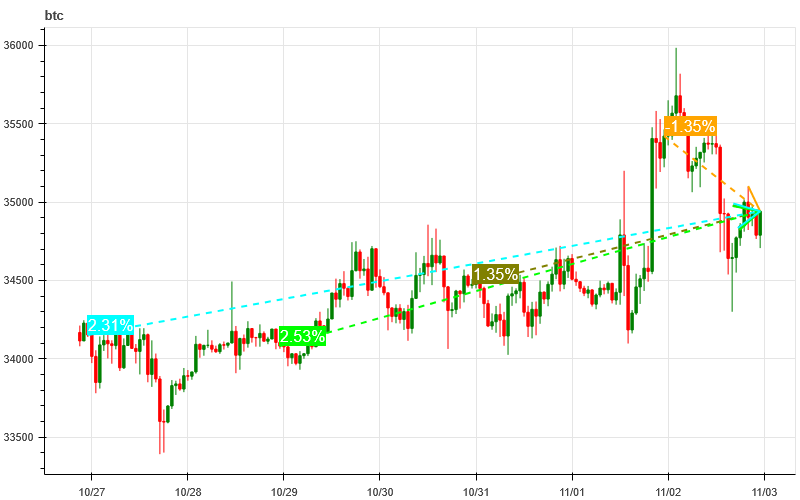
The picture above is the price chart of BTC over the past week
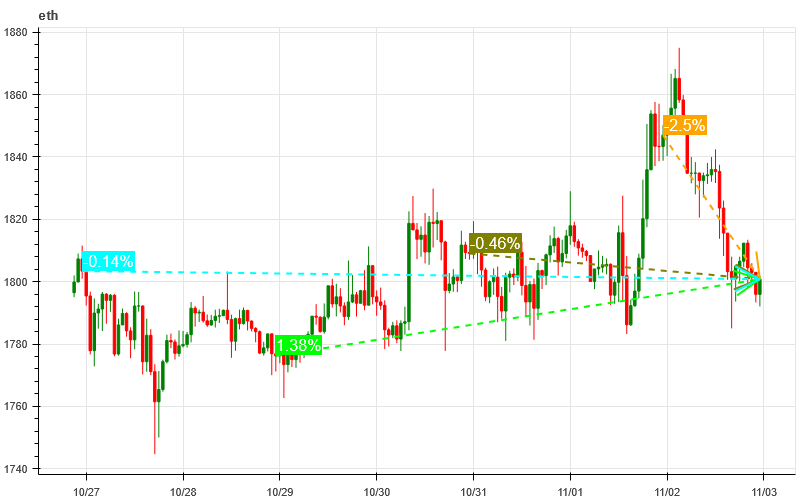
The picture above is the price chart of ETH over the past week

Table showing the rate of price change over the past week
Price and volume distribution chart (support and resistance)
In the past week, the prices of BTC and ETH broke upward after the FOMC meeting and then fell back to the intensive trading area and fluctuated.
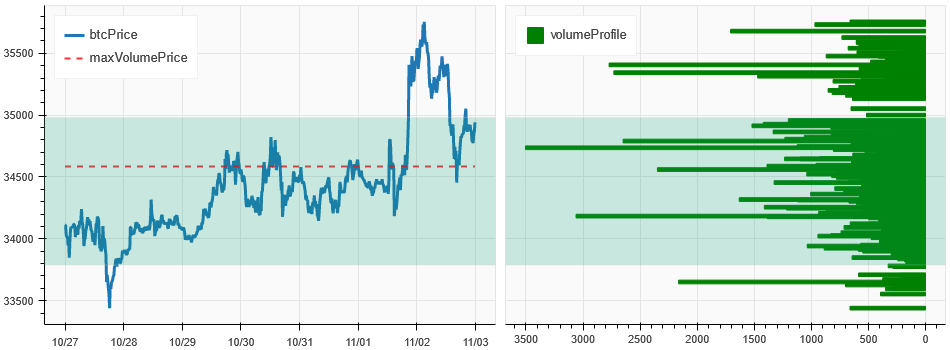
The picture above is the distribution map of BTC’s intensive trading areas in the past week.
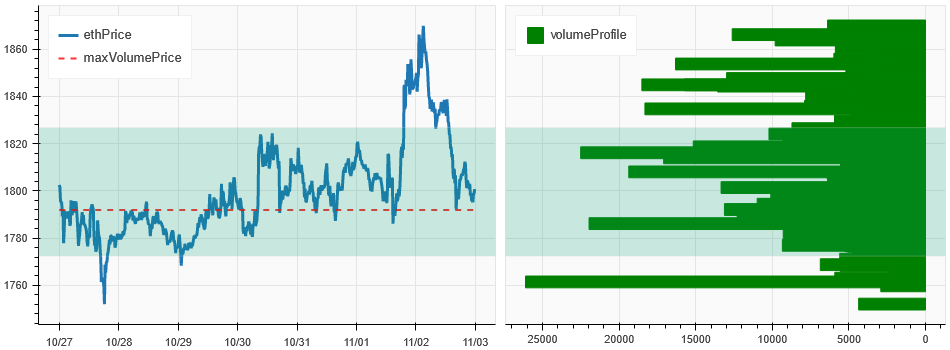
The picture above is the distribution map of ETH’s intensive trading areas in the past week.
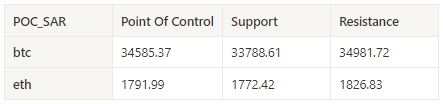
Table showing the intensive weekly trading ranges for BTC and ETH over the past week
Volume and Open Interest
Both BTC and ETH have seen increased trading volume over the past week before and after the FOMC meeting; BTC open interest fell and ETH open interest increased.
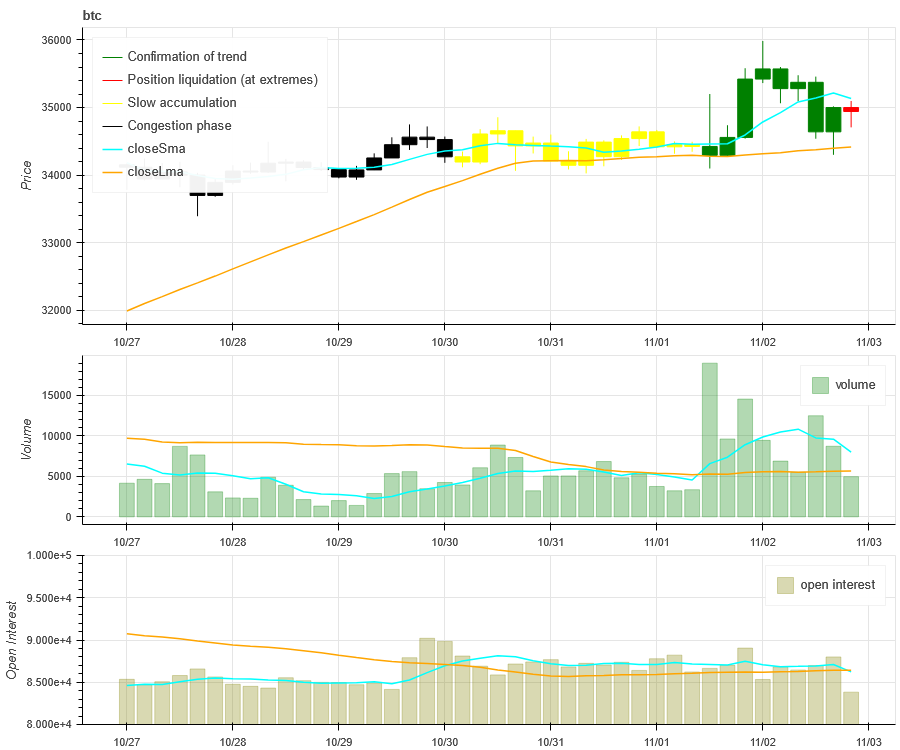
The price trend of BTC at the top of the picture above, the middle is the trading volume, the bottom is the open interest, the light blue is the 1-day average, and the orange is the 7-day average. The color of the K line represents the current status. Green means that the price rise is supported by trading volume, red means positions are being closed, yellow means positions are slowly accumulating, and black means congestion.
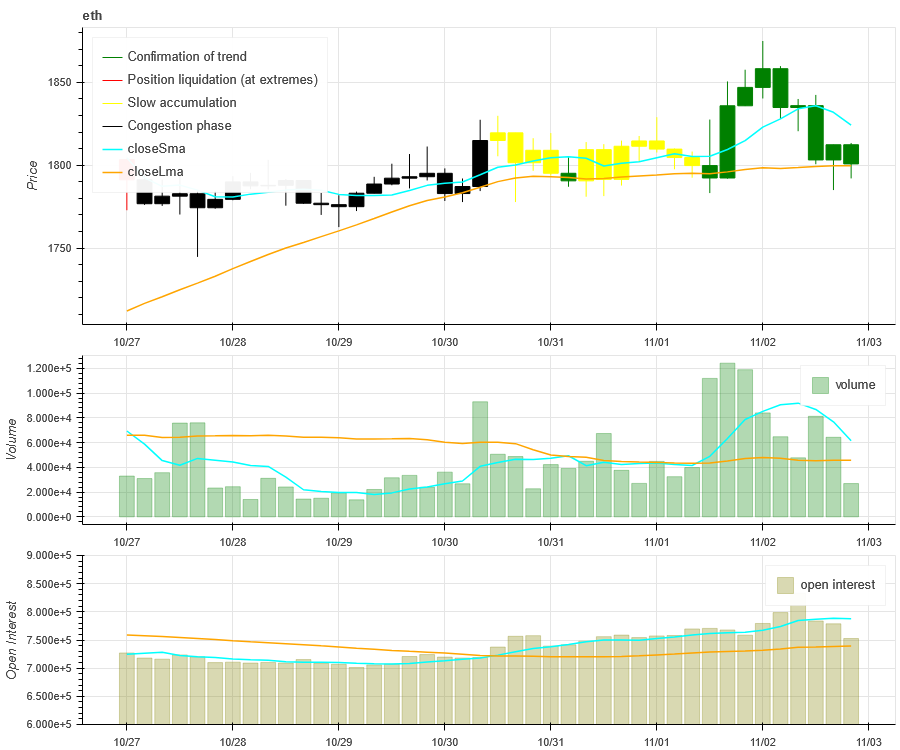
The price trend of ETH at the top of the picture above, the middle is the trading volume, the bottom is the open interest, the light blue is the 1-day average, and the orange is the 7-day average. The color of the K line represents the current status. Green means that the price rise is supported by trading volume, red means positions are being closed, yellow means positions are slowly accumulating, and black means congestion.
Historical Volatility vs. Implied Volatility
The historical volatility of BTC and ETH over the past week was at its highest at 11.1, with implied volatility rising.
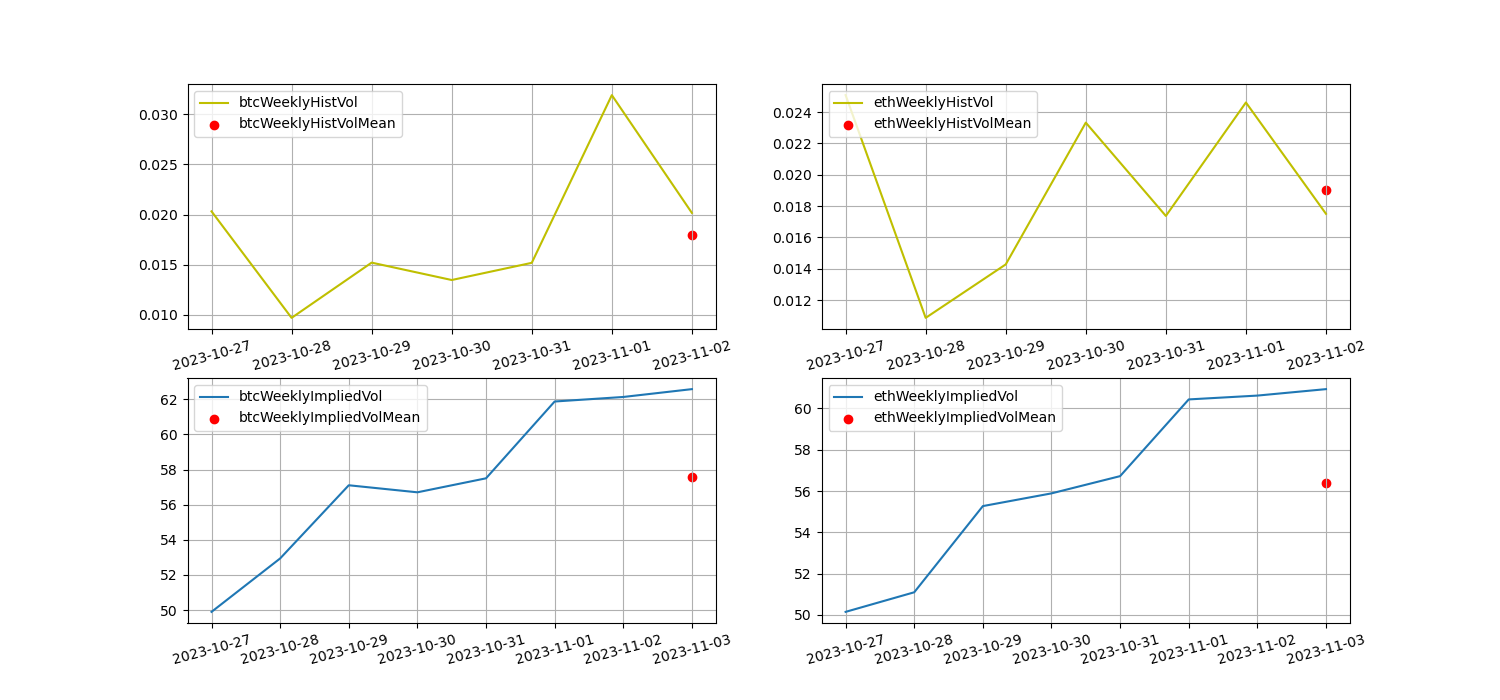
The yellow line is historical volatility, the blue line is implied volatility, and the red dot is its 7-day average
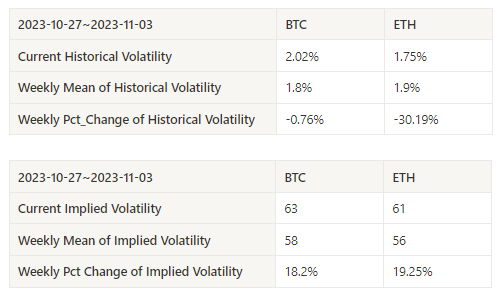
event driven
On Wednesday, November 1, Eastern Time, the Federal Reserve Monetary Policy Committee announced after its FOMC meeting that the target range for the federal funds rate remains at 5.25% to 5.50%, keeping this policy rate at a 22-year high. Pay attention to the release of non-agricultural data tonight at 11.03.
sentiment indicator
momentum sentiment
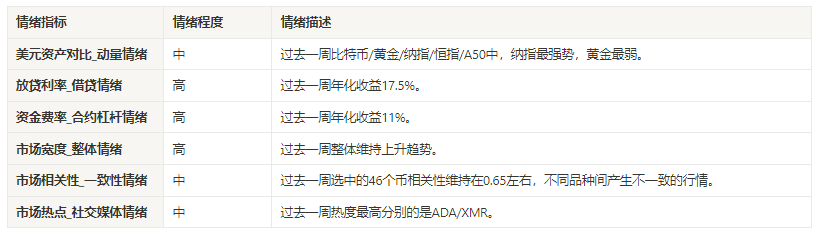
Among Bitcoin / Gold / Nasdaq / Hang Seng Index / A 50 in the past week, the Nasdaq was the strongest, while the worst performer was gold.
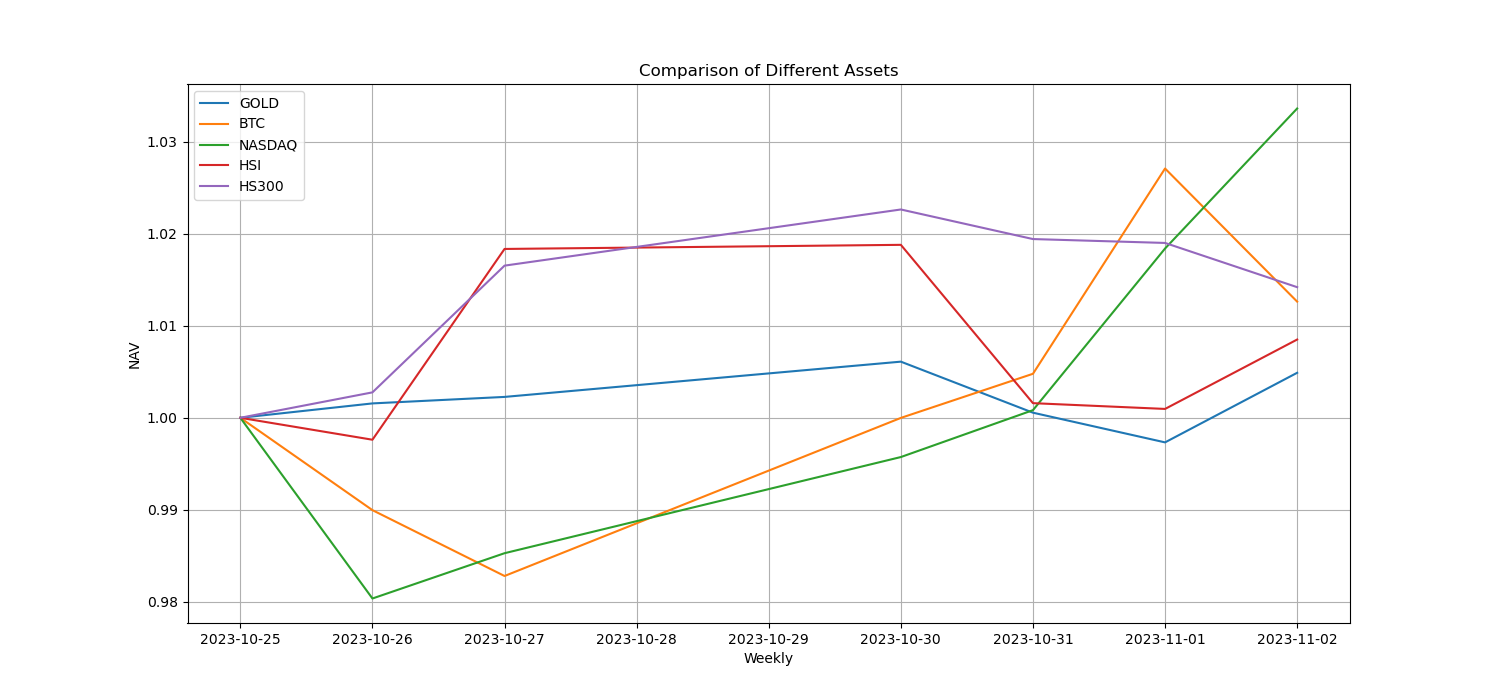
The picture above shows the trends of different assets over the past week.

Lending interest rate_Lending sentiment
The average annualized return on USD lending over the past week was 17.5%, with interest rates stable.
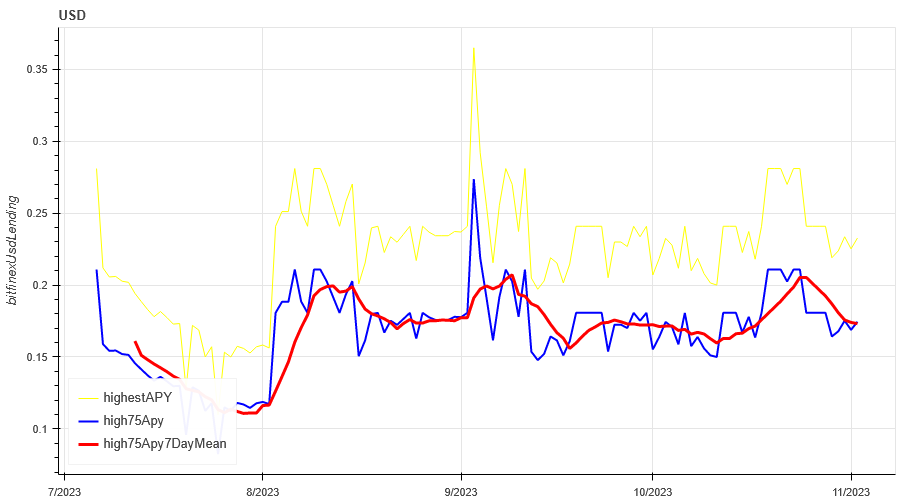
The yellow line is the highest price of the USD interest rate, the blue line is 75% of the highest price, and the red line is the 7-day average of 75% of the highest price

The table shows the average return of USD interest rate for different holding days in the past
Funding Rate_Contract Leverage Sentiment
The average annualized return on BTC tariffs in the past week was 11%
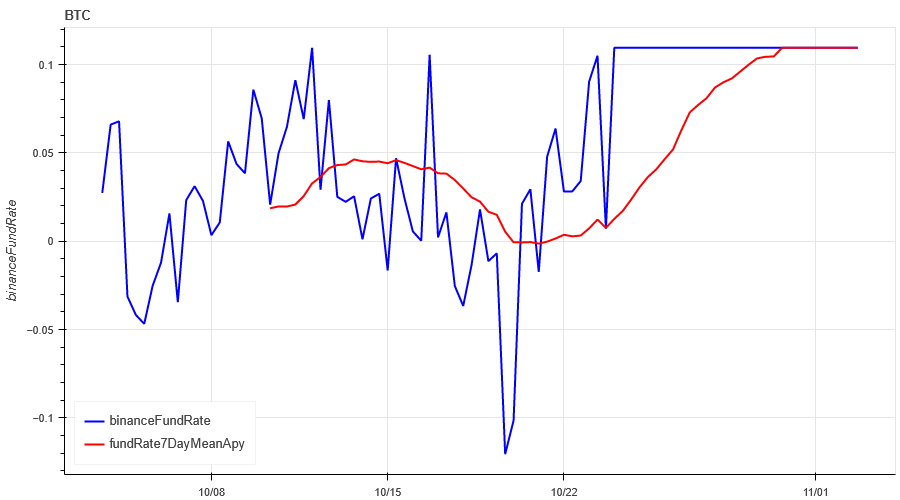
The blue line is the funding rate of BTC on Binance, and the red line is its 7-day average

The table shows the average return of BTC fees for different holding days in the past
Market Breadth_Overall Sentiment
With 90% of the 46 coins selected over the past week above the 30-day moving average, the market remains in an uptrend.
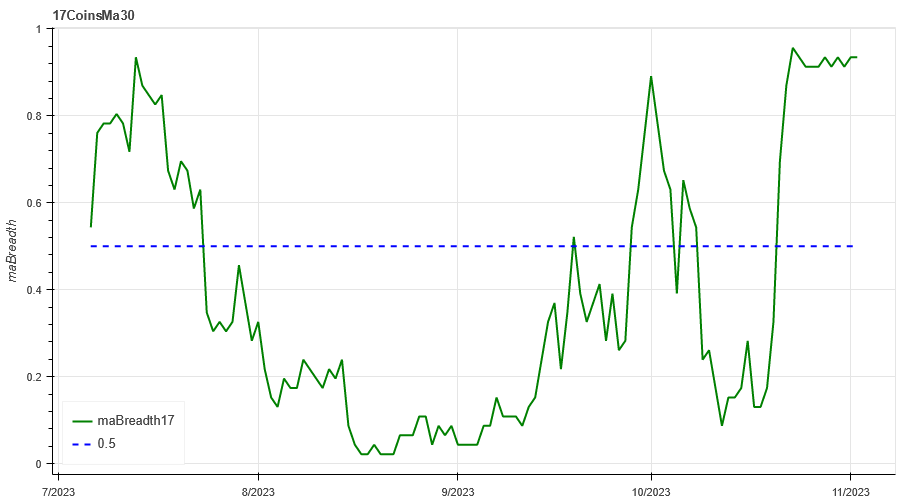
The picture above is [btc, eth, bnb, ltc, bch, doge, matic, sol,link,uni, enj,gala , mana, axs, dydx, fet ,gmx, xlm, xrp, ada, trx, sol, dot, avax, shib, atom, xmr, etc, ldo, hbar, apt, vet, qnt, vet,crv, aave, algo , ftm, ape, neo, sand, eos, xtz, rndr, theta, mkr] proportion above the 30-day moving average
Market Correlation_Consistent Sentiment
The correlation among the 46 coins selected in the past week has remained around 0.65, resulting in inconsistent prices among different varieties.
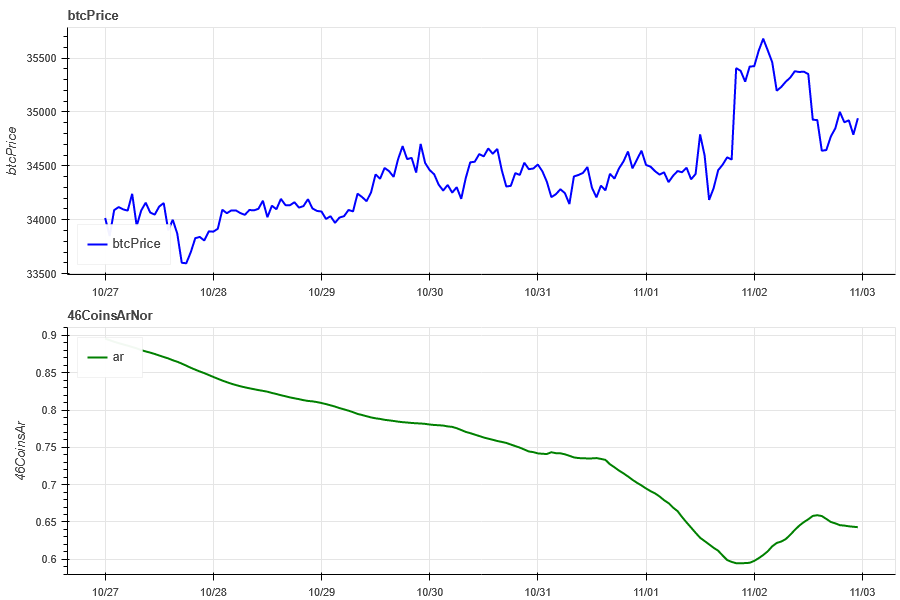
The blue line in the above picture first shows the Bitcoin price, and the green line is [btc, eth, bnb, ltc, bch, doge, matic, sol, link, uni, enj,gala, mana, axs, dydx, fet ,gmx, xlm, xrp, ada, trx, sol , dot, avax, shib, atom, xmr, etc, ldo, hbar, apt, vet, qnt, vet, crv, aave, algo, ftm, ape, neo, sand, eos, xtz, rndr, theta, mkr] overall Correlation
Market Hotspots_Social Media Sentiment
The most popular one in the past week is ADA/XMR.
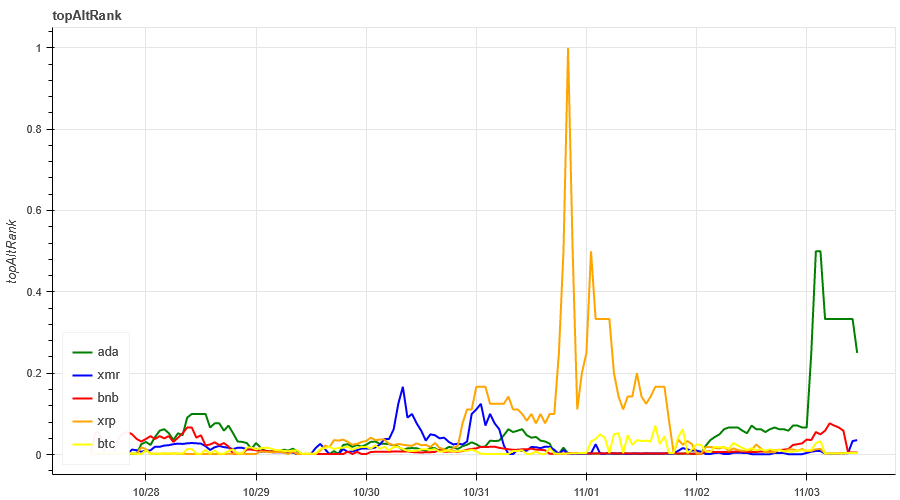
Data Sources:https://lunarcrush.com/categories/cryptocurrencies
Summarize
Are the fundamentals good or pump and dump? The only thing that is certain is that the implied volatility continues to rise, and the volatility will be amplified; in terms of price trends, BTC experienced a large increase and hit a record high before oscillating sideways at a high level, while ETH stalled at 1800, and BNB was at a higher level. The bottom position fluctuates; in terms of events, the Federal Reserve FOMC maintains interest rates, and non-agricultural data will be released on 11.3 evening. In addition, the assets that FTX is about to liquidate are the focus of affecting the price trend of the crypto market in the future.
Twitter: @DerivativesCN
Website: https://dcbot.ai/