Crypto market sentiment research report (10.20–10.27): Trading sentiment is high and the market is about to explode.


Bitcoin briefly rose above $35,000, hitting its highest level in 16 months
The markets renewed confidence in the emergence of the first spot Bitcoin-backed fund (ETF) in the United States pushed Bitcoin to once exceed US$35,000 (S$47,731), reaching its highest level since May last year. According to Bloomberg data, Bitcoin rose sharply on Tuesday (October 24), reaching as high as $35,128 during the session, before falling back to $33,924 as of 3 p.m. Bitcoin has seen significant gains over the past three days, rising 13%. Asset managers BlackRock Inc. and Fidelity Investments are vying to launch a spot Bitcoin ETF, but have yet to receive formal approval from the U.S. Securities and Exchange Commission (SEC).

The Bitcoin halving is less than 182 days away from today (2023.10.27)
Countdown to halving:https://www.nicehash.com/countdown/btc-halving-2024-05-10-12-00?_360safeparam=1289146171
Market technical and emotional environment analysis

Technical indicators
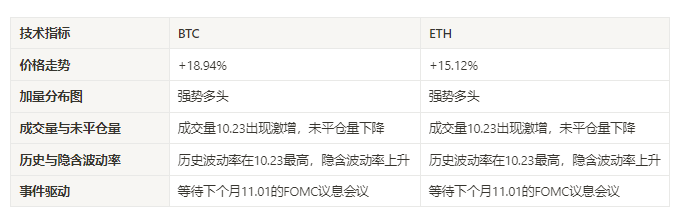
Price trend
BTC price increased by 18.94% and ETH price increased by 15.12% in the past week.
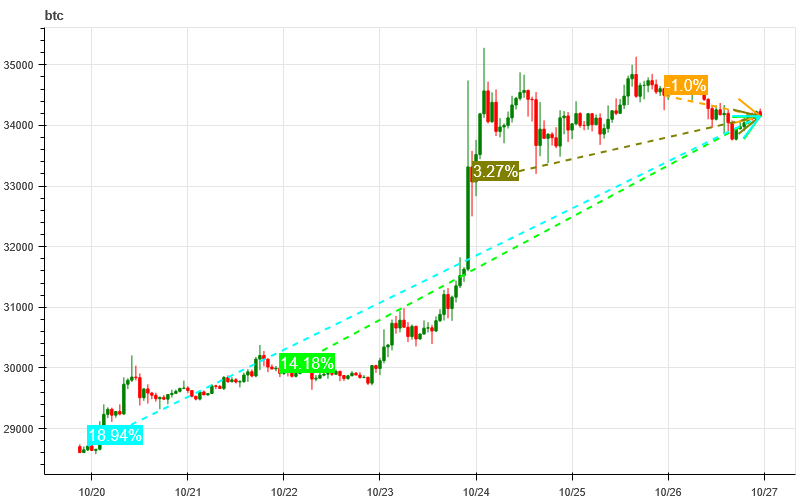
The picture above is the price chart of BTC over the past week
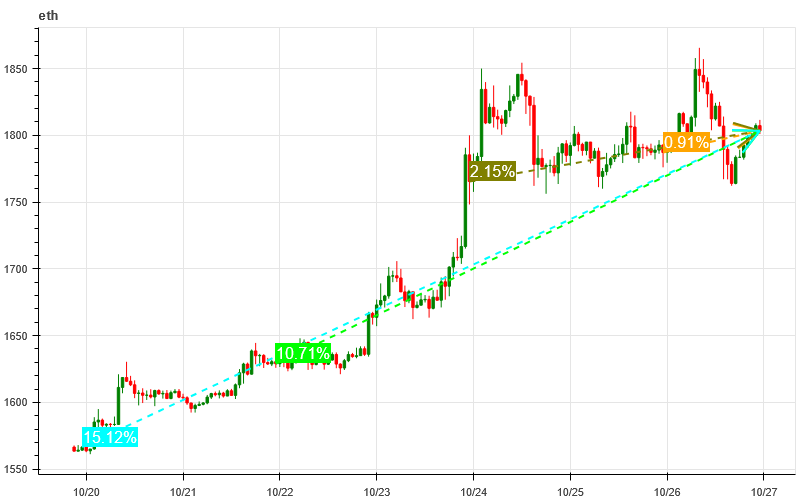
The picture above is the price chart of ETH over the past week
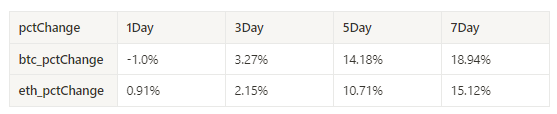
Table showing the rate of price change over the past week
Price and volume distribution chart (support and resistance)
In the past week, the prices of BTC and ETH broke upward and gradually formed a dense trading area with large trading volume.
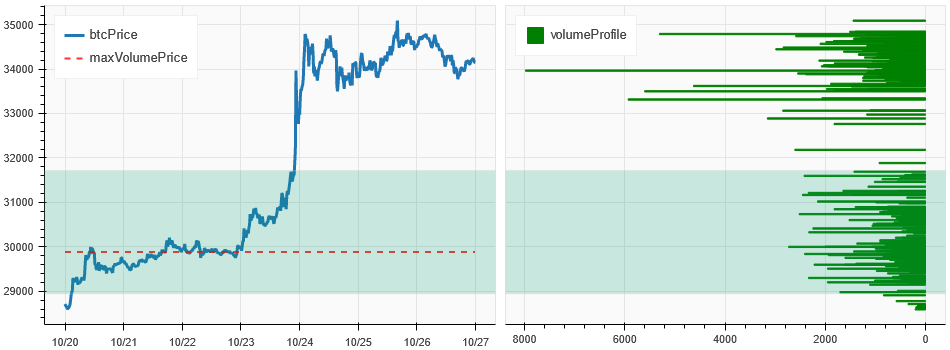
The picture above is the distribution map of BTC’s intensive trading areas in the past week.
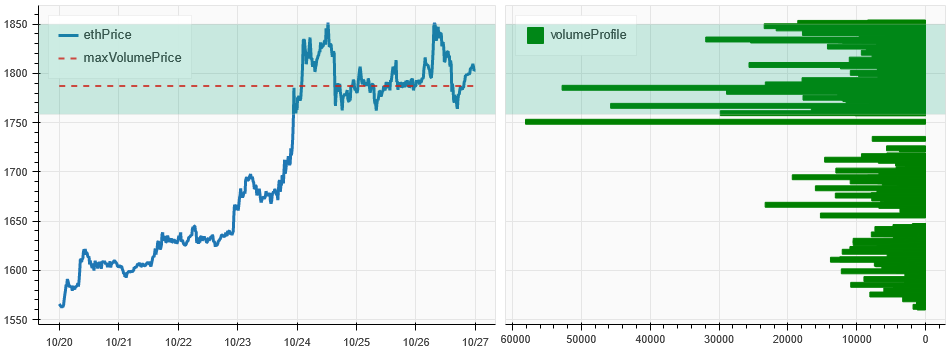
The picture above is the distribution map of ETH’s intensive trading areas in the past week.
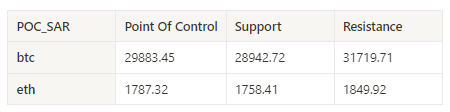
Table showing the intensive weekly trading ranges for BTC and ETH over the past week
Volume and Open Interest
In the past week, both BTC and ETH have seen a surge in trading volume on 10.24 and a decrease in open interest.
The price trend of BTC at the top of the picture above, the middle is the trading volume, the bottom is the open interest, the light blue is the 1-day average, and the orange is the 7-day average. The color of the K line represents the current status. Green means that the price rise is supported by trading volume, red means positions are being closed, yellow means positions are slowly accumulating, and black means congestion.
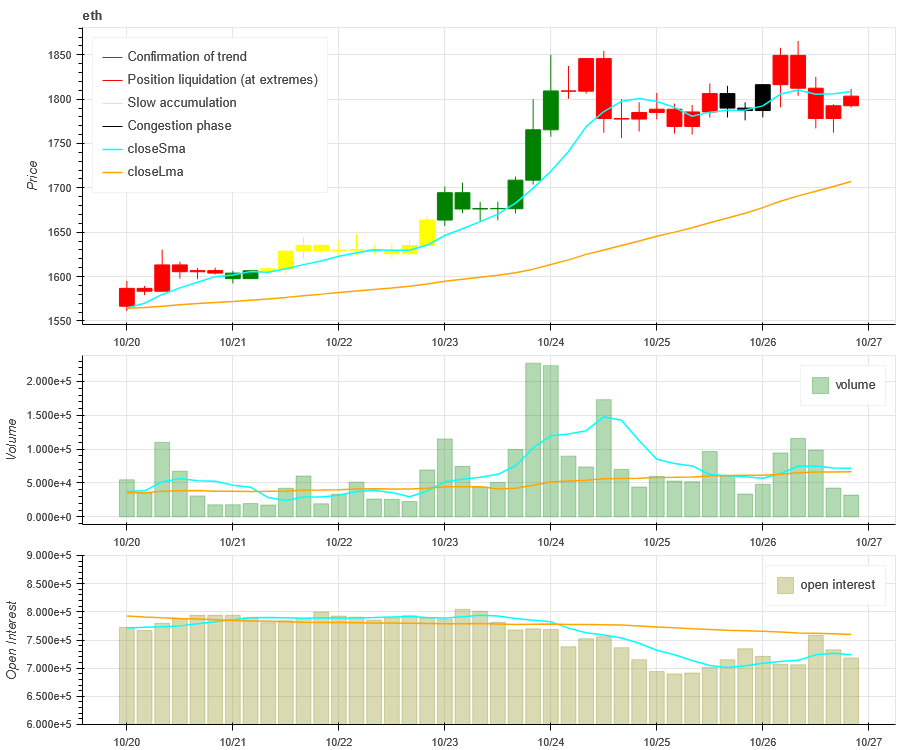
The price trend of ETH at the top of the picture above, the middle is the trading volume, the bottom is the open interest, the light blue is the 1-day average, and the orange is the 7-day average. The color of the K line represents the current status. Green means that the price rise is supported by trading volume, red means positions are being closed, yellow means positions are slowly accumulating, and black means congestion.
Historical Volatility vs. Implied Volatility
The historical volatility of BTC and ETH over the past week was highest at 10.23, with implied volatility rising.
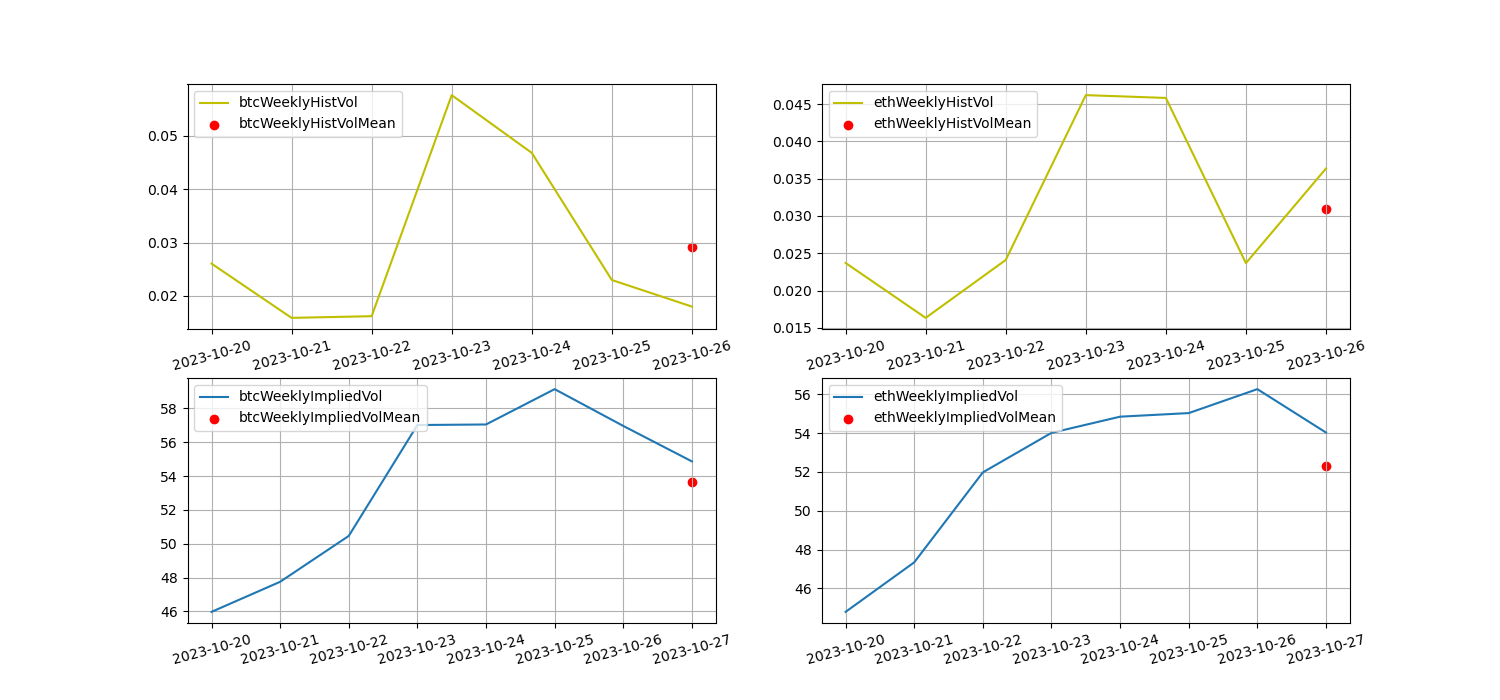
The yellow line is historical volatility, the blue line is implied volatility, and the red dot is its 7-day average
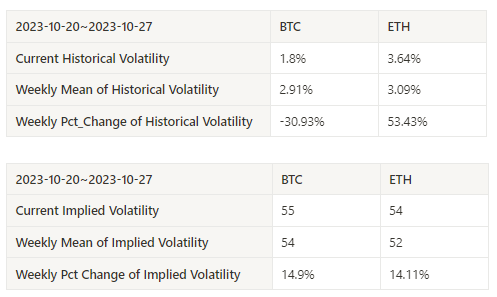
event driven
Awaiting the FOMC interest rate meeting on 11.01 next month
sentiment indicator
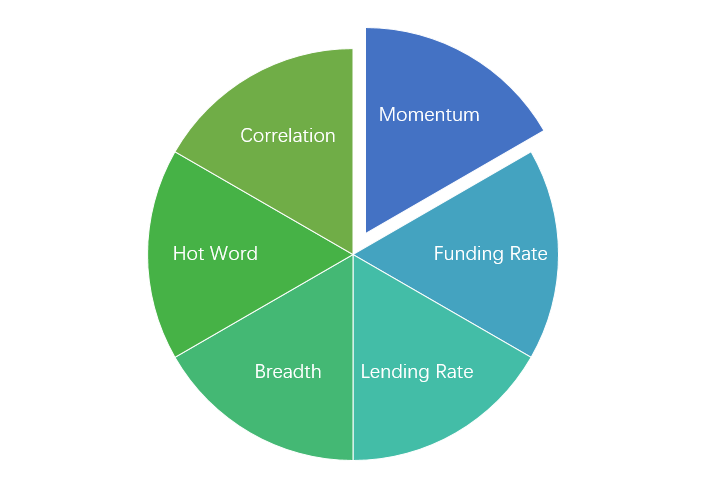
momentum sentiment
Among Bitcoin/Gold/Nasdaq/HSI/A 50 over the past week, Bitcoin was the strongest, while the Nasdaq was the worst performer.
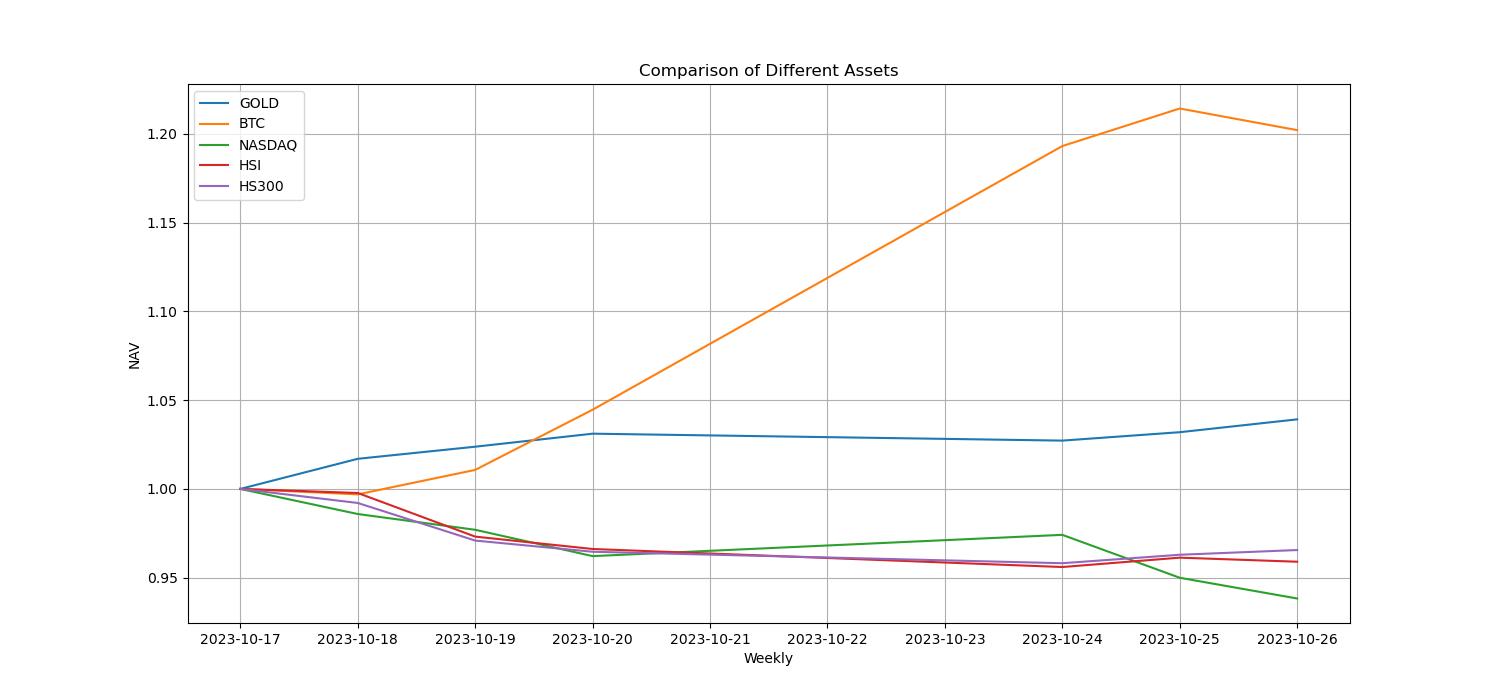
The picture above shows the trends of different assets over the past week.

Lending interest rate_Lending sentiment
The annualized return on USD lending averaged 18.1% in the past week, and short-term interest rates have fallen back.
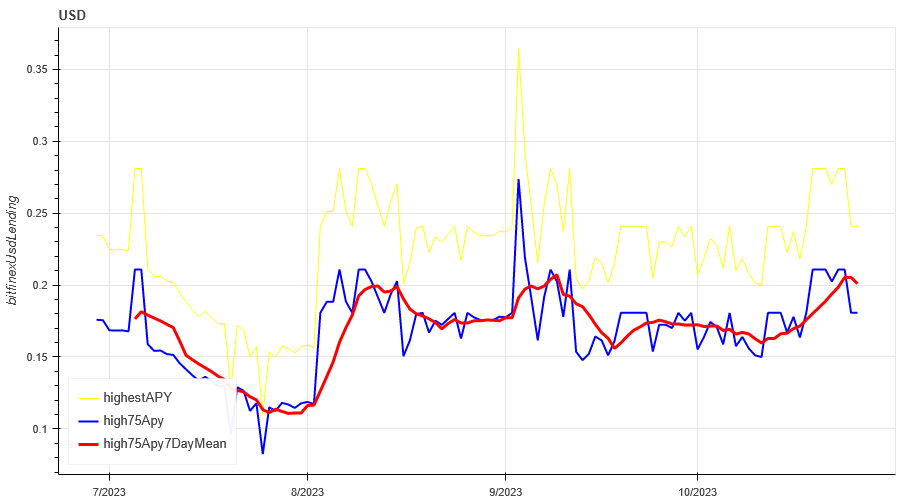
The yellow line is the highest price of the USD interest rate, the blue line is 75% of the highest price, and the red line is the 7-day average of 75% of the highest price

Funding Rate_Contract Leverage Sentiment
The average annualized return on BTC tariffs in the past week was 12%
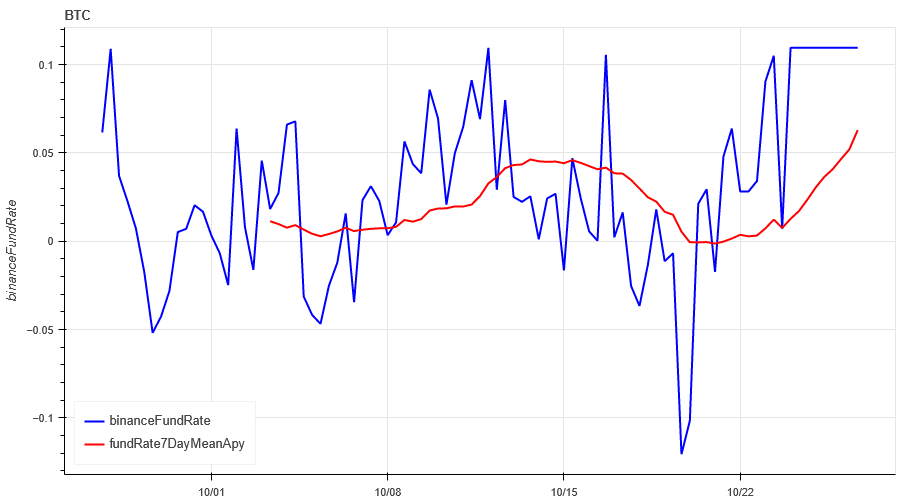
The blue line is the funding rate of BTC on Binance, and the red line is its 7-day average

The table shows the average return of BTC fees for different holding days in the past
Market Breadth_Overall Sentiment
90% of the 46 coins selected over the past week are above the 30-day moving average, and the market is currently in an uptrend.
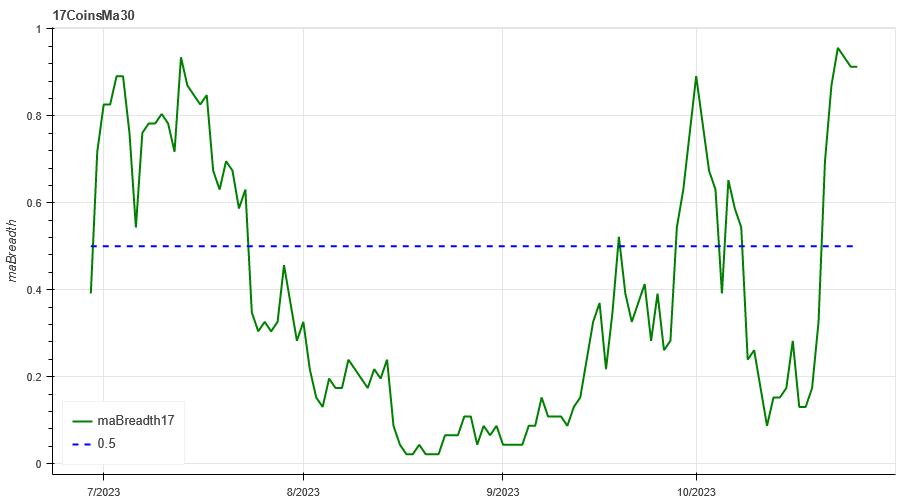
The picture above is [btc, eth, bnb, ltc, bch, doge, matic, sol,link,uni, enj,gala , mana, axs, dydx, fet ,gmx, xlm, xrp, ada, trx, sol, dot, avax, shib, atom, xmr, etc, ldo, hbar, apt, vet, qnt, vet,crv, aave, algo , ftm, ape, neo, sand, eos, xtz, rndr, theta, mkr] proportion above the 30-day moving average
Market Correlation_Consistent Sentiment
The correlation among the 46 coins selected in the past week has remained around 0.9, and the prices among different varieties have produced consistent upward trends.
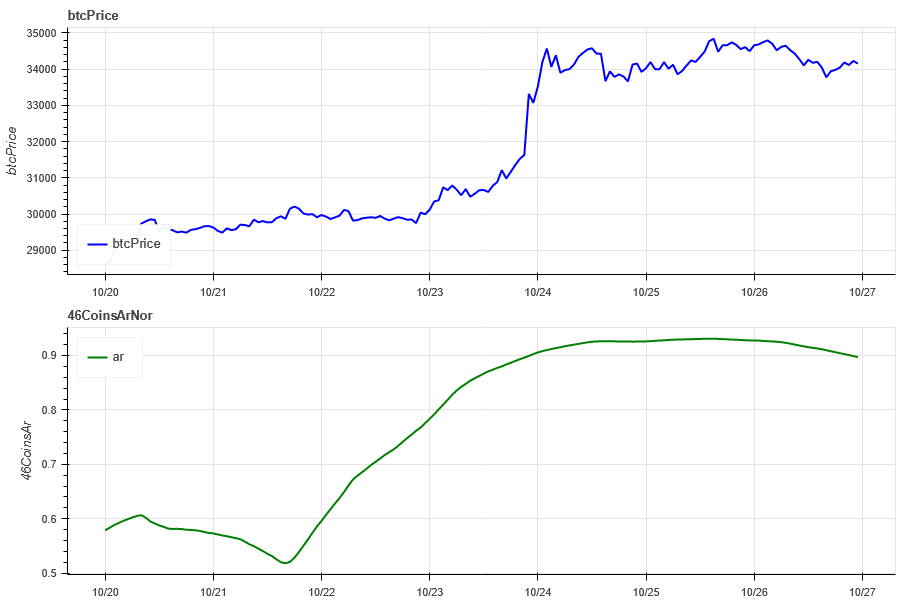
The blue line in the above picture first shows the Bitcoin price, and the green line is [btc, eth, bnb, ltc, bch, doge, matic, sol, link, uni, enj,gala, mana, axs, dydx, fet ,gmx, xlm, xrp, ada, trx, sol , dot, avax, shib, atom, xmr, etc, ldo, hbar, apt, vet, qnt, vet, crv, aave, algo, ftm, ape, neo, sand, eos, xtz, rndr, theta, mkr] overall Correlation
Market Hotspots_Social Media Sentiment
The most popular stocks in the past week are GALA/NEO/GNS, among which Gala has experienced a large increase.
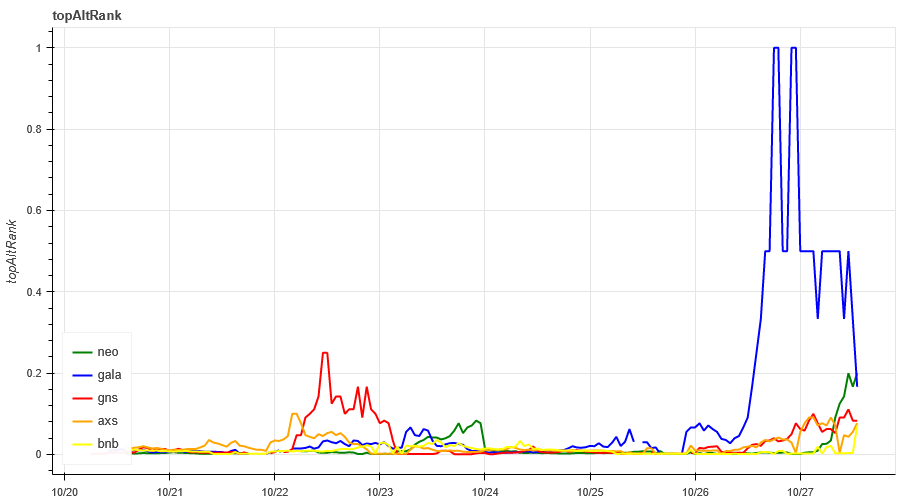
Data Sources:https://lunarcrush.com/categories/cryptocurrencies
Summarize
Several major positives for BTC are the expected issuance of ETFs by large investment institutions, the approaching halving time, and the independent trend of U.S. dollar assets such as U.S. stocks. However, attention should be paid to the risk of volatility. In the past week, BTC broke through a 16-week high, ETH also experienced a large increase, and the implied volatility increased. You can pay attention to recent hot currencies.
Twitter: @DerivativesCN
Website: https://dcbot.ai/