Crypto market sentiment research report (10.13–10.20): Fake news ignites trading sentiment


Fake news fuels trading sentiment
The cryptocurrency market experienced a shocking scene on the night of 2023.10.16, all because of an own news. Bitcoin first soared by 10% and reached the $30,000 mark in one fell swoop. Unexpectedly, the market suddenly changed shortly after and dropped by $2,000. It turned out that the problem lay in an article about BlackRock Bitcoin Spot ETF Approved ” false news, although the official immediately jumped out to refute the rumor, but the market washout of both longs and shorts has already been staged, and investors who were overjoyed have also taken a roller coaster ride.
Market technical and emotional environment analysis

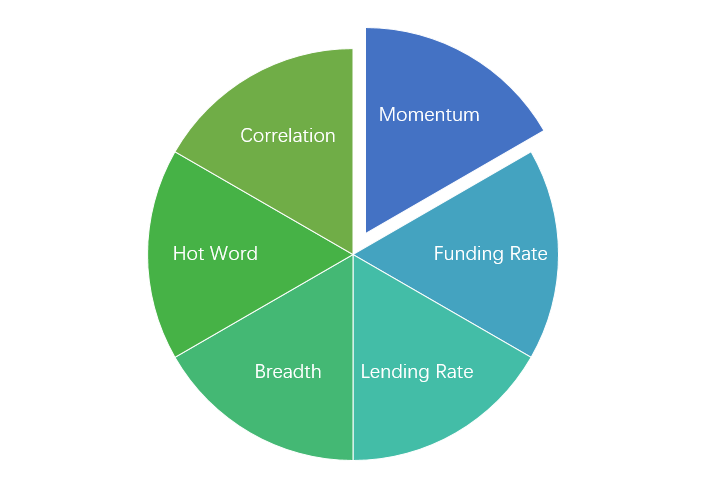
Technical indicators
Price trend
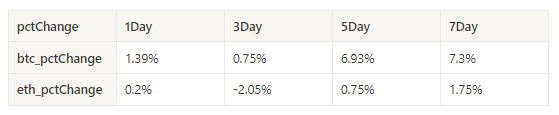
BTC prices increased by 7.3% over the past week, and ETH prices increased by 1.75%.
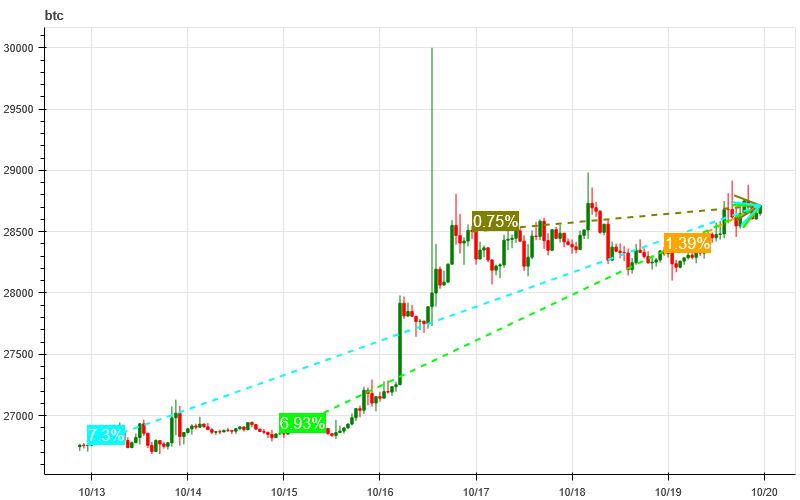
The picture above is the price chart of BTC over the past week
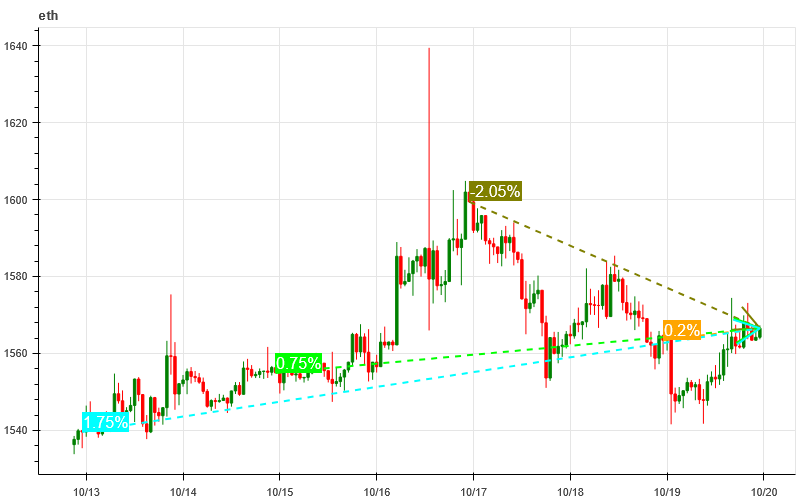
ETH price chart for the past week
Table showing the rate of price change over the past week
Price and volume distribution chart (support and resistance)
Prices BTC went into strong bullish territory over the past week, and ETH was in a volatile range.
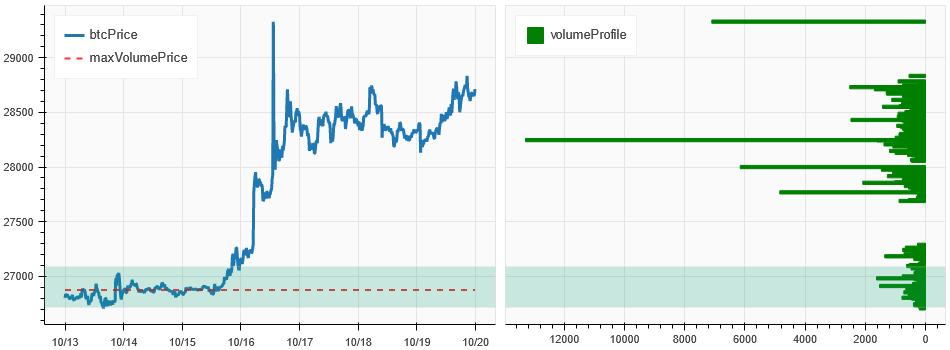
The picture above is the distribution map of BTC’s intensive trading areas in the past week.
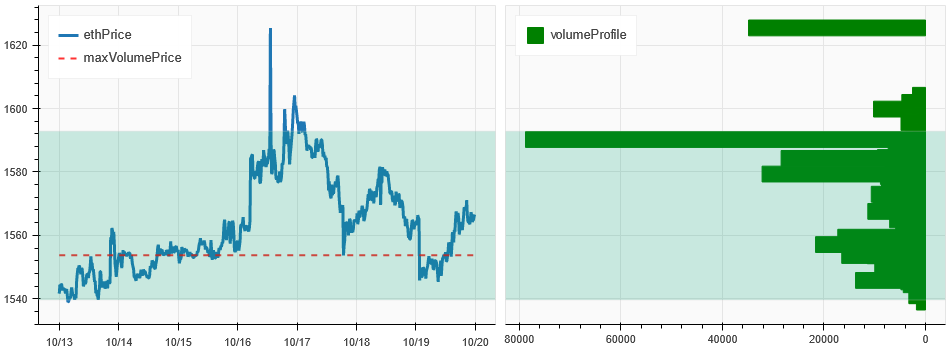
The picture above is the distribution map of ETH’s intensive trading areas in the past week.
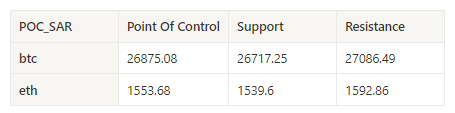
The table shows the intensive trading range of BTC and ETH in the past week.
Volume and Open Interest
BTC vs. ETH trading volume surged at 10.16 over the past week; open interest declined from highs.
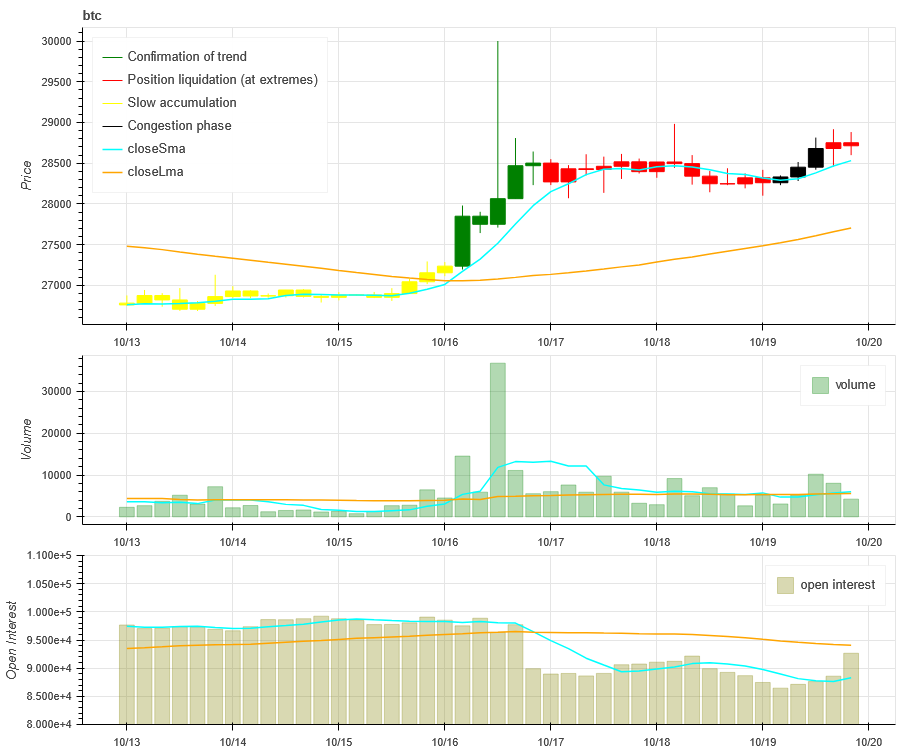
The price trend of BTC at the top of the picture above, the middle is the trading volume, the bottom is the open interest, the light blue is the 1-day average, and the orange is the 7-day average. The color of the K line represents the current status. Green means that the price rise is supported by trading volume, red means positions are being closed, yellow means positions are slowly accumulating, and black means congestion.
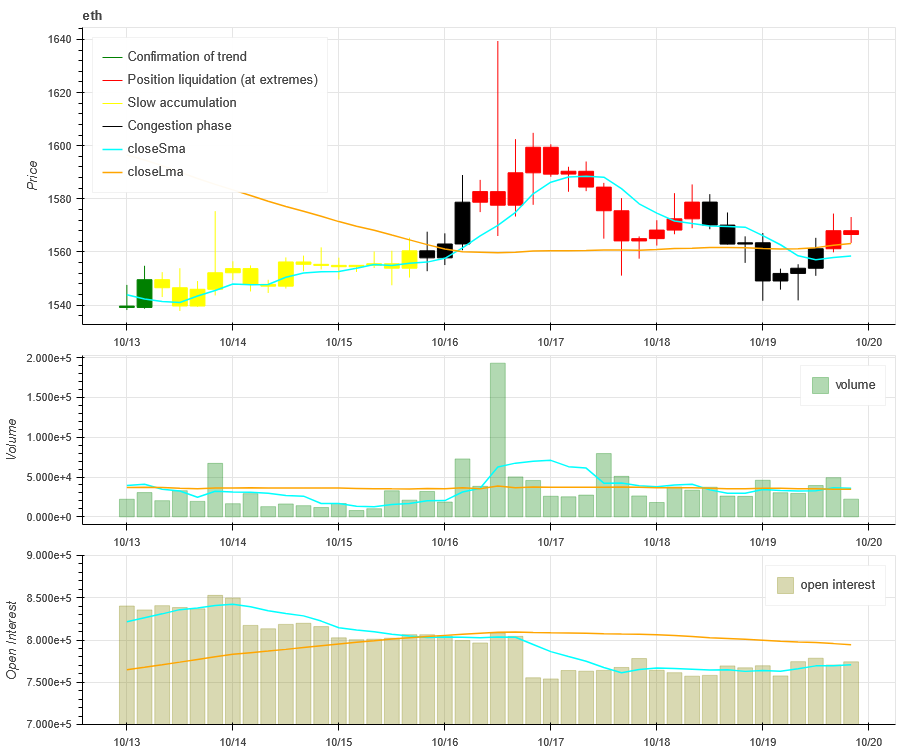
The price trend of ETH at the top of the picture above, the middle is the trading volume, the bottom is the open interest, the light blue is the 1-day average, and the orange is the 7-day average. The color of the K line represents the current status. Green means that the price rise is supported by trading volume, red means positions are being closed, yellow means positions are slowly accumulating, and black means congestion.
Historical Volatility vs. Implied Volatility
In the past week, the historical volatility of BTC was the highest at 10.16, and the implied volatility increased; the historical volatility of ETH was the highest at 10.16, and the implied volatility decreased.
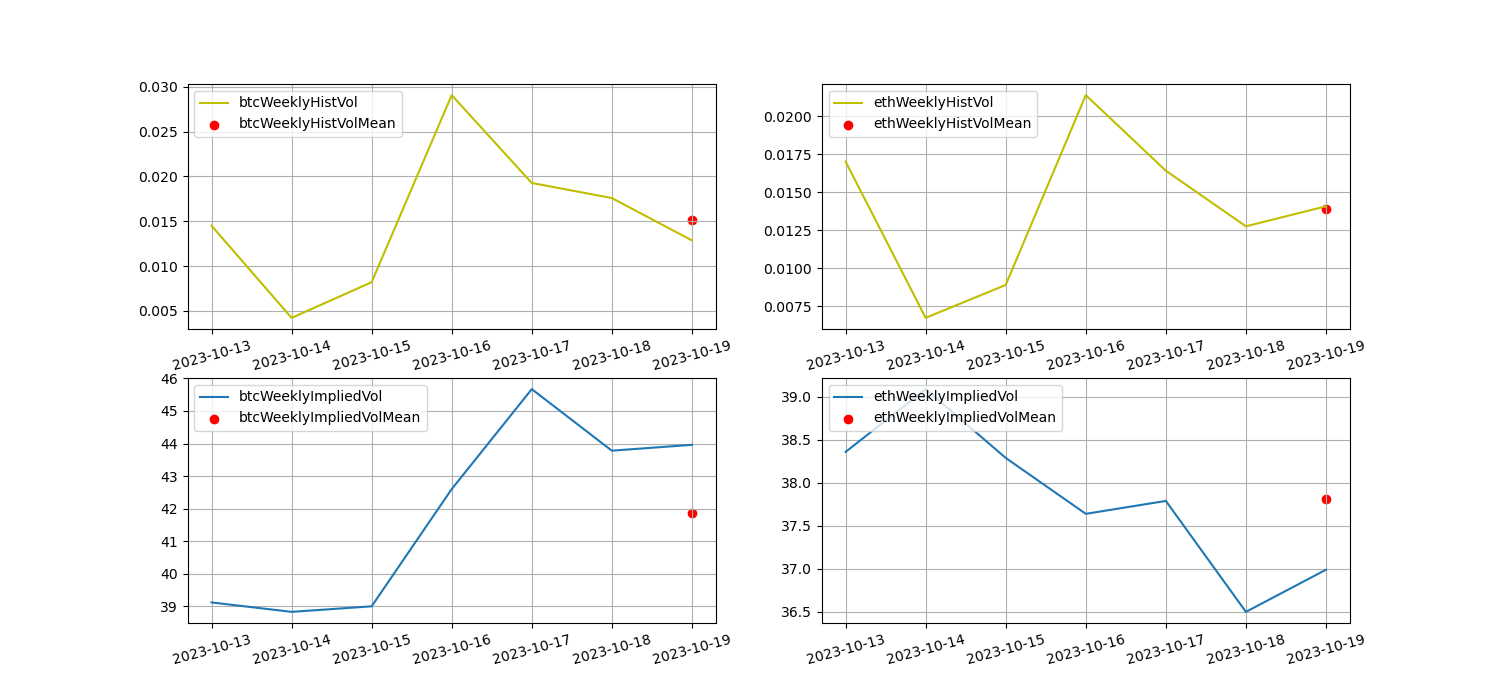
The yellow line is historical volatility, the blue line is implied volatility, and the red dot is its 7-day average
event driven
Awaiting the FOMC interest rate meeting on 11.01 next month.
sentiment indicator
USD Asset Comparison_Momentum Sentiment
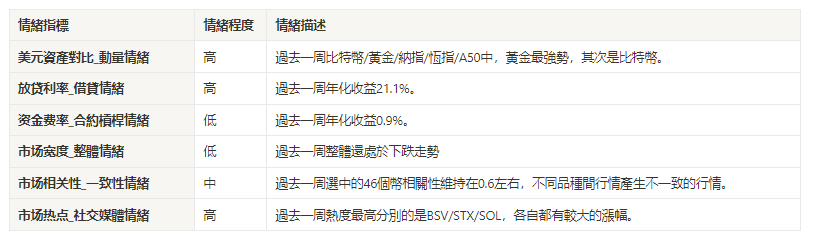
Among the Bitcoin/Gold/Nasdaq/HSI/A 50 over the past week, gold was the strongest, followed by Bitcoin, while the worst performer was the A 50.
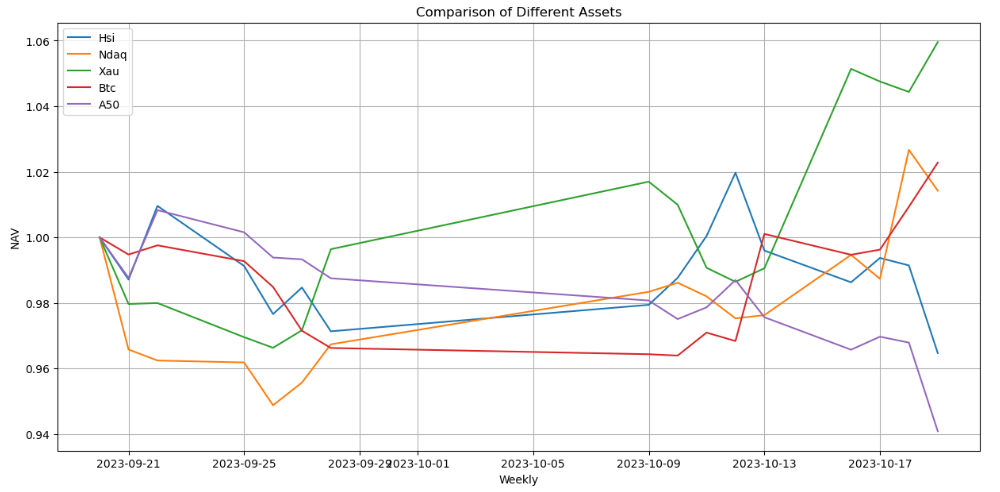
The picture above shows the trends of different assets over the past week.
Lending interest rate_Lending sentiment
Annualized returns on USD lending averaged 21.1% over the past week, with short-term interest rates rising.
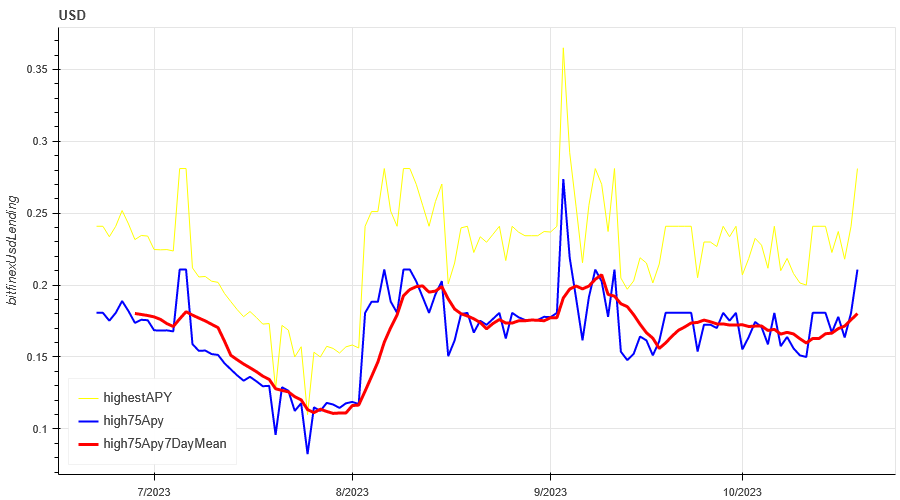
The yellow line is the highest price of the USD interest rate, the blue line is 75% of the highest price, and the red line is the 7-day average of 75% of the highest price
The table shows the lending rate and the average return for different holding days in the past

Funding Rate_Contract Leverage Sentiment
The average annualized return on BTC tariffs in the past week was 0.9%
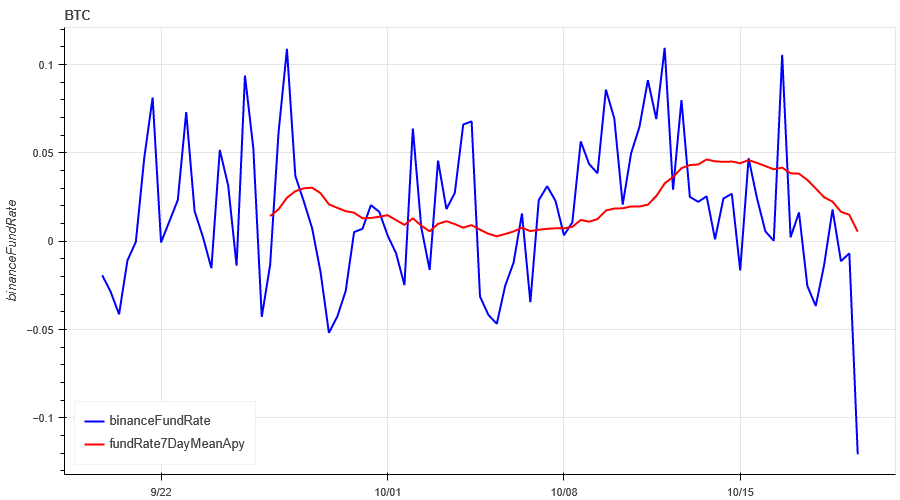
The blue line is the funding rate of BTC on Binance, and the red line is its 7-day average
The table shows the average return of BTC fees for different holding days in the past

Market Breadth_Overall Sentiment
With 17% of the 46 coins picked over the past week above the 30-day moving average, the market is currently in a downward trend.
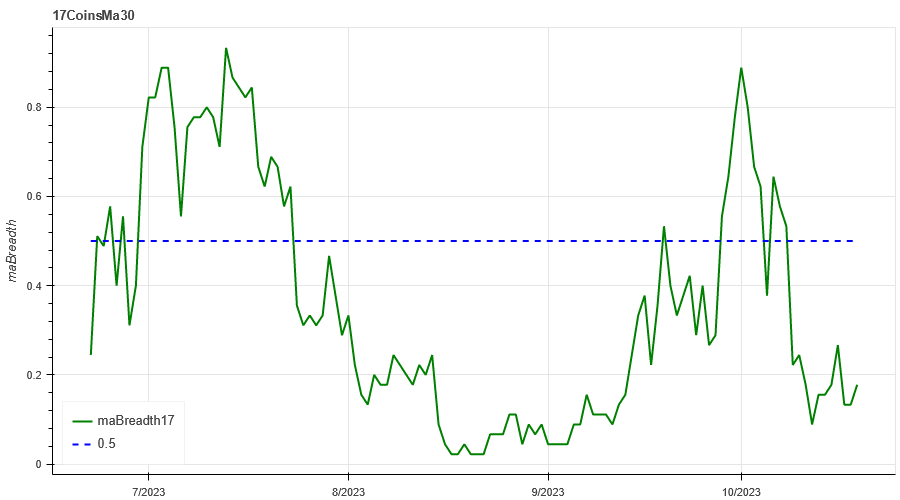
The picture above is [btc, eth, bnb, ltc, bch, doge, matic, sol,link,uni, enj,gala , mana, axs, dydx, fet ,gmx, xlm, xrp, ada, trx, sol, dot, avax, shib, atom, xmr, etc, ldo, hbar, apt, vet, qnt, vet,crv, aave, algo , ftm, ape, neo, sand, eos, xtz, rndr, theta, mkr] proportion above the 30-day moving average
Market Correlation_Consistent Sentiment
The correlation among the 46 coins selected in the past week has remained around 0.6, and the prices among different varieties have been inconsistent.
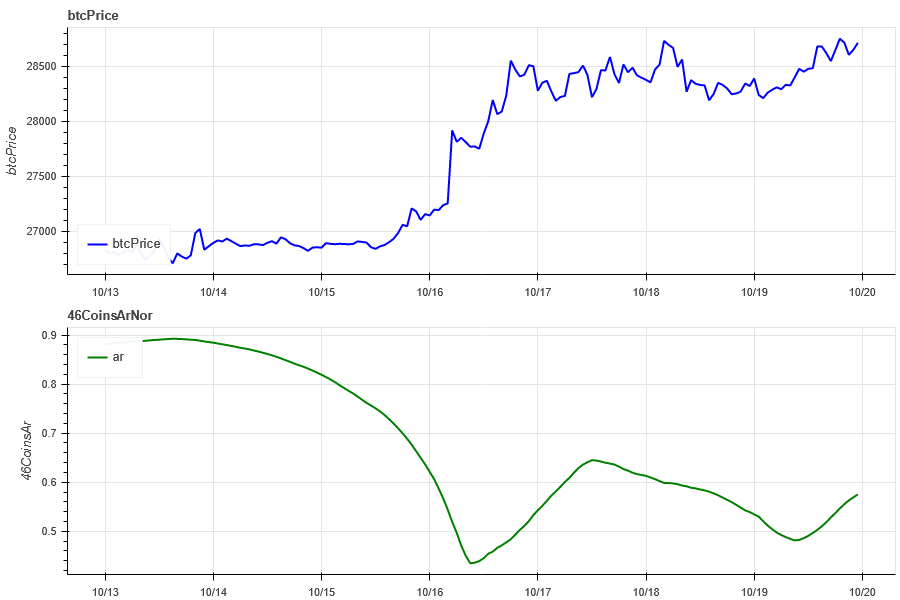
The blue line in the above picture first shows the Bitcoin price, and the green line is [btc, eth, bnb, ltc, bch, doge, matic, sol, link, uni, enj,gala, mana, axs, dydx, fet ,gmx, xlm, xrp, ada, trx, sol , dot, avax, shib, atom, xmr, etc, ldo, hbar, apt, vet, qnt, vet, crv, aave, algo, ftm, ape, neo, sand, eos, xtz, rndr, theta, mkr] overall Correlation
Market Hotspots_Social Media Sentiment
The most popular ones in the past week are BSV/STX/SOL, each with a large increase.
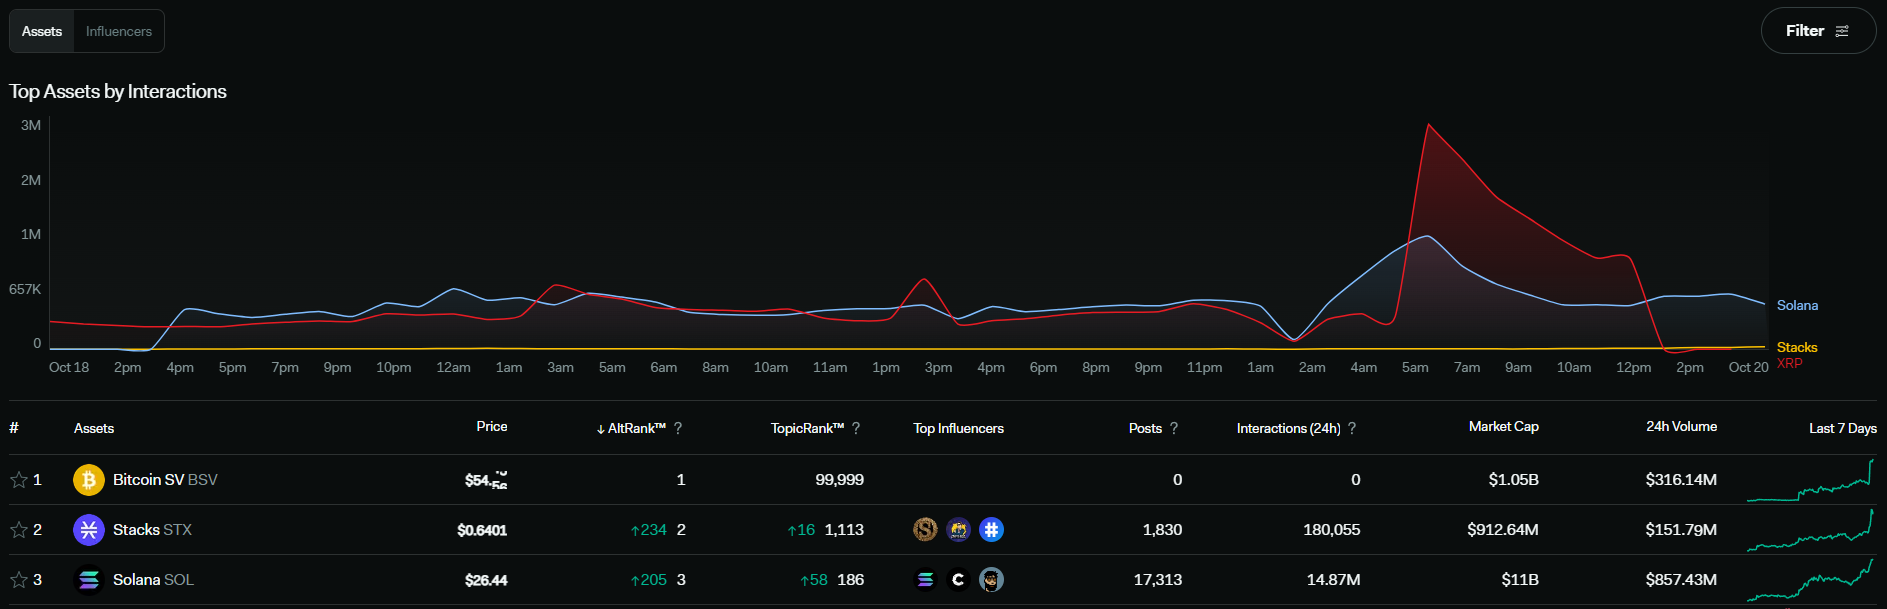
Data Sources: [https://lunarcrush.com/categories/cryptocurrencies](https://lunarcrush.com/categories/cryptocurrencies)
Summarize
BTC has gained momentum in the past week, while ETH is still fluctuating in a range. BTC volatility has increased significantly. You can pay attention to the more popular SOL.
Twitter: [@DerivativesCN]
Website: [https://dcbot.ai/]
Medium:[https://medium.com/@DerivativesCN](https://medium.com/@DerivativesCN)