Is the subtle link between Ethereum price and revenue a more forward-looking top and bottom signal?


Original author:SAM ANDREW
Original compilation: MarsBit, MK
Ethereum has the attributes of a productive asset, it can generate profits, and these profits belong to token holders. But is it viewed as a productive asset like a stock? Will Ethereums valuation multiple affect the price of ETH?
A valuation multiple is a heuristic for estimating the value of an asset. Google is trading at 30 times earnings and Nvidia is trading at 230 times earnings. If Googles current earnings continue unchanged over the next 30 years, it will take 30 years to recoup your investment in Google. If Googles earnings grow, fewer years will be needed. Compared with Nvidia, Google is relatively cheap in terms of valuation. Entry valuation, such as 30x versus 230x, is not the only driver of investment returns, but it is an important one. Expensive assets, such as Nvidia, already have high growth expectations built into their current valuation multiples. If they fail to meet these lofty expectations, prices will plummet.
Similar valuation multiples can also be applied to the crypto space. Market cap divided by total fees is a crypto valuation multiple. Market cap represents the market’s current perception of an asset’s value. Fees are the total revenue generated by the protocol. A blockchain’s revenue is similar to the profit it distributes across the network. Therefore, the revenue and earnings multiples of a blockchain are the same.
What valuation multiples are Ethereum trading at?
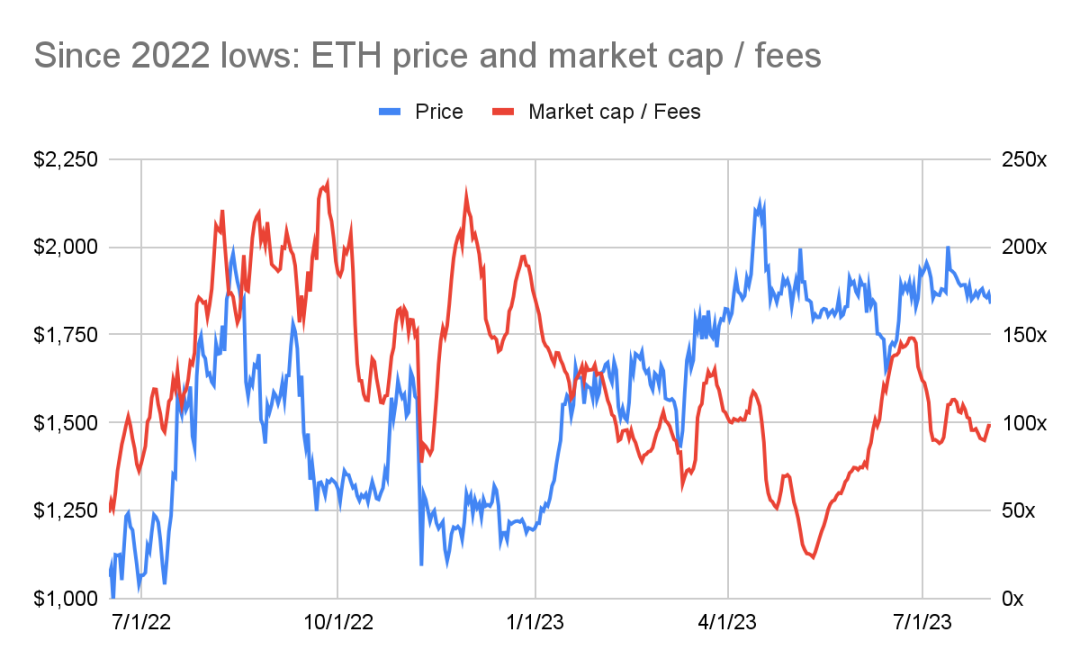
The multiple of the rolling seven-day annualized fee for Ethereums current transactions is 100 times. Since the summer of 2022, Ethereum’s fee multiple has fluctuated between 25x and 235x (see chart below: ETH price and market cap/fees since 2022 lows).
Source: CoinMetrics, artemiz.xyz
unexpected relationship
The chart above shows the inverse relationship between ETH price and valuation multiples. The best time to buy ETH is at the end of 2022, when the price of ETH is around $1200. At that time, however, ETH was valued at a much higher multiple, around 200x fees. By the spring of 2023, the price of ETH is close to $2000, but its fee multiple drops to 50-100 times.
The inverse relationship between price and valuation multiples is unexpected. Typically, it is more profitable to buy an asset when its valuation multiple is lower. Multiples are usually lower before an asset hits a turning point. The market realizes that assets are undervalued. As the price increases, so does the valuation multiple.
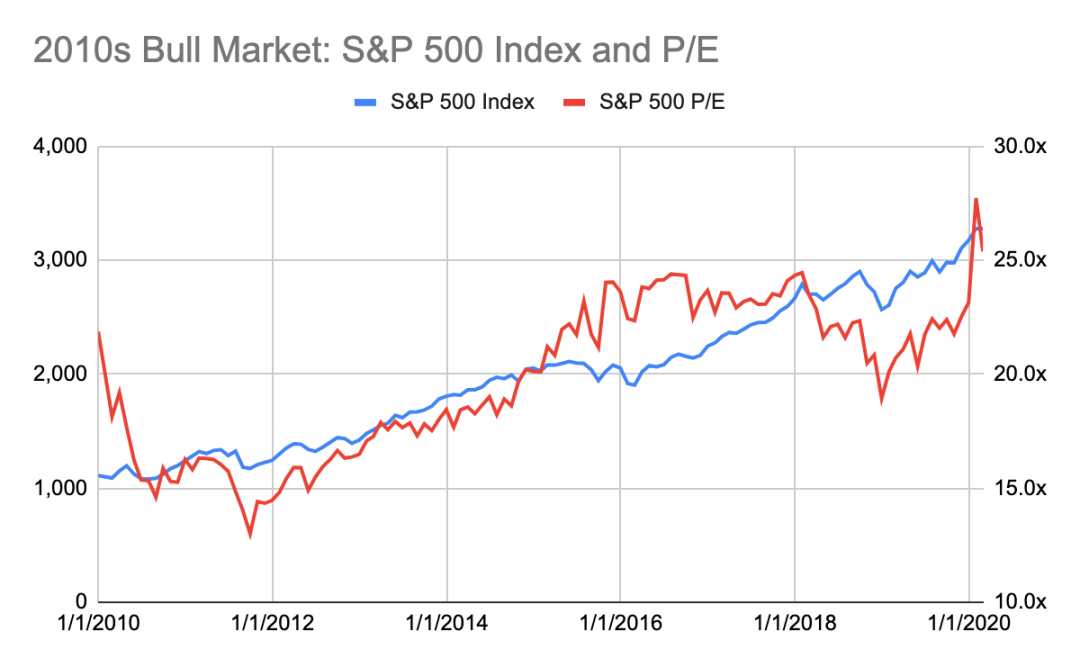
The chart below (2010s Bull Market: SP 500 and P/E Ratio) illustrates the general relationship between price and multiples. It charts the course of the US stock market bull market in the 2010s until the Covid outbreak. The SP 500 traded at about 15 times earnings at the start of the decade, has averaged 18 times since 1928 and 26 times since 2000. The tipping point came in 2011, when the U.S. emerged from the global financial crisis and interest rates were near record lows. Since then, the price and multiples have begun to rise steadily.
Source: Macro Trends
So, what can we infer from Ethereums multiples?
Do Ethereums multiples indicate that ETH is cheap or expensive? How is cheap or expensive reflected in the price performance of ETH? Is this an indicator of a good buying opportunity like the stock market? Analyzing historical data can answer these questions.
In five years, the price of ETH went from $10 to over $4000. This 400x price move makes it difficult to observe the relationship in one chart. Instead, different periods are highlighted to illustrate trends.
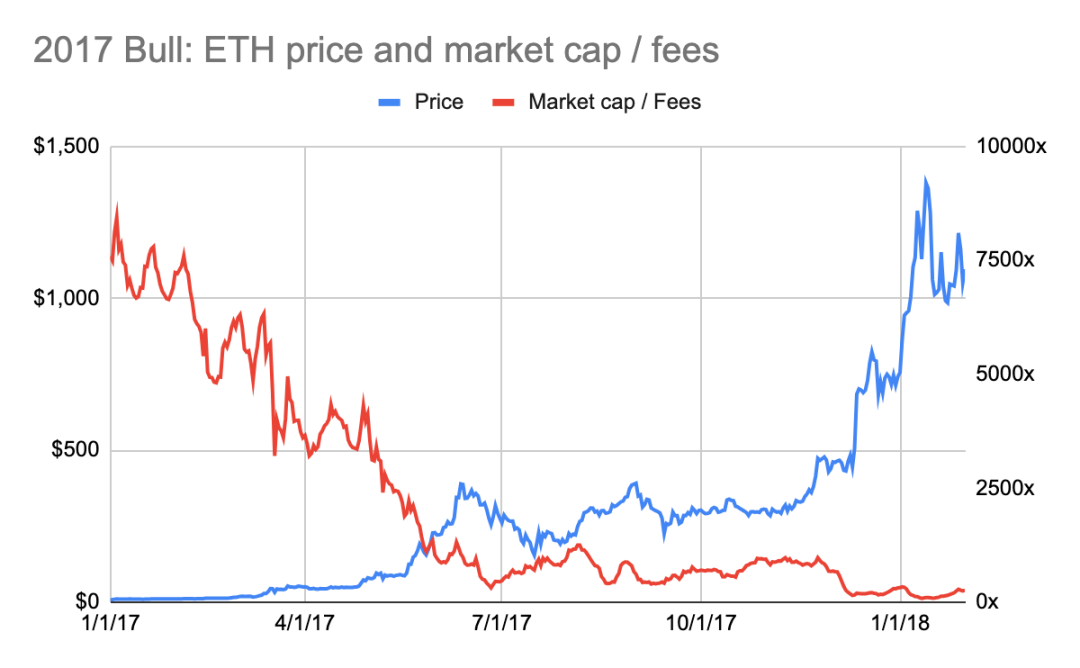
The 2017 bull market highlighted the inverse relationship between multiples and price. In early 2017, ETHs fee multiple reached a staggering 7,700x (see chart below: The 2017 Bull Run: ETH Price and Market Cap/Fees). However, looking at the price action, it was a good time to buy ETH at around $10. Subsequently, the price of ETH increased by 10x and the multiple dropped to 100x.
Source: CoinMetrics, artemis.xyz
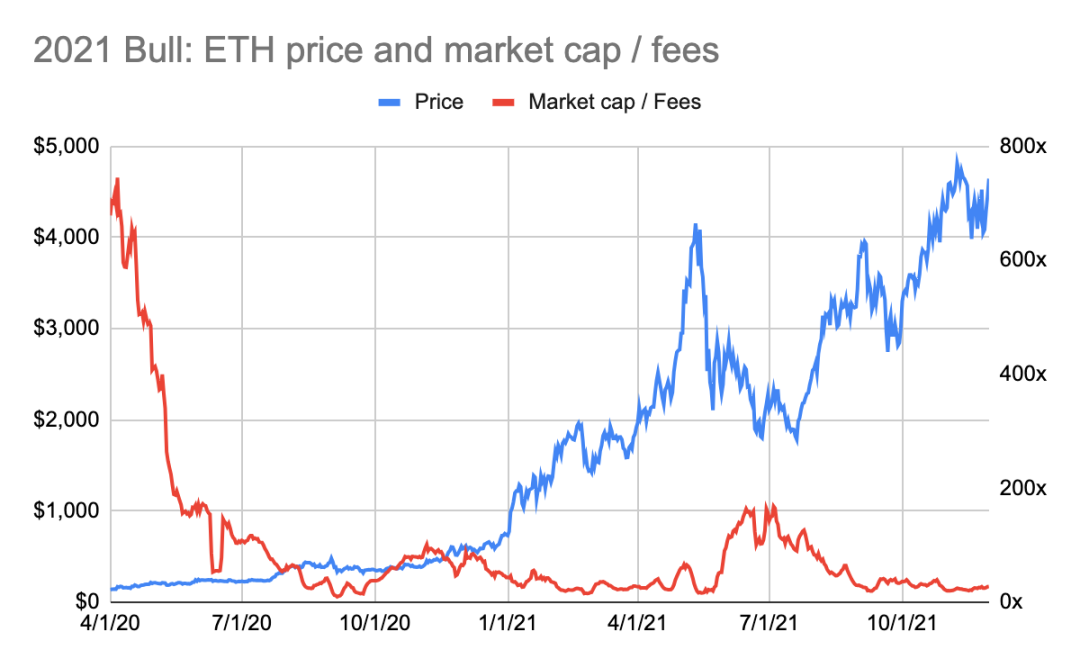
The 2021 bull market is showing the same trend. At the beginning of 2020, the price of ETH was around $200, when it had a fee multiple of 650x (see chart below: 2021 Bull Run: ETH Price and Market Cap/Fees). The price of ETH increased by 24 times while its multiple compressed to 22 times.
Source: CoinMetrics, artemis.xyz
The bear market in Ethereum also exhibited the same inverse relationship. In early 2018, ETHs fee multiple dropped to a low of 200x, while its price peaked near $1,000 (see chart below: 2018 Bear Market: ETH Price and Market Cap/Fees). A few months ago, ETHs fees were over 3000x (see chart above: 2017 Bull Run: ETH Price and Market Cap/Fees).
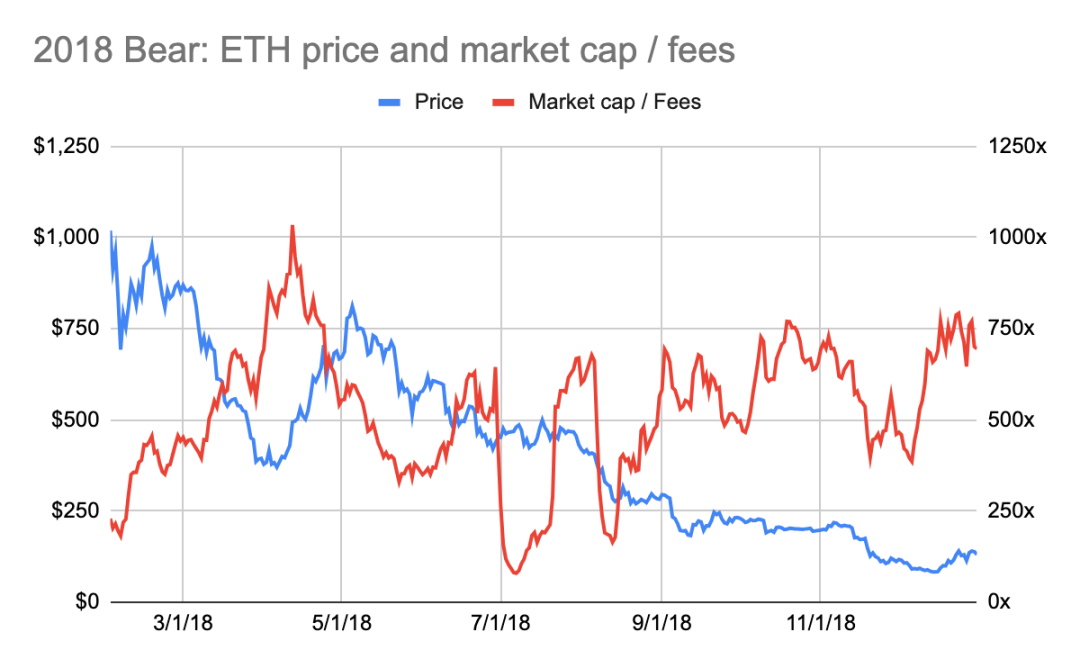
Source: CoinMetrics, artemis.xyz
Likewise, the time to sell is also in late 2021, when ETHs fee multiple dropped to a low of 25x while its price hit a record $4,000 (see chart below: 2022 Bear Market: ETH Price and Market Cap/Fees) .
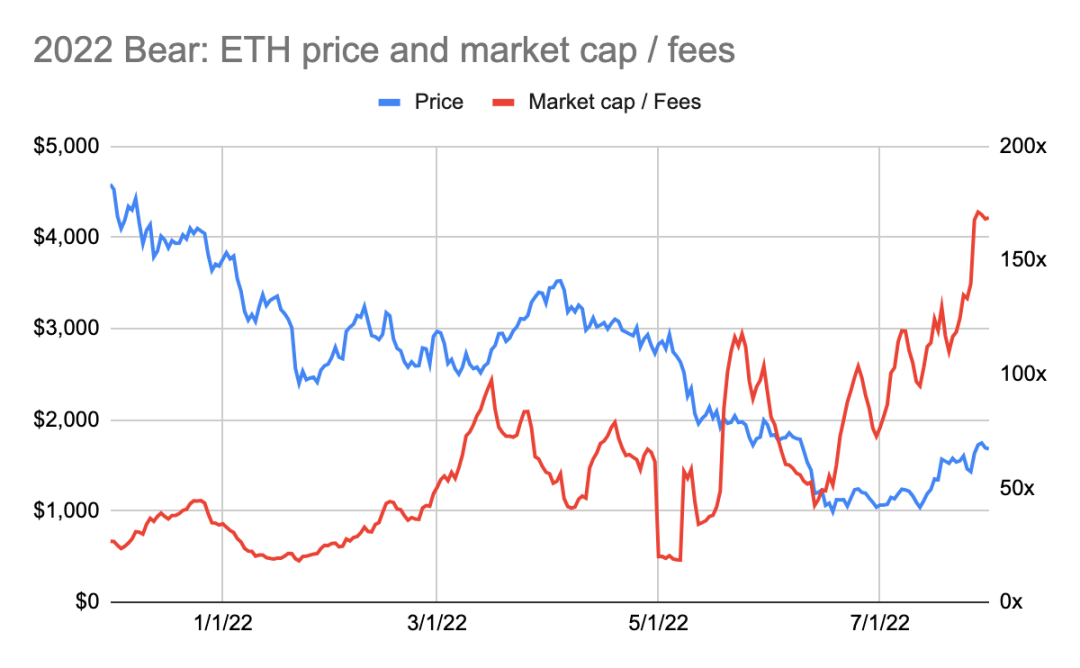
Source: CoinMetrics, artemis.xyz
in conclusion
ETH price and multiples have an inverse relationship. History has shown that it is best to buy ETH when its multiple is at a peak and sell when its multiple is at a trough. This means buying ETH when its valuation multiple is highest and selling when it is lowest.
This is very counter-intuitive and not the same as how productive assets such as stocks are traded. What explains this strange relationship?
This counter-intuitive conclusion can be explained in the following way:
The market is forward-looking.
ETH is not valued as a multiple of fees.
1. The market is forward-looking
Whether it’s stocks, commodities or crypto, markets are forward-looking. Prices reflect future expectations, not what happened in the past. Think of it this way: the value of a company is based on its future cash flows.
The market cap/fee multiple reflects the fees of Ethereum at a specific point in time. The fee used to calculate the multiple is the sum of the past seven days fees multiplied by 52 weeks. It does not reflect Ethereum’s future fee potential. The cost figure is not a forward-looking indicator.
Analyzing historical data confirms that the Ethereum market is forward-looking. During the 2017 bull run, Ethereum fees rose before the rally in Ethereum (see chart below: 2017 Bull Run: ETH Price and Fees). Note that prices did not drop as quickly as fees in early 2018.
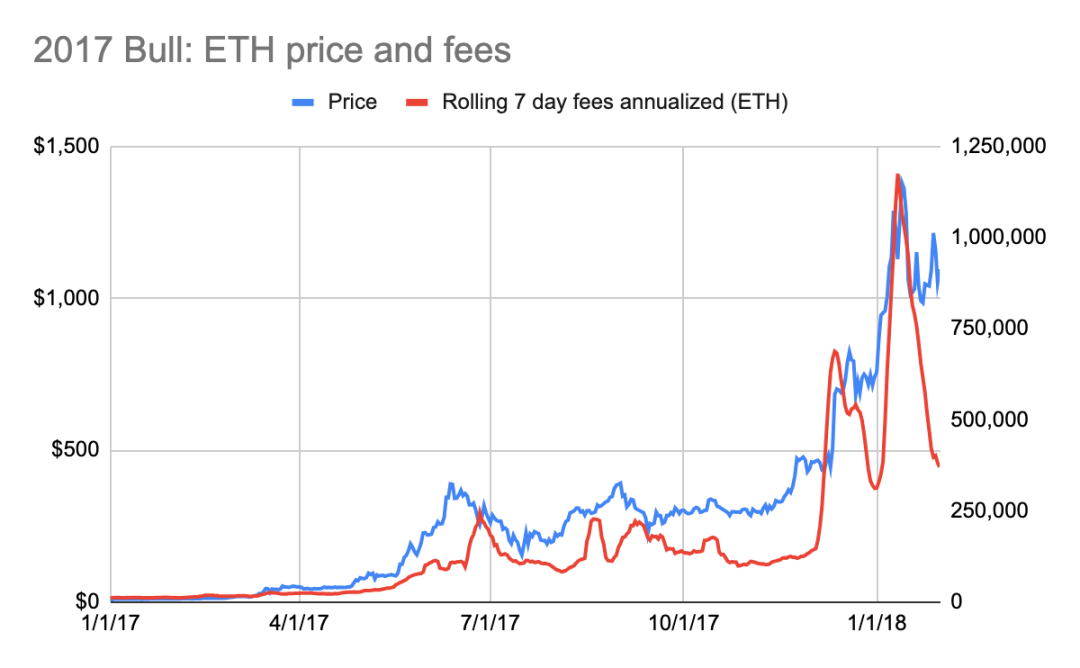
Source: CoinMetrics, artemis.xyz
A similar but weaker trend has emerged in the 2021 bull market. As of May 2021, the price has risen before the corresponding fee increase (see chart below: 2021 Bull Run: ETH Price and Fees). However, in the summer of 2020, fees nearly tripled without a corresponding increase in ETH price. Additionally, in early 2021, the increase in fees led to an increase in the price of ETH. The first tipping point was probably due to Covid. In the summer of 2020, people were in lockdown. DeFi applications are growing explosively. Due to this, users spend more in fees on Ethereum. However, the investment community is not paying attention to the crypto space.
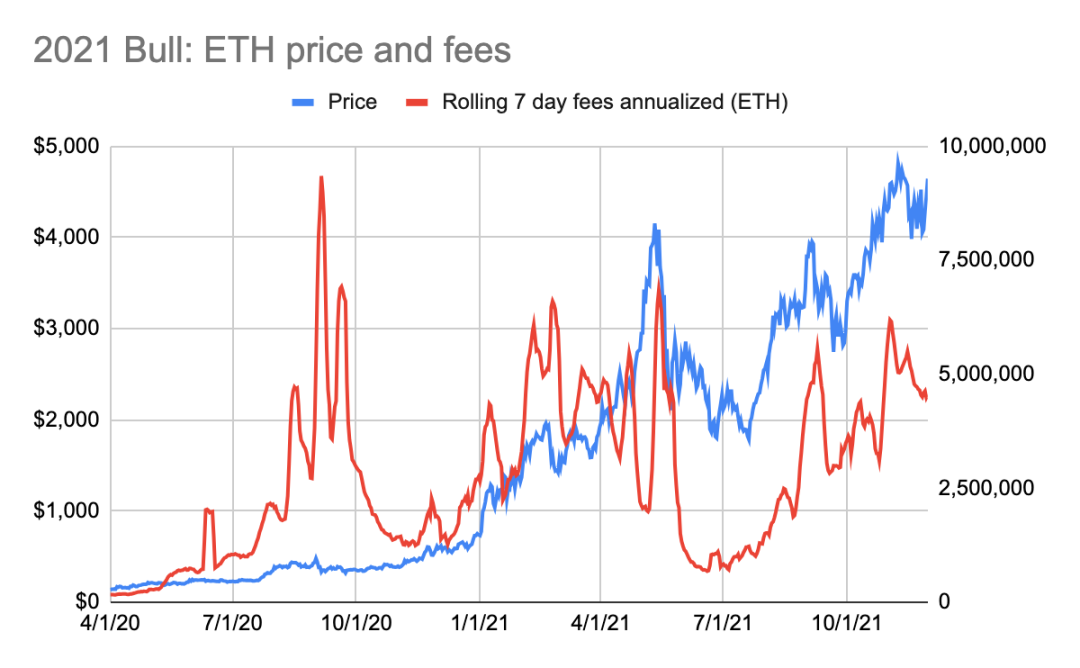
Source: CoinMetrics, artemis.xyz
Evidence of an early rise in ETH prices in response to rising Ethereum fees is clearest in a bull market. During periods of falling or sideways ETH prices, this relationship has neither been disproved nor confirmed. For brevity, we omit the ETH price and fee charts in bear and sideways markets.
2. ETH is not valued as a multiple of fees
The market may not value Ethereum as a multiple of fees. If the market does, then ETHs price and fee multiple should move somewhat in tandem. The logic should be that lower multiples tend to mean more attractive entry prices, not the other way around.
Ethereum’s fee multiple fluctuates wildly, tending toward higher valuation multiples. Since 2016, Ethereum’s multiple has fluctuated between 10x and 8,800x. Since 2021, this range has narrowed to 20x to 235x. Valuation multiples remain relatively high.
Ethereum has the attributes of production, commodity and value storage. Valuation of productive assets is based on multiples of earnings. This is not the case with commodities and store-of-value assets. Its difficult to justify ETHs valuation through multiples of fees, which may indicate that ETH is seen more as a store of value asset than a productive asset.
However, there is a complication! If ETH is not valued as a productive asset, why does the price reflect fee increases early? Fundamentally speaking, it shouldnt be. After all, if ETH is a store-of-value asset, then Ethereum’s fee growth won’t have much of an impact on its valuation.
But fees do have an impact on price, and by how much?
Its hard to say, ETH price is affected by multiple variables, including macro factors, regulation, and competition. It is impossible to isolate the different variables to determine which has the greatest impact on price.
Fundamentals, like fees, do matter in the crypto space, and Ethereum specifically. Fundamentals determine the health and prospects of a network. For Layer 1 blockchains, fundamentals can only go so far in valuing the network. Much of a blockchain’s value lies in its monetary nature. Its ability to serve as a store of value and transfer of value. Its ability to protect the network. Protocols and applications built on Layer blockchains rely more on their productive asset properties, as explained in Token Value Creation: Funnels into one thing.
Therefore, you cannot deduce the price of ETH from the trading multiple. Ethereums cheap or expensive multiples dont tell much. But ethereum’s metrics, particularly its fees, drive price swings.