Modeling Ethereum node MEV: How much do nodes earn?


Original title: "Post-Merge MEV: Modeling Validator Returns"
Original compilation: Kxp, BlockBeats
Original compilation: Kxp, BlockBeats

To commemorate the merger (also known as the Paris hard fork), a giant Ethereum logo has been erected in the center of the Louvre.
summary
After the proof-of-work mining era ends, execution layer transaction fees will be paid to proof-of-stake validators. Due to the EIP-1559 fee burn, the vast majority of the remaining fees actually paid to validators is "Maximum Extractable Value" (MEV).
After the merger, Ethereum will have a fixed 12-second block interval instead of a variable block interval of 13.5 seconds on average. However, this change may not have much effect on MEV instability.
From March 2022 to August 2022, the level of MEV reaching miners has been relatively stable, albeit low.
A model based on paying validators the same level of MEV post-merger shows a median return to validators of 6.1% APR (including MEV and consensus layer rewards), with a lower quartile of 5.3% and an upper quartile of 7.3 % . This is based on data from the past 6 months (March 2022 to August 2022).
introduction
introduction
As Ethereum continues to transition to the Proof-of-Stake (PoS) beacon chain as the mainnet’s consensus engine, many media outlets have focused on reporting on the end of the proof-of-work mining era, and the ensuing issues of energy usage and ethereum Reduced issuance (PoS is more secure and resistant to centralization). However, another consequence of the beacon chain taking over transaction inclusion and ordering responsibilities is that transaction inclusion fees currently paid to miners will instead be paid to block producers. That is, any randomly chosen validator will publish a block every 12 seconds.
The way validators are selected to produce blocks has not changed from the existing procedure, as I mentioned in my first article on validator revenue, even if the validator fully participates, this process will be profitable in terms of revenue Make some random changes. So, for this article, the question is to what extent validators' earnings will be affected by the fees they receive for including transactions into Ethereum's execution layer.
The specific meaning of MEV
In the title, I referred to these execution layer fees as "MEV", but this might be confusing because the term MEV can mean both "miner extractable value" and "maximum extractable value" — Neither of these terms seem to accurately describe the rewards validators get for including or ordering transactions in merged Ethereum blocks. To reduce ambiguity, the Flashbots team introduced the term "realized extractable value" to describe the value actually achieved, rather than the theoretical maximum. However, this naming method can also cause some misunderstandings, and we still can't clarify whether the value is the value "realized" by the searcher, or the actual amount paid to the miner/validator. So, for the sake of simplicity, since the term "MEV" is already widely used, I will use it here to refer to the revenue earned by miners/validators.
So why settle for a fancy term — MEV — if we could have used something as straightforward as transaction fees? The main reasons are as follows: Since Flashbots introduced the fork of geth, the mainstream execution client of Ethereum, the income of transaction recording and sorting has undergone tremendous changes. As of August 2022, about 74% of Ethereum's hash rate is running mev-geth, so that miners can receive more time-sensitive transaction bundles to obtain income, and get rewarded with direct payments (previously the money was It was consumed during the Gas fee auction).
Additionally, mev-boost, a collaborative effort between Flashbots, the Ethereum Foundation, and the client team, will allow validators to profit from the same combined revenue stream. In fact, whether validators choose to run mev-boost or not, the block fees they receive still belong to MEV in a broad sense. More importantly, since the London hard fork introduced EIP-1559, the congestion fee in the transaction fee is no longer paid to miners, but is burned. What this means is that the vast majority of miners' revenue now consists of transactions that pay a special premium for their captured value, MEV, since those less time-sensitive transactions pay miners a nominal fee.
early model
In my previous article on validator rewards, I only focused on the rewards validators receive for participating in the beacon chain (i.e. the consensus layer). Building on this, in July 2021 Flashbots' Alex Obadia and Taarush Vemulapalli presented their early results on the impact of introducing MEV for validator rewards. To this end, they exclusively obtained Flashbots transaction bundle data from a sample of approximately 100,000 blocks. First, they averaged across blocks and applied a fixed value of MEV to each block. They then looked at the 1st and 99th percentiles in this dataset to determine the income range of the validators (which turned out to be significantly different).
In this post, I will further improve this approach by:
1. Look at the overall picture of fee income (not just the Flashbots bundle), as all miner fee income from the execution layer can be considered some kind of MEV
2. Using larger datasets and considering changes in MEV levels over time
3. Model the distribution of the overall outcome
4. Calculate the change in the result distribution of running multi-validator users
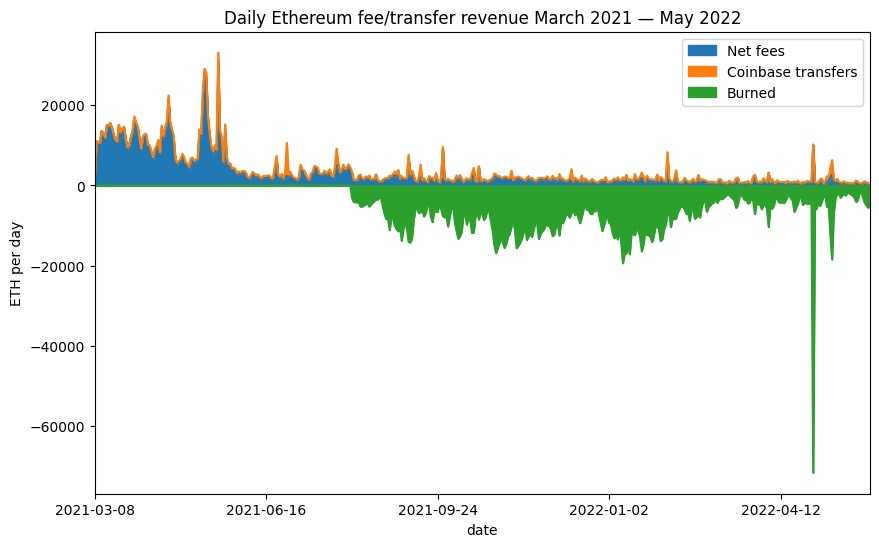
One observation made in the above article is that it is difficult to deduce how EIP-1559 has affected fees paid to miners (at the time of writing, the London hard fork that introduced EIP-1559 had not yet gone live). However, we now have a lot of data on this. In the image below we can see that the portion of the fee that was originally paid to the miners was wiped from the ether supply after the London hard fork. Obviously, the data before and after the London hard fork are not comparable. For this reason, in this post, we will only be dealing with the post-London hard fork data.
# imports / definitions / db connection
# get block summary data from db as pandas dataframe
# plot daily fees/coinbase transfers
select data set
In this article, we will use historical data to make predictions about the future (this method is not reliable in financial events). As I explained in a previous post, the transaction fee market has undergone major changes in August 2021 due to the implementation of EIP-1559 in the London hard fork, which reached block height 12,965, 000 hours, so data before that is not comparable to recent data. The hard fork after this isGray Glacier, which went live at block 15,050,000 and pushed back Ethereum's difficulty bomb. But before that, the average block interval has already started to change. The block interval will change later, but it seems to have a limited impact on the available MEV, so we don't have to worry about itGray GlacierPreviously there was a slight increase in the average block interval.
So we have over a year of usable data since the London hard fork. In fact, we might as well use exactly one year of data to allow time for the fee market to settle. We will focus on the range from blocks 13,136,427 (first block mined on September 1, 2021) to block 15,449,617 (last block mined on August 31, 2022) within the block. These blocks contain a full year's worth of data, totaling approximately 2.3 million blocks.
After choosing this block range, we need to determine how much revenue the miner has for each block. To do this, we'll use Flashbots' mev-inspect-py tool, which is used to scrape blocks of "Coinbase Transfer" transactions, and aggregate fees. This is because there are currently two main ways to pay miners, including Flashbots bundle transactions with MEV - either setting a sufficiently high transaction fee, or paying miners directly as part of the transaction. Seekers have been preferring to pay miners with Gas fees rather than Coinbase transfers due to the higher efficiency of Gas fees. Nonetheless, we would like to include both in our dataset for a more comprehensive picture.
In order to determine the amount of MEV per block, we have to do more work. First, we must exclude transactions in which miners pay themselves, since these transactions do not make economic sense. Therefore, we need to identify multiple addresses controlled by a mining pool (this involves some manual reconnaissance on Etherscan), then label each transaction based on whether the sender address is in a pool group, and based on the Transaction pools to annotate each block. Once this is done, we have the opportunity to generate a per-block MEV digest, minus EIP-1559 burnt ether and pool transfers, and save the result as an extra in the Postgres database populated by mev-inspect-py sheet.
In the end, it turned out that one of the transactions had a much higher transaction fee (7676 ETH) than any of the others. In fact, this transaction fee alone was worth about $23 million, a large percentage of all MEV withdrawn during this period. In this case, the high fees were the result of a mistake, and the vast majority of fees have already been refunded by miners. With this in mind, I chose to remove this transaction from the dataset.
block interval
Before we start looking at the distribution of miner revenue across blocks in more detail, we should pause for a moment to consider another change after the merge, namely the change of block interval from random (about 13.5 seconds between blocks) to a fixed 12 seconds. seconds block interval. Intuitively, we might think that a longer block interval would give miners more opportunities to harvest MEV from incoming transactions, and thus more block profits. We might also think that a change in the block interval greatly affects miners' income.
It is definitely not feasible to investigate these issues by relying on the data on the chain alone, but I also explained this issue in the appendix. Now, suffice it to say that, on the face of it, variable block intervals seem to have very little impact on miner revenue. In the following, I will show that the average frequency of blocks increases slightly, from an average interval of 13.5 seconds to 12 seconds, by inversely proportionaling the revenue of all miners to this ratio. However, I won't be modeling what happens when going from variable intervals to fixed intervals.
Historical MEV levels
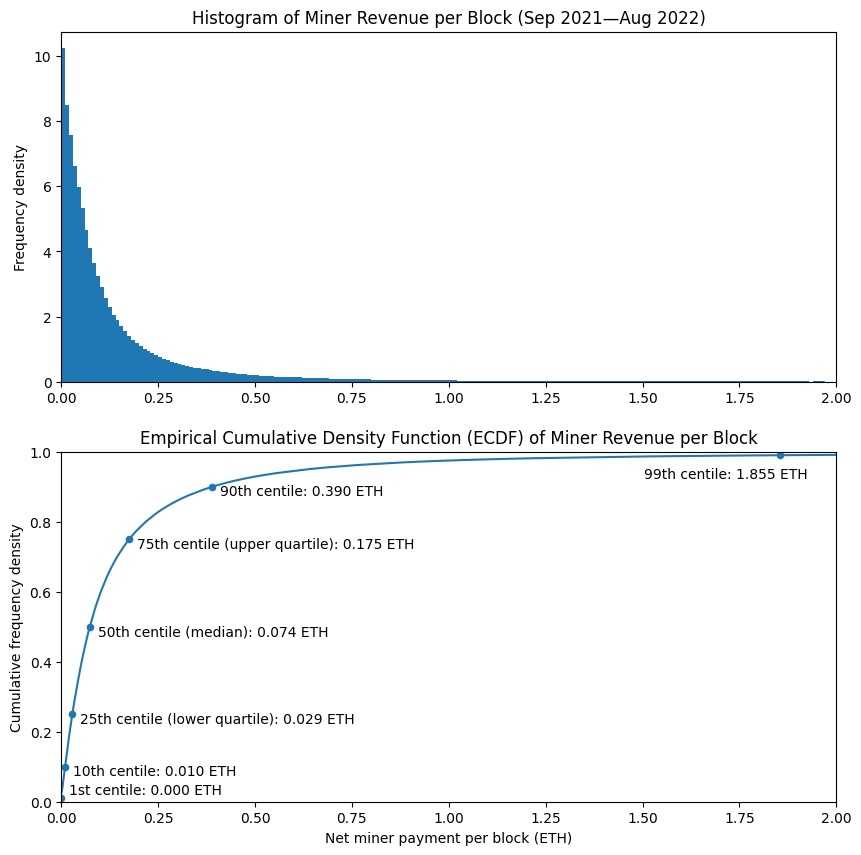
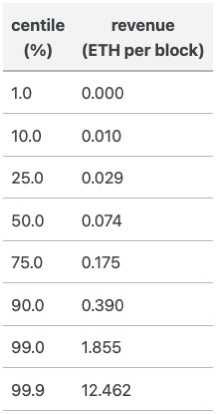
Let’s take a look at the two graphs below to see how much MEV a miner can expect to earn in a typical block. From the histogram we can see that the miner income per block tends to be very low. The second graph may be slightly less intuitive, but it's actually more informative. We can see that the median miner income is 0.07 ETH. Several other points are also marked, with the lowest 1% of blocks paying miners no fees at all, and the highest 1% of blocks paying miners more than 1.8 ETH in fees. As shown in the table below (but not on the graph, as that would distort the axis too much), the top 0.1% of blocks paid miners 12.5 ETH or more in fees.
# plot block revenue histogram and empirical cumulative density function (ecdf)
MEV change trend
The histogram and ECDF above are based on our entire year of data and plotted as a static distribution. However, we might argue that the level of miner income will change over time, and that the distribution of miner income will depend on various factors, such as the level of on-chain activity, trends in the proportion of available MEV paid to miners, or the relationship between L 2 The MEV value available on the base chain compared to the blockchain.
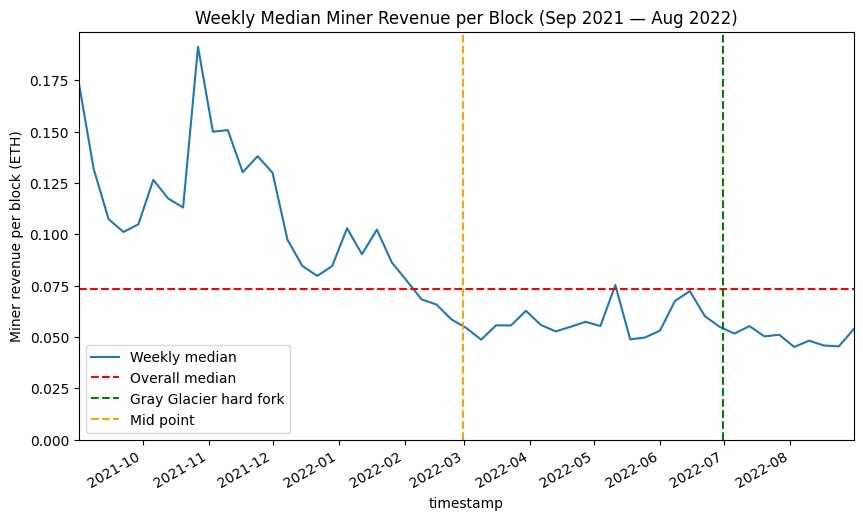
To make this clear, the graph below shows the median block reward for each week in the dataset, with the overall median we saw earlier represented by the dashed red line. The reason for using weeks as a unit is that we found that the activities on the chain will have certain periodic changes every week, for example, there are relatively few activities on weekends. Therefore, by grouping these data and extracting the median, we remove the periodic noise. Obviously, in this chart, the median weekly level of miners' income is on the decline as a whole, and the fluctuations are gradually easing. If we bisect the icon with a dotted orange line, then we can see the two halves as two separate parts representing the level of MEV paid to miners under different network/market conditions. What we need to take away from this, however, is that we cannot place a great deal of confidence in any estimates of future revenues based on historical data (keep this in mind, as this is what I Content).
# Look at variation across the dataset
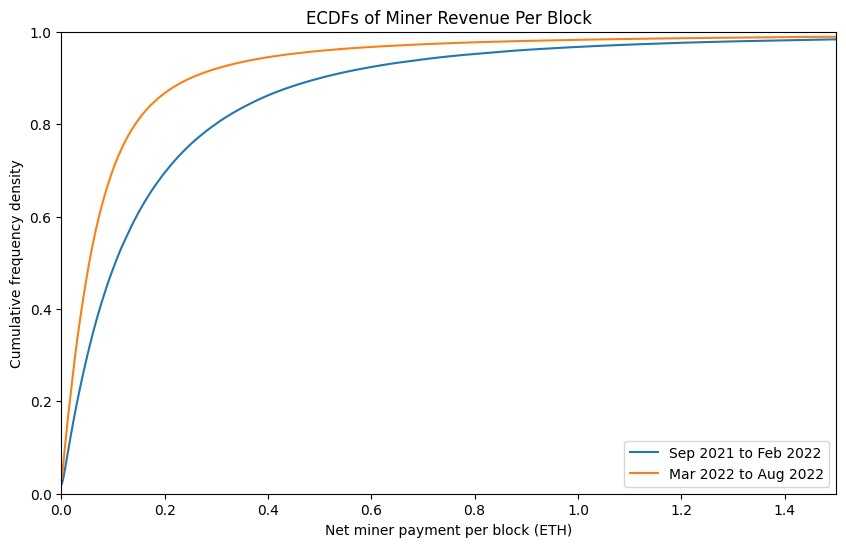
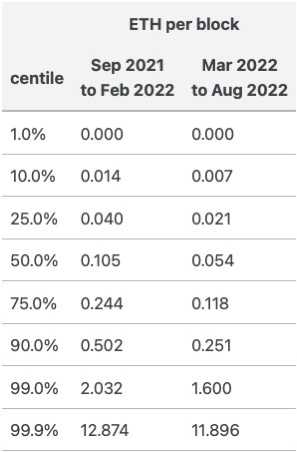
Since miner income levels in our year-long dataset are not stable, we can compare the before and after parts of the dataset in a more granular way. The figure below shows the ECDF of the two parts of the data set, where the blue line represents the first half of the data set, the orange line represents the second half, and the blue line is significantly lower than the orange line. The x-axis shows income data, and at each quartile, miner income levels are higher in the first half of the dataset. The ECDF for the entire dataset shown in the previous graph would fall between these two lines. As shown in the table below, the median MEV of each block in the subsequent six months is roughly half that of the previous six months.
# Generate ECDFs for the first half of the dataset versus the second
Simulating post-merger MEV returns
So, combining what we know about a miner's historical block revenue, let's simulate a validator's MEV revenue over the course of a year. Since we are now considering validators and not miners, I will express the result in terms of a percentage return of 32 ETH. We haven't come up with a specific analytical expression for the distribution of revenue per block (it's hard for me to come up with a reasonable expression with the help of Pareto distribution). This complicates the modeling a bit, so in this case we will use a Monte Carlo simulation.
The principle behind this approach is simple: generate a random number uniformly distributed between 0 and 1, and use this number to do a lookup from the ECDF we calculated earlier (the ECDF is scaled to take into account that the average block interval goes from 13.5 seconds to 12 seconds); then, distribute the revenue from that block to a randomly selected validator; finally, repeat the process until we have a year's worth of simulated blocks (2,629,746 blocks in total ). We will perform three such calculations, using the ECDF for the full year dataset, and the ECDF after splitting the dataset into two parts.
We will assume that validators are well behaved (no missing block proposals). We will also use a validator set size of 420,000, which is close to the size of the August 2022 validator set. This number of validators can also be divided into exactly 32 groups, which will be very useful when we study validator groups later.
# simulate a year&# 39 ;s worth of block proposals
# plot ECDF and histogram for single validator return
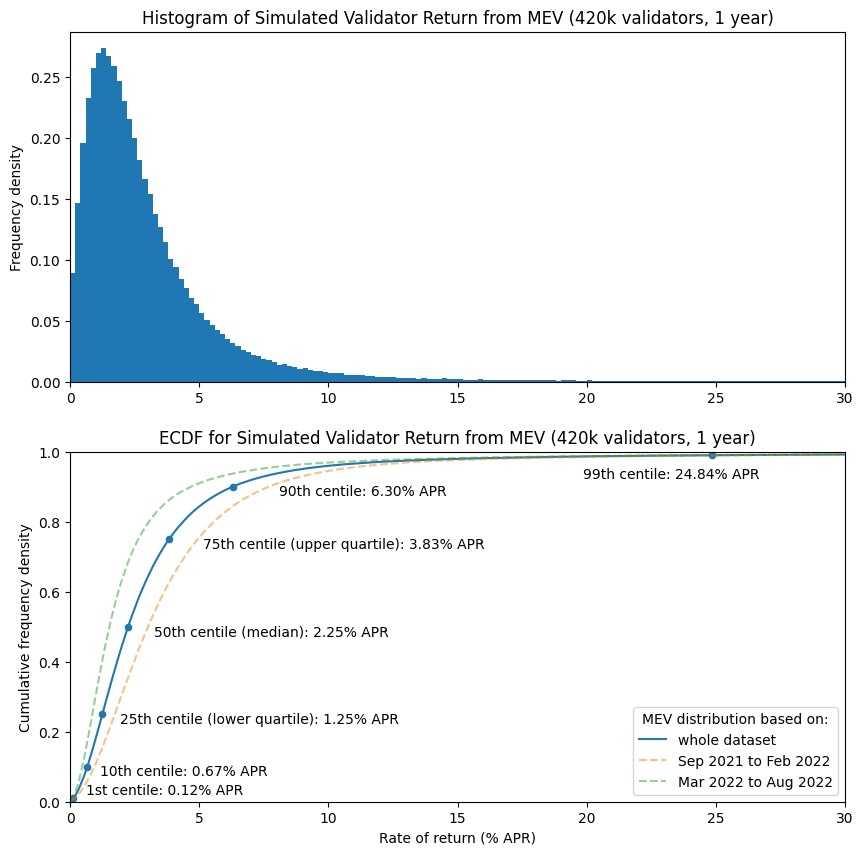
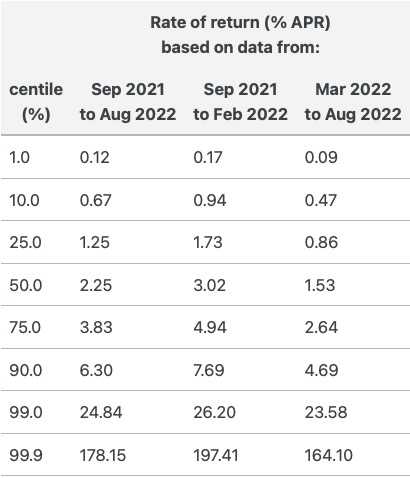
So, at the median, MEV appears to add about 3 percentage points to a validator's APR when based on data from the "high MEV" period (i.e. September 2021 to February 2022), whereas when we use Data for the "low MEV" period (March 2022 to August 2022) increased by about 1.5 percentage points. However, some validators earn almost nothing in MEV over the course of a year, while a lucky few can earn more than 100%.
Build a complete validator reward model
Now that we can see approximate MEV payoffs for validators, let's complete the simulation by introducing rewards for proofs and synchronization committees. becausebeaconcha.inIt is often shown that the participation rate on the beacon chain exceeds 99%. For simplicity, we can default to all participation here. In practice, if the situation we see on mainnet today persists post-merge, the main reason for changes in validator rewards will be due to randomly assigned block producer responsibilities, sync committees, and MEV, not due to validator Performance.
Therefore, in the simulation below, all validators receive the same reward for their superior authentication performance, but every 256 epochs a committee of 512 validators is randomly selected, and the committee is then Full Sync Committee rewards for participation in all 256 epochs. The MEV selection for each block is the same as before, but validators now receive beacon chain block rewards, as well as execution layer transaction fees (MEV).
# model full validator returns using previously calculated MEV ECDFs
# plot simulated full validator returns
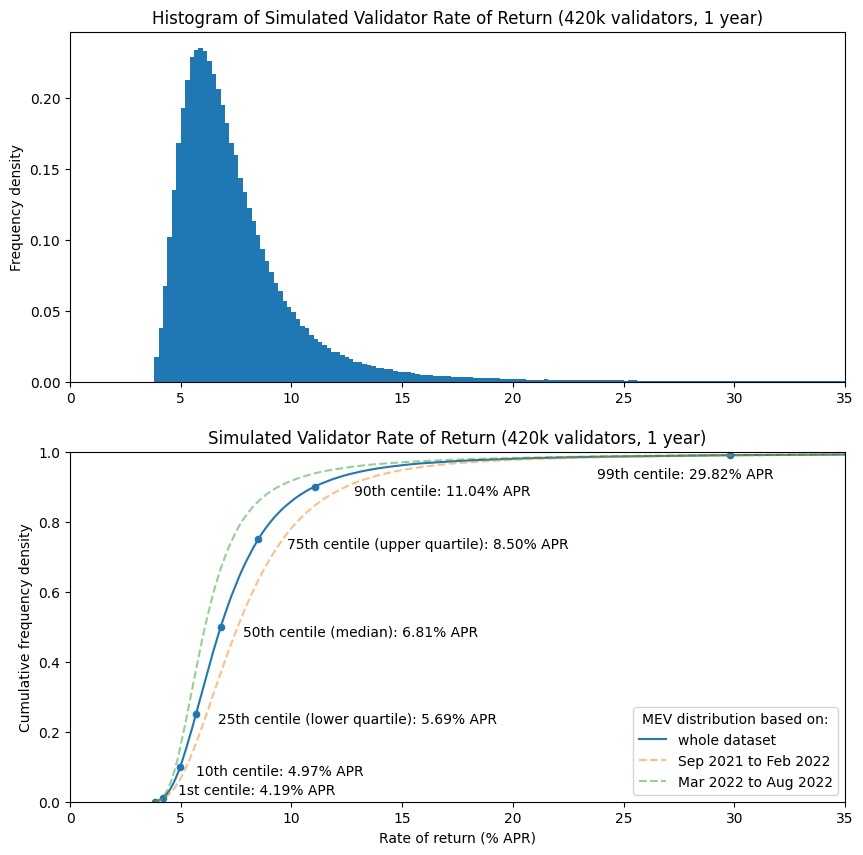
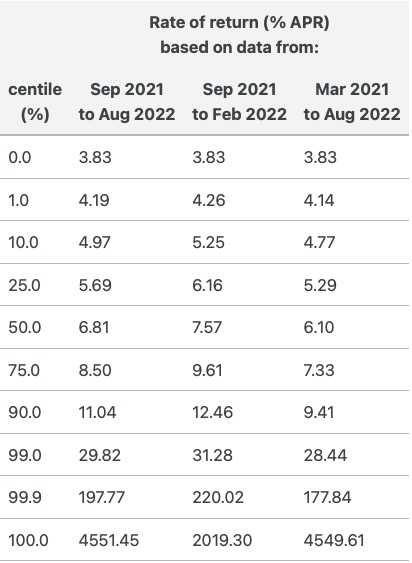
So, based on our full-year historical MEV dataset, and taking into account the reduction in the mean range, we arrive at a simulated return of roughly 5.7% and 8.5% for the "middle 50%" of validators. Meanwhile, the “luckiest 1%” of validators will earn a whopping 30% annual return, compared to 4.2% for the “unluckiest 1%”. The least profitable validator in the entire system still made a return of 3.8%, while the most profitable validator returned more than 4500% (or 45 times) during the year. However, the rate of return in this model does not include compound interest. In a real-world scenario, operators earning such large rewards may choose to set up new validators and earn even more as a result.
run multiple validators
The final question we want to consider is what is the distribution of rewards for stakers running multiple validators. In the chart below, validators in our simulated set (based on block revenue data for an entire year) are divided into groups of 2, 4, 8, 16, and 32 validators to compare ECDFs for different group sizes annual rate of return. The dashed red line in the figure represents the average reward rate for the entire validator set (i.e., the reward each validator would receive if all MEV and beacon chain rewards were shared equally). We expect the average rate of return to be what a large group of validators (such as Lido, or very large institutional stakers) earns before any fees are deducted.
# calculate ECDFs for 1 , 2 , 4 , 8 , 16 , 32 validators
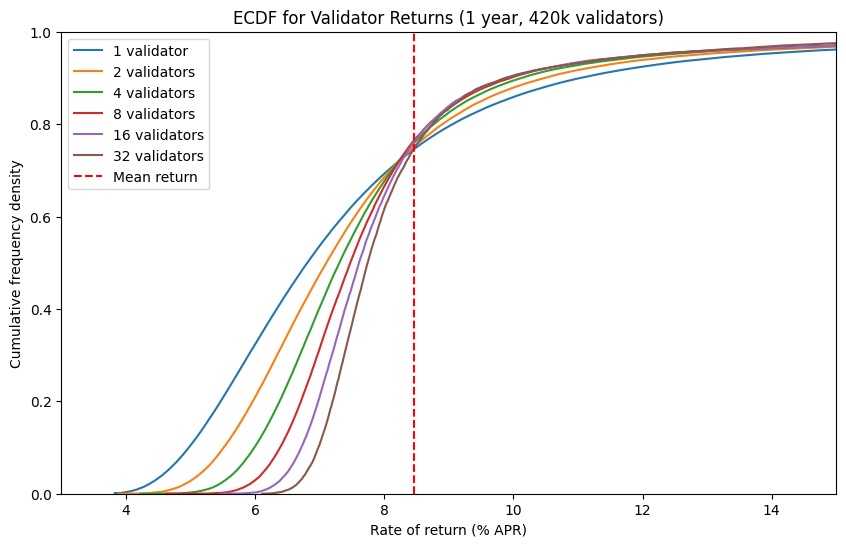
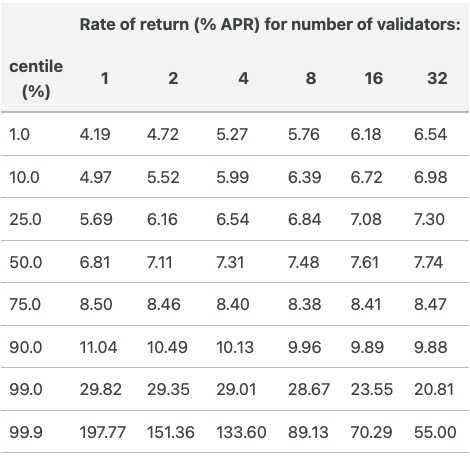
From the table we can see that the larger the validator size, the steeper the ECDF line will become. This is equivalent to the narrowing of the peak of the histogram, indicating that as the size of the verifier increases, the volatility of the return will continue to decrease. Not only that, but we can also observe that while running a single validator has an interquartile range (i.e. the difference in APR percentage between the 25th and 75th percentile) of about 2.8 percentage points, for 32 validators For the group, the interquartile range was only 1.2 percentage points.
in conclusion
in conclusion
In this post, we attempt to use past data to model the effect of merged executive layer fees on validator returns. We found that MEV increased returns to validators by about 3 percentage points when we used data from a period of high MEV (September 2021 to February 2022), but when using data from a period of low MEV (3 This figure drops to 1.5 percentage points when data are available for the period from August to August 2022. In both cases, the yield levels were rather volatile, with some validators receiving almost no MEV over the course of a year, and some earning far more than 100% annual returns. When we added consensus layer rewards, we found that well-behaved validators would earn at least 3.8% APR, with median annual returns ranging from roughly 6.1% (based on low MEV datasets) to 7.6% (based on ). We found that groups of validators have smoother returns than a single validator, although (at least to me) this effect is less pronounced than expected, with a group of 32 validators showing more volatility than a single validator. The volatility is about 2.3 times lower.
However, past performance is no guarantee of future returns. We do not yet know the extent to which MEV will be used by validators in the future, and what proportion will be ultimately obtained by other actors (applications, users, L2 sequencers, builders, relayers...). Therefore, the modeling results in this paper are not predictions of the future, but merely suggest several possible scenarios.
At the end of the article, I haven't talked about such a problem: After the merger, we can know the identity of the block producer of a certain slot in advance. As things stand, this change on proof-of-stake blockchains opens up new possibilities for atomic cross-chain transactions as well as multi-block MEV (since validators with a significant percentage of stake may be deployed on multiple blockchains synchronized block proposal). However, how these functions will be implemented is still a big unknown. Nonetheless, I hope this post gives validators some ideas on where they are going in Ethereum post-merger and how they should think about their own benefits, and perhaps this will help Proof of Stake in the coming weeks and months as well. And a few years to build their own ecology.